The strongest business valuations pull from five source classes: government and public data, public-company filings, commercial transaction comps, industry benchmarks, and the standards that govern how you use them. Start with SEC EDGAR filings and federal statistics for baseline credibility, then corroborate with granular industry benchmarks from a provider like Bizminer, whose data has held up in U.S. Tax Court. Document every source you touch.
TL;DR:
- Government and public data sources like BEA, IRS, and EDGAR provide verifiable numbers that serve as a reliable foundation for valuation, especially for cross-examination.
- Private transaction comps offer insights into actual deal prices but require careful filtering by deal structure, timing, and comparability, with rejection reasons documented for disputes.
- Industry ratios help verify operational norms before applying multiples, making granular NAICS codes and matched revenue bands essential for accuracy and reviewability.
- Data should be refreshed at least quarterly for public filings and annually or semi-annually for industry benchmarks, especially in fast-changing sectors like technology and healthcare.
- Using multiple data sources in triangulation and leveraging specialized benchmarks like Bizminer ensures credible, audit-ready valuations that withstand review or litigation.
Table of Contents
- What Are the Main Categories of Business Valuation Data Sources?
- What Government and Public Data Sources Should Valuers Use?
- How Reliable Are Private-Company Transaction Comps?
- When Should You Use Industry Ratios Instead of Multiples?
- Which Standards Govern Acceptable Valuation Data Sources?
- How Do You Access and Use Private Market Transaction Data Effectively?
- What Are the Limits of Economic and Market Condition Data in Valuations?
- How Often Should Valuation Data Be Refreshed?
- How Do You Account for Data Quality and Bias in Valuation Sources?
- A Practitioner’s Take on Triangulation and Common Mistakes
- How Bizminer Supports Defensible, Audit-Ready Valuations
- Sources
- FAQ
What Are the Main Categories of Business Valuation Data Sources?
Every valuation approach leans on a different mix of source categories. The three generally accepted valuation approaches are the asset-based, market, and income approaches, and the data you need shifts depending on which one you’re building.
- Government and industry benchmark data — (BEA, BLS, industry ratio providers) normalizes company financials and supports both market and income approach adjustments.
A practical sequence: pull the subject company’s financials first, then gather comparable public and private data, then benchmark against industry norms using deep analytics and advising for hospitality to sanity-check your conclusions. Write down why you picked each source; an examiner or opposing expert will ask.
What Government and Public Data Sources Should Valuers Use?
Government sources anchor a valuation in verifiable, third-party numbers no client can dispute. Four sources do most of the work.
- BEA industry data supplies value added, gross output, and intermediate input structure by industry, which is how you build industry context around a subject company’s numbers rather than relying on a single competitor’s filing.
- IRS IRM and job aids — spell out documentation expectations directly.
Bizminer’s data has been accepted in U.S. Tax Court, a credential that matters when a valuation report has to survive cross-examination, not just a client’s read-through.
These four sources rarely disagree in ways that matter, but they measure different things. EDGAR tells you what one company did; BEA tells you what an entire industry did. Treat them as complements, not substitutes.
How Reliable Are Private-Company Transaction Comps?
Private transaction databases fill the gap public filings can’t touch: what privately held businesses actually sold for. The data comes with real strings attached.
- Check the fields available. Sale price, implied multiple, NAICS code, deal date, and any deal notes on structure (asset sale versus stock sale, earnout terms, seller financing) all change how comparable a transaction really is.
- Weigh the sample size. Private-deal databases often return a handful of transactions for a narrow NAICS code and revenue band, compared to the deeper, more reproducible history available for public companies.
- Account for confidentiality gaps. Many private deals report a multiple range or omit terms entirely, so you’re working with partial information more often than with public comps.
- Flag recency. A transaction from three years ago in a volatile industry may no longer reflect current market conditions.
Pro Tip: Keep a running log of every comp you rejected and why. When a report gets challenged, that exclusion list often matters as much as the comps you kept.
Document the comparability adjustments you made for each deal you use, size, profitability, timing, right in your workpapers.
When Should You Use Industry Ratios Instead of Multiples?
Industry ratios and multiples answer different questions, and mixing them up is a common source of weak reports. A multiple tells you what similar companies sold for relative to earnings or revenue. A ratio (gross margin, inventory turnover, payroll as a percent of sales) tells you whether the subject company’s operations look normal for its industry.
- Use ratios to sanity-check the subject company’s adjusted financials before you apply a multiple to them.
- Use multiples when you have enough comparable transactions or public comps to support a market approach conclusion.
- Prefer narrow NAICS codes and matched revenue bands over broad industry averages. A six-digit NAICS filter with a matched size band beats a two-digit industry average every time a report faces scrutiny.
- Reconcile any gap between the subject company’s ratios and the industry benchmark explicitly. If the company’s margin runs 8 points above the industry median, say why.
Granularity is what separates a defensible benchmark from a generic one, and it’s the reason NAICS-segmented industry data tends to hold up better under review than a broad sector average.
Which Standards Govern Acceptable Valuation Data Sources?
Three frameworks shape what counts as acceptable evidence in a valuation report, and all three point the same direction: use multiple sources, document your reasoning, and match your evidence to the assignment’s purpose.
- USPAP requires competence in the subject matter, a defined scope of work, and documentation sufficient for another qualified appraiser to understand your conclusions.
- The IRS IRM and Revenue Ruling 59-60 lay out comparability standards, expecting appraisers to explain why comparables were included or excluded based on industry, size, and economic conditions.
- The intended use of the report, tax filing, litigation, transaction diligence, dictates how deep your sourcing needs to go. A tax valuation facing potential IRS review demands tighter documentation than an internal planning estimate.
Match your source selection to the standard governing the assignment before you start pulling data, not after.
How Do You Access and Use Private Market Transaction Data Effectively?
Getting access is the easy part. Using the data well is where most valuations lose credibility.
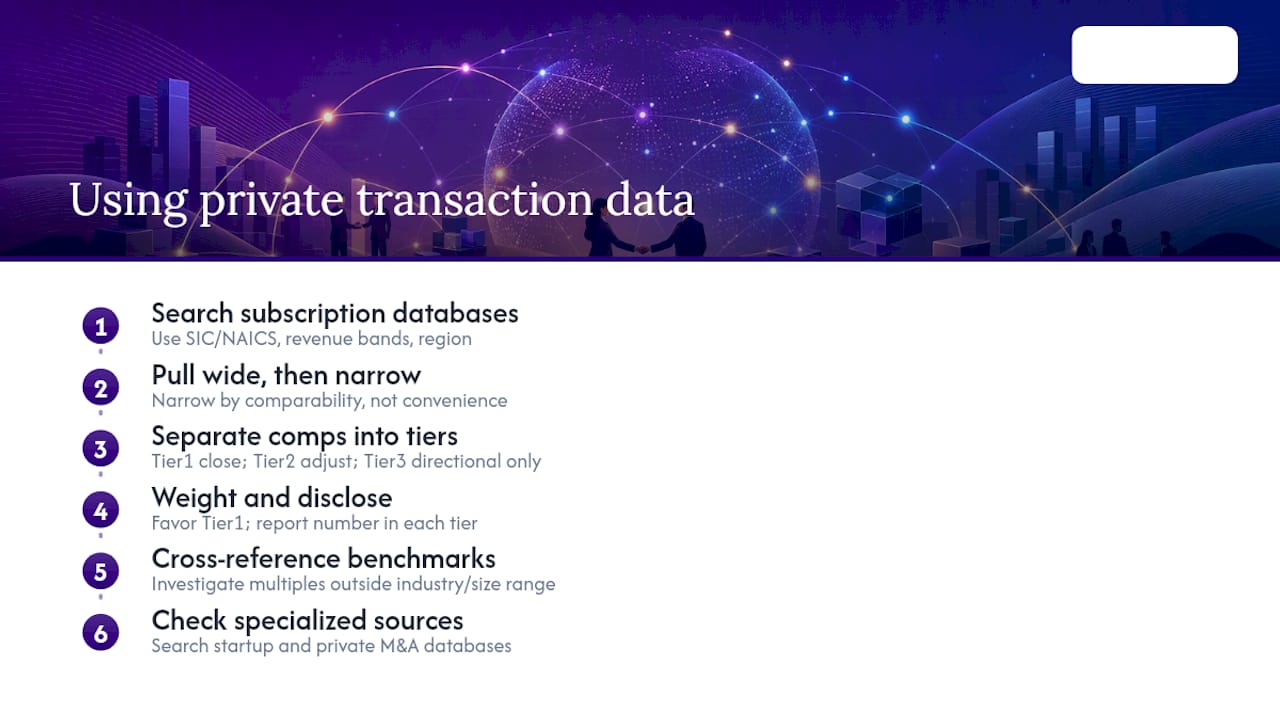
Most commercial transaction databases operate on subscription access, with search filters built around SIC or NAICS codes, revenue bands, and geographic region. Pull a wider net than you need at first, then narrow by comparability rather than convenience. A common mistake: accepting the first ten results a database returns because they fit the industry code, without checking whether deal structure, timing, or company size actually align with the subject business.
Once you’ve pulled a candidate set, separate the comps into tiers. Tier one comps match closely on industry, size, and timing. Tier two comps require an adjustment, maybe a size premium or a timing correction for market conditions at the deal date. Tier three comps are directional only, useful for a sanity check but not for a primary conclusion. Weight your final multiple selection toward tier one, and disclose in your report how many comps fell into each tier.
Cross-reference private deal multiples against your industry benchmark data before finalizing a conclusion. If a transaction multiple sits far outside the benchmark range for that industry and size band, either the deal had unusual terms you haven’t accounted for, or your benchmark comparison needs a second look. Specialized sources exist for startup funding rounds and private M&A that general transaction databases often miss, worth checking when the subject company is early-stage or high-growth.
What Are the Limits of Economic and Market Condition Data in Valuations?
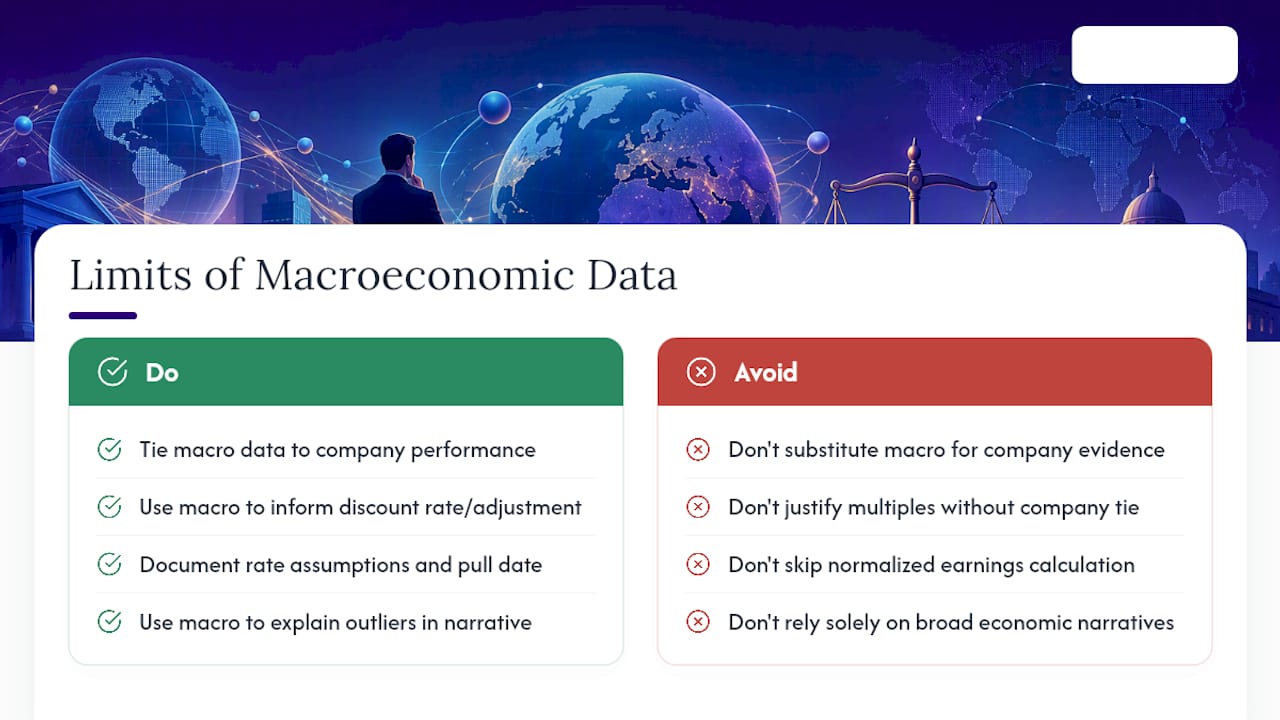
Macroeconomic data tells you the climate, not the company. Interest rate trends, GDP growth, and sector-wide demand shifts all belong in a well-supported discount rate or a market-timing adjustment, but they can’t substitute for company-specific evidence.
The most common misuse: appraisers lean on broad economic narratives (“the sector is growing”) to justify a multiple or growth rate without tying that narrative to the subject company’s actual performance. If GDP for a sector grew 3% but the subject company’s revenue has been flat for two years, the macro data doesn’t override the company’s own trend. It should inform your explanation of why the company underperformed its market, not paper over the gap.
Interest rate data matters most in the income approach, where a rising rate environment pushes discount rates up and depresses present value conclusions. Document the rate assumptions you used and the date they were pulled. Rates move fast enough that a discount rate calculated in January can look stale by the following quarter.
Use economic data to explain outliers and support your narrative, never as a stand-in for company-level or transaction-level evidence. A valuation report that cites unemployment figures and sector growth rates but skips a normalized earnings calculation for the subject company has its priorities backwards.
How Often Should Valuation Data Be Refreshed?
Stale data is one of the fastest ways to lose credibility in front of a reviewer or opposing expert. The right refresh cadence depends on the source type and the industry’s pace of change.
Public-company financials update quarterly with each 10-Q filing, so guideline public company comps should never run older than the most recent quarter unless you have a specific reason. Private transaction data moves slower since deals don’t happen on a fixed schedule, but a transaction older than 24 months needs a stated justification, especially in industries where valuation multiples have shifted meaningfully. Industry benchmark data typically updates annually or semi-annually depending on the provider, and you should always note the benchmark’s “as of” period in your report rather than assuming the reader knows.
Fast-moving sectors, technology, healthcare services, anything touched by recent regulatory change, demand tighter windows. A benchmark that’s a year old in a stable industry like dry cleaning services carries far less risk than one a year old in a sector reshaped by new legislation. Build your refresh schedule around the industry’s actual volatility, not a blanket rule.
Pro Tip: Set a calendar reminder to re-pull your core benchmark sources at the midpoint of any multi-month engagement. A valuation date six months out from your initial research often needs updated comps before the report goes final.
How Do You Account for Data Quality and Bias in Valuation Sources?
Every data source carries some bias, and pretending otherwise is worse than acknowledging it. Survivorship bias shows up constantly in transaction databases: businesses that sold successfully get recorded, while failed sale attempts or businesses that closed without a transaction often don’t appear anywhere.
Self-reported data carries its own risk. Some industry benchmark providers aggregate data from tax returns or financial statement submissions, which tends toward higher data quality, while others rely on survey responses, which can skew toward larger or more sophisticated respondents willing to participate. Know which type of collection method underlies any benchmark you cite, and say so in your workpapers.
Sample size interacts with bias in a specific way: a small sample doesn’t just reduce statistical confidence, it also amplifies whatever bias exists in how that sample was collected. A benchmark built from a few dozen self-reported surveys in a niche industry deserves more skepticism than one built from thousands of tax-return-derived statements. Cross-check any single-source figure against at least one independent source before relying on it for a final conclusion. If two independent sources point in different directions, that disagreement itself belongs in your report, not just the number you eventually chose.
A Practitioner’s Take on Triangulation and Common Mistakes
The single biggest mistake in valuation sourcing isn’t picking a bad database. It’s picking one good source and stopping there. Public filings plus industry benchmarks plus transaction evidence, corroborated against each other, beats any single source working alone.
Weak comp selection and thin documentation are what actually sink reports under scrutiny, not the sources themselves. If you work a niche industry regularly, a custom benchmark dataset or an API feed built for that segment pays for itself the first time a report gets challenged.
— Danny
How Bizminer Supports Defensible, Audit-Ready Valuations
Bizminer builds its benchmarks around NAICS-segmented data across more than 9,000 distinct markets, filtered by geography and company size, so you’re not stretching a broad category to fit a specific subject company. That granularity is the difference between a benchmark that survives cross-examination and one that invites a challenge.

Valuation professionals use Bizminer’s Valuation Report for tax and litigation assignments, its Industry Financial Performance reports for benchmarking adjustments, and its Company Profile reports for transaction diligence work. Reports are available for a one-off purchase fee in the range of a few hundred U.S. dollars for a Valuation Report and an Industry Financial Performance report. Firms handling recurring engagements often move to a custom API feed for automated access to the same underlying benchmark data. Given that Bizminer’s benchmarks are accepted in U.S. Tax Court, they hold up as corroborating evidence alongside your public filings and transaction comps. Check current pricing and report samples before your next engagement.
Sources
- 4.48.4 Business Valuation Guidelines | Internal Revenue Service
- BEA industry data — gross output by industry | Bureau of Economic Analysis
- Compustat | Baker Library
This article is general information, not a substitute for advice from a qualified financial advisor. Consult a qualified financial professional about your own circumstances before acting on anything here.
FAQ
How much is a business worth with $1,000,000 in sales?
There’s no fixed multiple that applies universally. Valuers typically apply an industry-specific multiple of revenue or, more often, of a normalized earnings figure like seller’s discretionary earnings, pulled from industry benchmark data and comparable transactions in that specific NAICS code. A business at that revenue level in a high-margin professional service will value very differently than one in a low-margin retail category.
What are the top three valuation methods?
The three generally accepted approaches are the asset-based approach, the market approach, and the income approach. Most credible valuations weigh all three and use professional judgment to decide which best fits the subject company’s situation.
Is there a website that can provide a business valuation?
Several platforms provide the underlying data valuers need rather than a finished valuation. Bizminer, for example, offers a Valuation Report product built on NAICS-segmented industry benchmarks, priced at $349 per report, that supports a professional’s own valuation work rather than replacing professional judgment.
How much is a business worth that makes $300,000 a year?
That depends heavily on whether the revenue or normalized earnings figure applies, and on the industry’s typical multiple. A service business earning owner-adjusted earnings might value in the low-to-mid multiple range of that figure, but the correct multiple only comes from checking comparable transactions and industry benchmarks for that specific business category.
Where should a valuer start when time is limited?
Start with SEC EDGAR filings and government statistics for baseline credibility, then pull a granular industry benchmark report to corroborate. That two-step sequence covers the most defensible ground before you invest time in private transaction comps.