A market-data due diligence checklist earns its keep only if it forces two things: a bottom-up market reconstruction that survives IC scrutiny, and independent customer evidence pulled straight from CRM records rather than management’s deck. Success looks like a reconciled TAM/SAM/SOM model, quantified downside scenarios tied to specific investment theses, and a scored risk register the deal team can act on. Before anything else, request the customer-level revenue file, a full CRM extract, and the contracts for the top 20 accounts.
TL;DR:
- Reconcile the market size with bottom-up TAM, SAM, and SOM models using independent data sources and customer records, not management presentations.
- Independently verify customer evidence through interviews that include churned and declined accounts, avoiding confirmation bias from seller-provided samples.
- Ensure CRM data is deduplicated, staged, and consistent, and verify sales pipeline health by analyzing conversion rates, deal velocity, and deal size distributions.
- Stress-test growth forecasts by comparing volume, price, and mix assumptions against actual contract and pipeline data, and treat M&A contributions as unverified.
- Quantify each risk and develop a scenario-based risk register, adjusting valuations or earn-outs if key assumptions, like TAM or retention, fall below thresholds.
Table of Contents
- The Full Market Data Due Diligence Checklist
- Reconstructing SAM From the Ground Up
- How Do You Design a Credible Customer Interview Program?
- Scrubbing CRM Data for Real Pipeline Signal
- Stress-Testing the Growth Forecast
- Testing the Moat: Competition Through the Customer’s Eyes
- Turning Checklist Findings Into an IC-Ready Risk Register
- What a Standard Commercial Due Diligence Timeline Looks Like
- Using Granular Benchmarks to Speed Up the Checklist
- Three Heuristics Every Analyst Should Default To
- How Bizminer Fits Into Your Diligence Workflow
- Sources
- FAQ
The Full Market Data Due Diligence Checklist
Work through six pillars in order. Each one either confirms or breaks a piece of the seller’s story, and the order matters because market sizing sets the ceiling everything else gets measured against.
- Market sizing. Request segment-level customer counts and ARPU data. Verify by rebuilding SAM bottom-up; green means it lands within 20% of management’s number, red means a gap over 40%.
- Customer evidence. Request a churn list, a declined-prospect list, and win/loss notes. Verify through independent interviews, aiming for 50 to 200 conversations depending on deal complexity. Fewer than 20 completed calls is a yellow flag regardless of deal size.
- CRM and pipeline. Request full opportunity-level exports for 24 months. Verify stage definitions are consistent; a pipeline that shrinks by more than 40% after deduplication is red.
- Forecasts. Request the model’s volume, price, and mix assumptions separately. Verify each against contract data; unexplained mix shifts over 15% of revenue are yellow.
- Competition. Request management’s competitor list and compare it against what customers actually name in interviews. A mismatch on the top three competitors is red.
- Synthesis. Score every thesis red, yellow, or green and map each to a valuation or term adjustment.
Data checks matter as much as data collection. Cross-reference at least three independent sources per major claim before it enters the report.
Reconstructing SAM From the Ground Up
Bottom-up math beats a management-supplied TAM slide almost every time, mostly because CIMs routinely blur the line between total addressable market and what a company can realistically reach. Buyers who skip the bottom-up rebuild and reconcile against top-down sources end up negotiating off an inflated number without knowing it.
Start with segment definition: how many buyers actually fit the seller’s ideal customer profile, broken out by geography, company size, and use case. Multiply that count by a defensible ARPU or ACV figure pulled from the seller’s own billing data, not their pitch deck. A company claiming 4,000 addressable customers at $18,000 ACV implies a SAM of $72 million. If the seller’s slide says $200 million, find out why.
Where the two numbers diverge outside that band, that’s the trigger to dig further, not to average the two and move on. Sources to request:
- NAICS-coded industry data with company counts by revenue band
- Government business-count datasets segmented by geography
- Billing or CRM exports showing actual customer counts and pricing tiers
- Third-party benchmark reports for the specific NAICS code in play
Document every assumption in a single page for the investment committee. A one-line footnote like “ARPU assumes 92% of customers on annual contracts, per Q3 billing export” is worth more than three paragraphs of narrative.
Pro Tip: *Build the SAM model in a format that lets you swap ARPU or segment-count assumptions and watch the number move in real time.
You can build this model faster with a step-by-step market sizing approach that walks through segment math and reconciliation in the same sequence.
How Do You Design a Credible Customer Interview Program?
Sample size and sample composition decide whether the interview program is evidence or theater. A rigorous CDD treats customer interviews as a thread running through every pillar, not a single line-item slotted between financial review and legal.
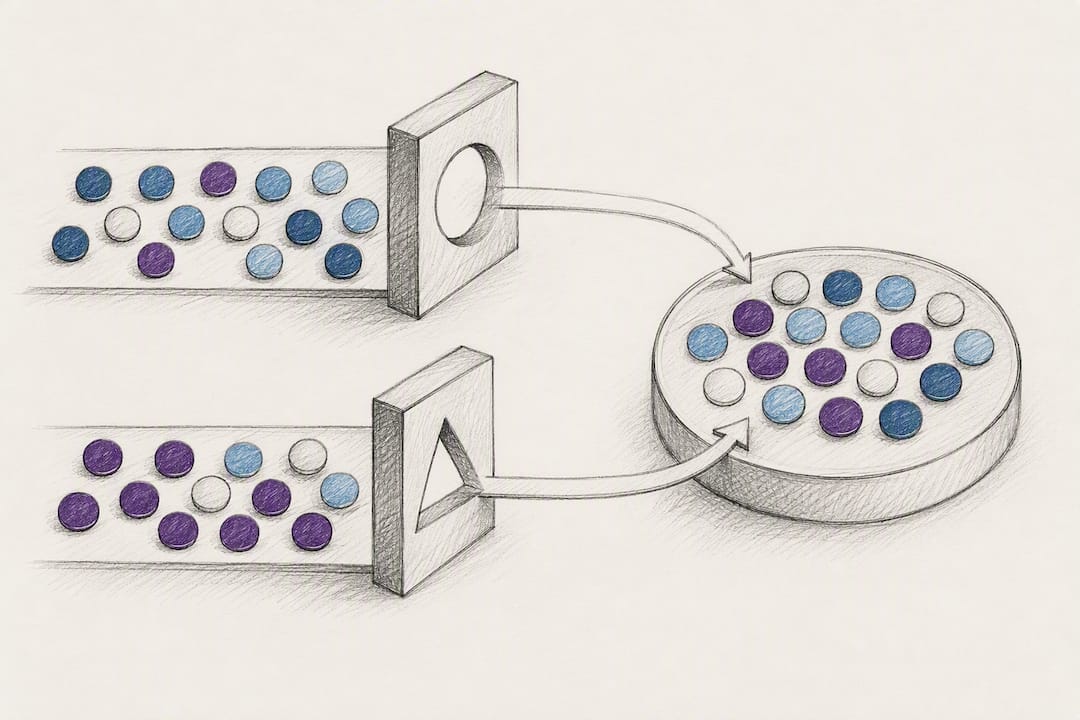
- Build the sampling frame first. Segment by ARR tier, tenure, geography, and status (active, churned, declined-to-buy). Missing churned accounts from the sample is the single most common shortcut, and it’s the one that most flatters the seller.
- Set the interview count to deal complexity. Simple, single-product businesses can get by with 50 conversations. Multi-segment platforms with complex buying committees need closer to 150 to 200 to reach saturation.
- Structure the guide in four parts. Open with a warm-up on how the customer uses the product day to day. Move to thesis probes that test specific claims (renewal intent, price sensitivity, switching cost). Ladder up from concrete behavior to underlying motivation. Close with an open question about what would make them leave.
- Keep questions non-leading. Ask “what would you do if the price went up 15%” instead of “would this price increase bother you.” The first invites a real answer; the second invites a polite one.
- Log everything. Recruitment source, screening criteria, call date, and verbatim quotes go into a shared file the IC can audit later.
Pro Tip: Recruit at least 15% of your sample from customers who declined to renew or never converted. A thesis that only survives contact with happy customers isn’t validated, it’s confirmed by selection bias.
Independent recruitment matters more than interview count. A sample sourced entirely through the seller’s customer success team will always skew favorable, no matter how many calls you run.
Scrubbing CRM Data for Real Pipeline Signal
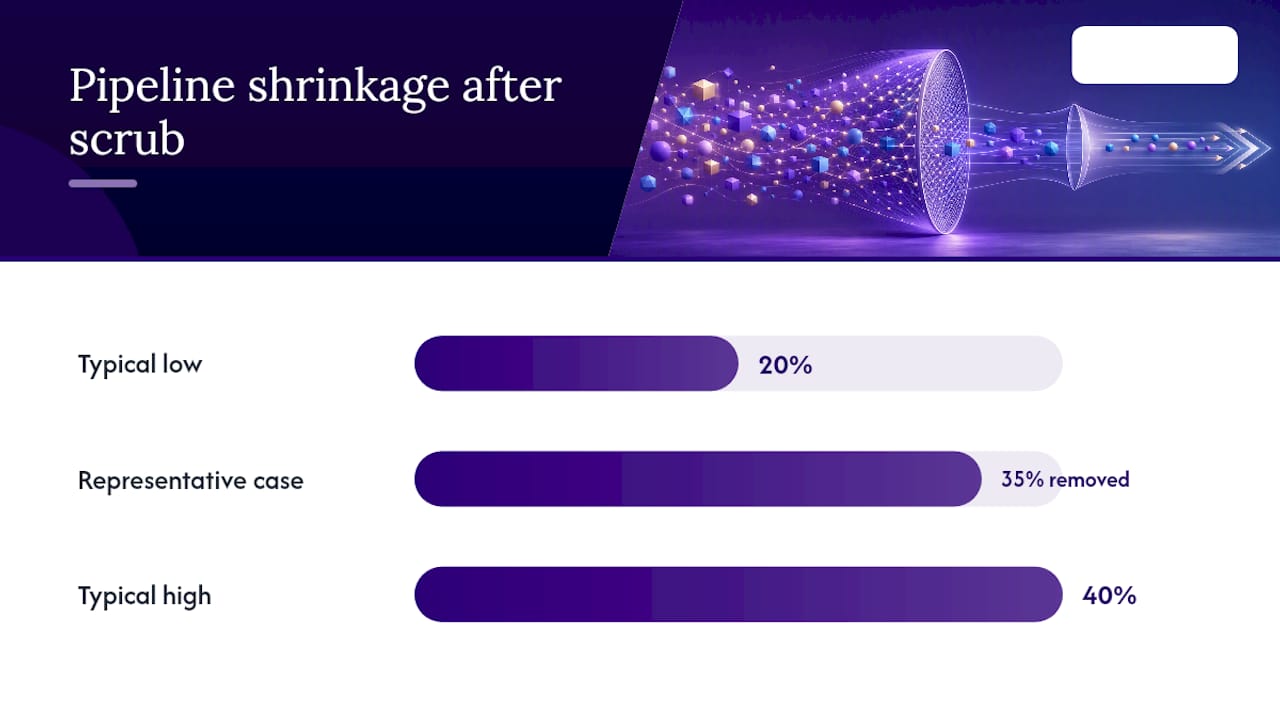
Most CRM instances arriving in a data room are messier than the seller believes, and the scrub itself is often the fastest way to test whether growth claims hold up. A pre-diligence CRM scrub commonly shrinks the working pipeline by 20% to 40% once duplicates and stale opportunities come out.
Run these steps in sequence:
- Deduplicate accounts and opportunities using company name, domain, and contact email as match keys.
- Force re-staging of any opportunity untouched for more than 90 days; either advance it, close it, or flag it as stalled.
- Require complete close-date and lead-source fields before including a deal in conversion math.
- Enforce one consistent stage definition across the sales team; reps often define “qualified” differently, and that alone can distort a funnel.
Once the data is clean, compute stage-to-stage conversion rates over a trailing 24-month window and decompose sales velocity into deal count, average deal size, win rate, and cycle length. A falling win rate paired with a rising average deal size often means the sales team is chasing fewer, larger deals to hit the same number, which is a different risk profile than the one in the CIM.
A CRM scrub that removes 35% of “active” pipeline isn’t a red flag by itself. It’s a red flag only when management’s forecast assumed that phantom pipeline would close.
Escalate anything involving missing deal metadata at scale, a bimodal deal-size distribution that suggests two different businesses are being reported as one, or contract files that don’t match what CRM shows as closed-won.
Stress-Testing the Growth Forecast
Every forecast breaks into four movable parts: volume, price, mix, and M&A. Test each one against a different evidence source rather than accepting the blended growth number at face value.
- Volume. Validate against cohort expansion data. Does the customer count in the forecast match new-logo trends from the CRM scrub?
- Price. Validate against actual contract data and ASP trends over the last eight quarters. A forecast assuming 8% annual price increases needs contracts showing that pattern already happening.
- Mix. Validate by checking whether the revenue mix shift (more enterprise, less SMB, for instance) matches what the pipeline scrub actually shows moving through the funnel.
- M&A. Treat any forecast contribution from planned acquisitions as unverified until a specific target and structure exists.
Where the data-driven projection falls short of management’s number, that gap becomes a negotiation lever, either as a valuation haircut or as an earn-out tied to hitting the original figure.
Testing the Moat: Competition Through the Customer’s Eyes
Management’s competitor slide and the customer’s actual shortlist are often two different documents, and the gap between them tells you more than either one alone. If customers mention a competitor that never appears in the CIM, that’s the real competitive set, and it deserves its own line in the risk register.
Evaluate the moat against four categories of evidence:
- Data assets. Does the seller hold proprietary data that’s genuinely hard to replicate, or just a large dataset a well-funded competitor could rebuild?
- Contractual friction. Multi-year terms, auto-renewal clauses, and penalty structures that make switching expensive on paper.
- Integration depth. How embedded the product is in a customer’s workflow, tested by asking customers directly how much rework a switch would require.
- Pricing power. Whether the seller has raised prices in the last two years without losing meaningful volume.
Customer quotes carry more weight here than management narrative. A customer who says switching would take “maybe two weeks and an intern” describes a much weaker moat than one who says it would require six months and a cross-functional project.
Turning Checklist Findings Into an IC-Ready Risk Register
Every checklist item eventually needs to become a score, not just a paragraph. Rate each investment thesis red, yellow, or green based on the strength and consistency of the evidence behind it, weighting independent customer interviews and CRM-verified metrics above management narrative or CIM claims.
Build downside scenarios for every yellow or red thesis. If the SAM reconstruction lands 35% below management’s number, model what that does to the five-year revenue case and translate it directly into a valuation adjustment or an earn-out structure tied to hitting the original projection.
A defensible CDD report pairs the risk register with specific integration priorities so the findings do more than flag problems.
| Thesis | Evidence Status | Risk Rating | Bid Implication |
|---|---|---|---|
| Market size supports 3x growth | Bottom-up SAM 40% below CIM figure | Red | Valuation haircut or reduced growth multiple |
| Customer retention is durable | Interviews show high satisfaction, low churn intent | Green | No adjustment needed |
| Pipeline supports next-year forecast | CRM scrub cut working pipeline by 38% | Yellow | Partial earn-out tied to bookings target |
What a Standard Commercial Due Diligence Timeline Looks Like
A typical commercial due diligence workstream runs four to six weeks. Week one covers data-room ingestion and CRM extraction. Weeks two and three run customer interviews and pipeline scrubs in parallel. Week four handles forecast testing and competitive analysis. The final week synthesizes findings into the IC report.
- Staff a lead analyst, a customer-interview coordinator, and a data analyst for the CRM and market-sizing work.
- Bring in an external interview panel when the internal team can’t hit the required sample size within the timeline.
- Budget for data licensing, interview incentives, and any bespoke analytics beyond standard CRM exports; interview volume is usually the single biggest driver of cost.
Using Granular Benchmarks to Speed Up the Checklist
Several checklist tasks move faster with a purpose-built data source instead of manually stitching together government statistics and CIM claims. Bizminer’s NAICS-coded industry benchmark tables map directly onto the bottom-up SAM build and ARPU sanity checks described above, and its exportable company lists give analysts a working segment count without a manual search.
- ARPU and segment checks: industry financial performance data by NAICS code and revenue band.
- Bottom-up SAM inputs: company lists filtered by geography and size.
- IC exhibits: custom company and market reports formatted for direct inclusion in the diligence deck.
Because the underlying benchmarks are accepted in U.S. Tax Court, they carry weight when a market-size number gets challenged in the IC meeting. A small pilot, one custom report or a targeted prospect list, is usually enough to test whether the approach fits before committing to a full data build.
Three Heuristics Every Analyst Should Default To
The checklist above works, but three habits separate analysts who catch problems early from those who find them after the wire transfer clears. First: build bottom-up before you ever look at management’s top-down number, so you’re not anchored to their frame. Second: never accept a customer reference list from the seller’s customer success team without independently sourcing at least a third of your interview sample yourself. Third: quantify cohort risk in dollars, not adjectives. “Some churn risk” doesn’t move a valuation model.
Each heuristic maps directly back to a thesis score. If you can’t quantify it, you can’t rate it green with a straight face.
— Danny
How Bizminer Fits Into Your Diligence Workflow
Bizminer gives deal teams a faster path to the bottom-up numbers this checklist demands, without waiting on a research team to manually pull NAICS data from scattered government sources. Where the checklist calls for segment counts, ARPU benchmarks, or a defensible market-size exhibit, Bizminer’s granular reports and prospect lists fill that gap directly, and the underlying data holds up because it’s accepted in U.S. Tax Court and used by government agencies.
Start small. Pull a Company Profile or Market Report for the target’s NAICS code to sanity-check management’s SAM claim before you commit analyst hours to a full manual rebuild. If the checklist calls for a customer count to seed your interview sampling frame, build a targeted prospect list instead of scraping directories by hand. Either move gets you a data-backed exhibit for the IC in days rather than weeks.
Sources
The frameworks referenced throughout this guide, from interview sampling methodology to CRM scrub mechanics and report structure, are worth bookmarking for the next deal.
- Commercial Due Diligence: The Complete Guide (2026)
- How to Do Sales Analysis for Mergers and Acquisitions (2026) – CT Acquisitions
This article is general information, not a substitute for advice from a qualified financial advisor. Consult a qualified financial professional about your own circumstances before acting on anything here.
FAQ
What should be included in a due diligence checklist?
A complete checklist covers market sizing, independent customer evidence, CRM and pipeline verification, forecast decomposition, competitive analysis, and a synthesized risk register. Each pillar needs specific source documents requested, a verification method, and a clear pass or fail threshold, not just a topic heading.
What are the “Four P’s” of due diligence?
Definitions vary by firm and industry, so there’s no single standardized version worth treating as canonical. Most commercial due diligence frameworks instead organize around market, customer, competitive, and financial pillars, which the checklist above follows directly.
What is a CDD checklist?
A commercial due diligence checklist is the ordered set of tasks a deal team runs to validate a target’s market position, customer base, and growth claims before an acquisition or investment. It typically produces a report with an executive summary, thesis validation, and a risk matrix tied to bid implications.
What is a DDQ questionnaire?
A due diligence questionnaire, or DDQ, is the formal document a buyer sends a target requesting specific data, contracts, and disclosures needed to complete the review. It usually accompanies the checklist rather than replacing it, since a DDQ requests documents while the checklist defines how to verify what those documents actually show.
Does Bizminer provide data usable for a market-data due diligence checklist?
Yes. Bizminer’s industry benchmark reports and company lists cover many markets and support bottom-up SAM builds, ARPU checks, and prospect-list generation for customer sampling. Current pricing for individual reports and prospect lists is listed on the Bizminer pricing page.