For SBA underwriting, industry benchmarks for debt-service coverage and liquidity are the first things to check. Historical DSCR of at least 1.15 is the baseline set in SBA procedural guidance, and lenders typically expect a higher cushion for volatile industries. Analysts can pull audit-ready, industry-specific figures from sources like Bizminer to support that comparison in a credit memo.
TL;DR:
- SBA underwriting requires a historical or projected DSCR of at least 1.15, but volatile industries often need a higher cushion of 1.25 to 1.35.
- Industry-specific benchmarks, such as interest coverage and liquidity ratios, must be supported by recent, granular data to ensure audit readiness and meaningful comparison.
- Underwriters must pair benchmark analysis with qualitative review and stress testing, documenting all assumptions and adjustments in the credit memo.
- Common errors include unsupported add-backs, inaccurate revenue projections, and mismatched NAICS codes, all of which delay approval and weaken the file.
- Using current, detailed benchmark reports from sources like Bizminer helps streamline the process and strengthens the defensibility of the loan decision.
Table of Contents
- Key benchmarks and how to calculate them
- How underwriters turn benchmarks into a lending decision
- Analyst checklist and common underwriting mistakes to avoid
- How benchmarks shift across 7(a), CDC/504, and microloans
- How economic cycles and pandemic-era shifts affect benchmarks
- Case examples showing benchmarks in action
- The typical timeline from application to funded loan
- Notes from the data side of underwriting
- How Bizminer helps with audit-ready SBA underwriting
- Sources
- FAQ
Key benchmarks and how to calculate them
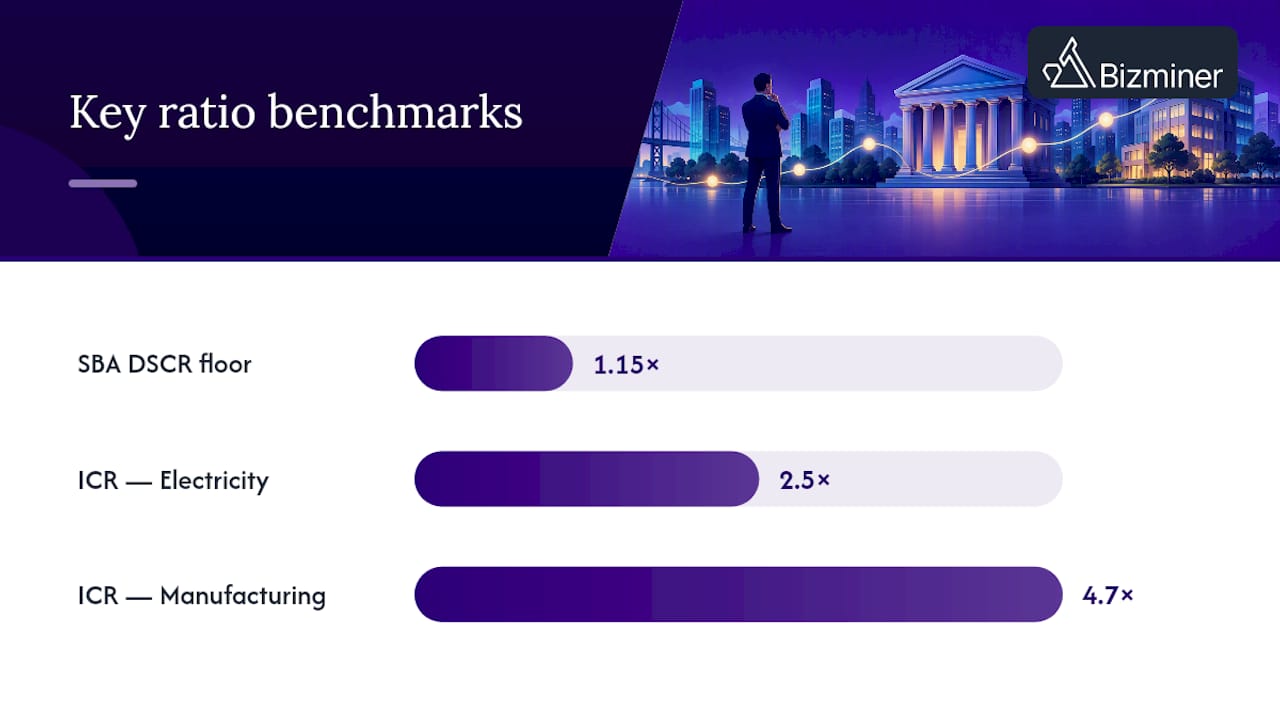
The debt-service coverage ratio, or DSCR, is operating cash flow divided by total debt service. SBA procedural guidance sets a floor of 1.15 on historical or projected cash flow, meaning a borrower’s operating cash flow needs to cover annual debt payments with at least 15% left over. Getting there requires care with add-backs: officer compensation, one-time expenses, and depreciation adjustments all shift the numerator, and undocumented add-backs are one of the fastest ways to lose credibility in a loan file.
The most useful ratios to compute for an SBA file:
- Debt-service coverage ratio: operating cash flow divided by total debt service, historical and pro forma.
- Interest coverage ratio: earnings before interest and taxes divided by interest expense, which varies sharply by sector.
- Fixed charge coverage ratio: earnings before fixed charges and taxes divided by fixed charges plus interest, useful when leases or rent obligations are material.
- Current and quick ratios: current assets (or current assets minus inventory) divided by current liabilities, a snapshot of short-term liquidity.
- Leverage ratios and profitability margins: debt-to-equity or debt-to-EBITDA, plus gross and net margins, to frame how much cushion the balance sheet itself provides.
Interest coverage ratios differ meaningfully by industry. Federal Reserve analysis found electricity-sector ICR near 2.5 versus manufacturing (excluding oil) closer to 4.7, a gap wide enough to make a single cross-industry threshold misleading.
On the calculation side, operating cash flow is not the same as EBITDA. EBITDA ignores changes in working capital and cash taxes, while OCF captures them, so a file that substitutes one for the other without noting the difference invites questions. When a guarantor’s personal debts are material, lenders often move to a global cash flow analysis that nets business and personal obligations together rather than looking at the business in isolation.
How underwriters turn benchmarks into a lending decision
Industry benchmarks tell an underwriter where a borrower sits relative to peers, but they are a comparator, not a verdict. OCC examiner guidance makes this explicit: quantitative ratio analysis has to be paired with qualitative underwriting, attention to the balance sheet, and documented cash flow scrutiny. A DSCR that clears 1.15 does not close the file on its own.
In practice, underwriters move through a sequence:
- Pull the borrower’s historical and pro forma DSCR, then compare it against the relevant industry benchmark.
- Flag any gap between the borrower’s figure and the peer median, and require an explanation when the gap is wide in either direction.
- Adjust the required cushion for industry volatility. A restaurant or a seasonal contractor might need DSCR of 1.25 to 1.35 rather than the 1.15 floor, because revenue swings faster than fixed debt payments.
- Run a stress test, typically a downside revenue scenario of negative 10%, and recompute DSCR under that assumption.
- Document every assumption behind the pro forma, including growth rates and add-back rationale, in the credit memo.
FDIC’s small-business lending survey confirms that lenders rank a borrower’s financial position, including DSCR and liquidity, as the top underwriting factor, ahead of most qualitative considerations. That does not make qualitative review optional. Regulator guidance repeatedly frames benchmarks as a trigger for deeper analysis rather than an automatic approval or denial, and the file needs to say why a borrower differs from its peers when it does.
Pro Tip: Build the stress-case DSCR into every memo, even when the base case clears 1.15 comfortably. A documented downside scenario protects the file if actual performance later falls short.
Analyst checklist and common underwriting mistakes to avoid
A defensible SBA file follows a repeatable sequence, and skipping steps is where most weak files fall apart.
- Collect three years of historical financials plus the most recent interim statement.
- Compute DSCR, interest coverage, fixed charge coverage, and liquidity ratios for both historical and pro forma periods.
- Document every add-back, including officer compensation, with support rather than assertion.
- Confirm the NAICS code and geography match the benchmark source being cited.
- Run at least one stress scenario and record the resulting DSCR.
- Attach the benchmark methodology, sample size, and vintage to the credit memo alongside the borrower’s own ratios.
The mistakes that show up most often in weak files are predictable. SBA audit findings point to lenders relying on rule-of-thumb cash flow instead of actual cash flow, accepting unsupported projections, or understating officer compensation, all of which inflate DSCR and produce loans without reasonable assurance of repayment. Inconsistent NAICS mapping and ignoring an industry’s normal cyclicality are close behind.
For documentation, the loan file should hold more than the final ratios: the underlying data extract, a short methodology note, and a copy of the benchmark report itself. That combination is what turns a plausible-looking number into an audit-ready one. Working capital by industry benchmarks, covered at NAICS benchmarks for working capital, are a useful supplement when liquidity is the borderline factor.
How benchmarks shift across 7(a), CDC/504, and microloans
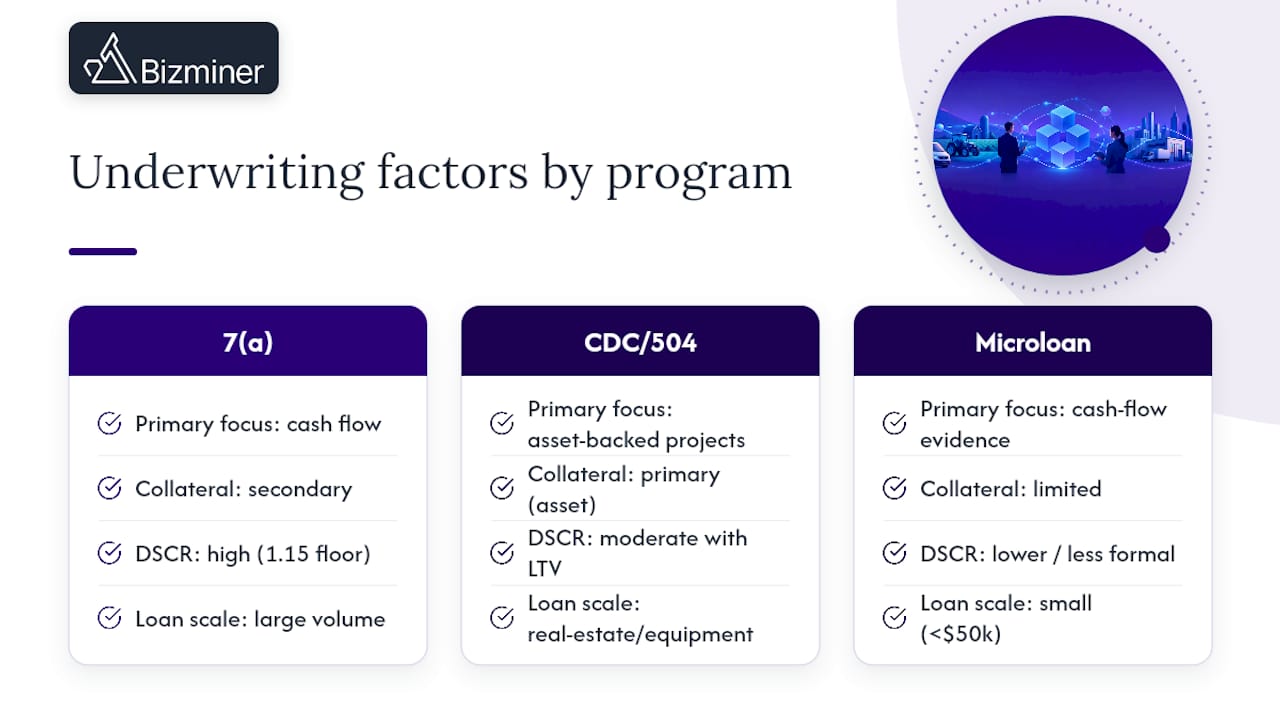
SBA benchmarks are not applied uniformly across every program. The 7(a) program, the largest by volume, leans hardest on DSCR and cash flow analysis because most 7(a) loans finance working capital, acquisitions, or refinancing where repayment comes directly from ongoing operations. Underwriters there tend to scrutinize historical and pro forma DSCR most closely, and the 1.15 floor from SBA procedural guidance is the anchor point for that analysis.
CDC/504 loans, used for fixed assets like real estate and heavy equipment, add collateral value and loan-to-value considerations to the DSCR picture. Because the asset itself secures much of the loan, underwriters weigh appraised value and useful life alongside cash flow coverage rather than relying on DSCR in isolation.
Microloans, generally under $50,000, involve less formal ratio analysis given their smaller size and shorter terms, but the underlying principle does not change: lenders still want evidence the business generates enough cash to service the debt. The documentation burden is lighter, though the same due diligence around historical financials and realistic projections still applies at a smaller scale.
The common thread across all three programs is that benchmarks set the starting expectation, and program-specific mechanics (collateral for 504, cash flow for 7(a), simplified underwriting for microloans) determine how much weight that expectation carries in the final decision.
How economic cycles and pandemic-era shifts affect benchmarks
Industry benchmarks are not fixed numbers. They move with the broader economic cycle, and an analyst pulling a benchmark report needs to check the vintage of the data before applying it to a current file. A benchmark calculated from a strong expansion year will overstate what a typical borrower can achieve during a slowdown, and the reverse holds too.
The pandemic period made this especially visible. Industries like restaurants, hospitality, and in-person retail saw revenue and cash flow benchmarks swing sharply between 2020 and the recovery years that followed, while sectors tied to e-commerce or remote services moved in the opposite direction. An underwriter comparing a 2026 loan applicant against a stale pre-pandemic benchmark risks either an unrealistically strict or unrealistically lenient comparison, depending on which industry and which years are involved.
The practical response is to treat benchmark vintage as seriously as benchmark accuracy. A report should state its sample year plainly, and analysts should favor the most current available data for cyclical industries in particular. Where an industry is still working through post-pandemic normalization, a wider stress-test range, rather than a single downside scenario, gives the credit memo more room to reflect genuine uncertainty. This is also where a documented, dated benchmark extract matters most for audit defensibility: a reviewer checking the file months or years later needs to see which period the comparison was drawn from.
Case examples showing benchmarks in action
Consider a full-service restaurant applying for a 7(a) loan to finance a buildout. Its historical DSCR comes in at 1.18, just above the SBA floor, but the industry benchmark for full-service restaurants shows a median closer to 1.30 given the sector’s revenue volatility. An underwriter following this pattern would not reject the loan outright, but would require a stress-tested pro forma showing DSCR holding above 1.0 even under a 10% revenue decline, plus documentation of the owner’s add-backs.
A different pattern shows up in a professional services firm seeking a CDC/504 loan for office space. Its DSCR of 1.45 comfortably clears both the SBA floor and the industry median for that NAICS code, and its liquidity ratios sit near the top of the peer range. Here, the benchmark comparison mainly confirms that the deal is straightforward, letting the underwriter focus review time on collateral valuation rather than repayment risk.
A third pattern involves a seasonal landscaping business requesting a microloan. Its annual DSCR looks weak on paper because most of its revenue lands in six months of the year, but a benchmark that accounts for seasonal cash flow patterns in that NAICS code shows the business performing in line with peers once the timing is normalized. The lesson across all three: the benchmark itself does not approve or deny anything, but it tells the underwriter exactly where to focus.
The typical timeline from application to funded loan
SBA underwriting that leans on industry benchmarks generally moves in stages, though the exact pace depends on loan size, program, and lender.
After the borrower submits historical financials, tax returns, and a business plan, the lender’s credit team typically spends one to two weeks compiling and verifying that documentation. Ratio calculation and benchmark comparison happen next, usually alongside the request for any missing add-back support or clarification on projections. This is the stage where a benchmark mismatch or an undocumented adjustment most often causes delay, since the underwriter has to go back to the borrower for clarification.
Once the financial analysis is complete, the file moves to credit committee or SBA-designated underwriting review, where the benchmark comparison, stress test, and qualitative factors are weighed together. For 7(a) loans processed under delegated authority, this stage can move in days; for loans requiring full SBA review, it can take several weeks longer. CDC/504 loans add a parallel track for collateral appraisal and CDC processing, which typically extends the overall timeline compared to a 7(a) loan of similar size.
The single biggest lever an analyst has over that timeline is the completeness of the initial file. A credit memo that already includes benchmark methodology notes, sample sizes, and documented stress tests moves through committee review with far fewer round trips than one built on rule-of-thumb assumptions that surface only under questioning.
Notes from the data side of underwriting
The friction that slows down SBA files rarely comes from the DSCR math itself. It comes from mismatched NAICS codes, benchmark samples too small to trust, and add-backs asserted without support. Each one forces a second look, and a second look means delay.
Granular, dated, and documented benchmarks shorten that cycle because they answer the reviewer’s next question before it gets asked. Reliable benchmark reports should be built around that principle, with data accepted in official proceedings and used by government agencies when the sourcing holds up to scrutiny.
— Danny
How Bizminer helps with audit-ready SBA underwriting
Building a defensible SBA file often comes down to how quickly you can produce a benchmark that matches your borrower’s exact NAICS code, geography, and size band, with the sourcing to back it up. Some financial data platforms offer granularity that lets accountants, advisors, and loan officers filter benchmark data rather than settling for a broad industry average.
The relevant products for a loan file include:
- Industry Financial Performance reports, priced at $249 per report, for benchmark ratios by NAICS code.
- Company Profile reports, also $249 per report, when a borrower’s individual financials need a peer comparison.
- Custom Financial Report and Company Report options, at $349 per report, for a more detailed writeup suited to a credit memo attachment.
Full pricing and report options are listed on the Bizminer pricing page, and analysts preparing loan files can review audit-ready benchmarks for underwriting built specifically for this kind of documentation.
Sources
- Federal Reserve — interest coverage ratios of the U.S. nonfinancial corporate sector
- FDIC small-business lending survey 2024 — loan underwriting and approval
- OCC — Rating credit risk (Comptroller’s Handbook)
FAQ
What DSCR is required for an SBA loan?
SBA procedural guidance sets a floor of 1.15 on historical or projected operating cash flow relative to total debt service, according to SBA guidance. Lenders often expect a higher cushion for borrowers in volatile industries.
How do lenders account for industry differences in coverage ratios?
Coverage ratios like interest coverage vary widely by sector, as Federal Reserve analysis shows, with electricity companies running far lower ratios than manufacturers. Lenders adjust their required cushions to match the borrower’s specific industry rather than applying one number across every sector.
What documentation makes a benchmark audit-ready?
An audit-ready benchmark extract states its NAICS code, sample size, sample year, and calculation methodology alongside the ratio itself. Bizminer builds its reports around these markers, which is part of why its data has held up in U.S. Tax Court proceedings.
What mistakes most often weaken an SBA loan file?
SBA audit findings point to rule-of-thumb cash flow calculations, unsupported revenue projections, and understated officer compensation as recurring problems. Each one artificially inflates DSCR and weakens the file’s assurance of repayment.
Do benchmark requirements differ between 7(a) and CDC/504 loans?
Yes, 7(a) loans lean more heavily on cash flow and DSCR since repayment typically comes from operations, while CDC/504 loans weigh collateral value and loan-to-value alongside coverage ratios. Both programs still expect documented historical financials and realistic projections regardless of which ratio carries the most weight.