For accounting and advisory firms that need defensible, granular industry benchmarks, Bizminer is the recommended ProfitCents replacement. It covers 9,000+ industry markets, delivers data accepted in U.S. Tax Court, and ships reports via subscription, one-off purchase, or API. Beyond Bizminer, several alternative categories exist, each suited to different advisory tasks.
- Enterprise FP&A platforms (Planful, Workday Adaptive Planning, Jedox, Prophix Budgeting): best for firms running rolling forecasts and board-level reporting, not industry peer benchmarking.
- BI and visualization tools (Tableau, Looker, Domo, Google Data Studio, Phocas, Harmoni): best when you already have the data and need to surface it visually for clients.
- Statistical analysis suites (SAS Viya, IBM SPSS Statistics, Minitab, XLSTAT, MATLAB): best for research-heavy or quantitative work; steep learning curve for typical advisory workflows.
- Industry benchmarking services (EngineRoom, SaaSGrid, Triple Whale): best for niche verticals (e-commerce, SaaS metrics) rather than broad cross-industry advisory.
- Budgeting and forecasting suites (Centage Budget Maestro Enterprise, Serenic Navigator, Flexi Software, Unanet Project Portfolio Financials, Deltek Ajera): best for internal finance teams managing budgets, not client-facing benchmarking.
- ERP financial modules (SAP Analytics Cloud, Exact Globe Next, JD Edwards EnterpriseOne Advanced Real Estate Forecasting, Yardi Advanced Budgeting and Forecasting): best for large enterprises with existing ERP infrastructure.
- Self-service advisory tools (Sage Intacct, RightCapital, Gini, Pepper, TallyPrime): best for specific client-service niches (wealth planning, SMB accounting) rather than broad industry analysis.
Market aggregator listings on G2, Capterra, and GetApp map the full competitive field, but the decisive filter for ProfitCents users is benchmark coverage and data defensibility, not feature overlap.
Key Takeaways
Bizminer offers comprehensive industry benchmarking capability, covering many markets with data accepted in U.S. Tax Court and delivered via subscription or other formats.
| Point | Details |
|---|---|
| Benchmark coverage is the deciding factor | Filter alternatives first by industry coverage and data provenance, not feature lists or UI. |
| FP&A and BI tools need a data source | Planful, Tableau, and similar tools cannot produce peer benchmarks without an external data provider feeding them. |
| Peer group construction quality matters | Always request documentation on how benchmark peer groups are built before committing to any vendor. |
| Bizminer covers 9,000+ markets with Tax Court provenance | Its data is accepted in U.S. Tax Court and used by government agencies, meeting a higher evidentiary standard than most alternatives. |
| Test with real client data before deciding | Run a vendor demo using an actual client industry and revenue band to verify peer group relevance and report quality. |
Table of Contents
- How the top ProfitCents alternatives compare at a glance
- Profiles of Bizminer and the practical alternative categories
- How to choose the right ProfitCents alternative for your firm
- Why Bizminer stands out for accountants and advisory firms
- When to recommend Bizminer versus a planning or BI tool
- Bizminer is the direct replacement for ProfitCents benchmarking
- Where to learn more
- Sources
How the top ProfitCents alternatives compare at a glance
The table below maps each alternative category and Bizminer against key dimensions relevant to advisory buyers, based on general market analysis. ProfitCents’ core strengths sit in industry benchmarking, financial ratio analysis, and peer-group reporting. Any replacement must address at least those three before you evaluate FP&A or visualization features.
| Option | Best for / typical buyer | Core capabilities | Benchmark coverage | Report customization | Integrations / API | Pricing model | Deployment |
|---|---|---|---|---|---|---|---|
| Bizminer | Accounting firms, advisors, valuation teams | Industry benchmarks, ratio analysis, SWOT, valuation, market trends | 9,000+ markets; granular by NAICS, size, geography | High; custom report builder, templates | data feeds, export | Subscription, one-off reports, API license | Cloud SaaS |
| Enterprise FP&A platforms | Mid-to-large finance teams needing rolling forecasts | Budgeting, forecasting, scenario modeling, consolidation | Minimal native benchmarking; relies on imported data | Moderate; template-driven | ERP, GL, CRM connectors | Subscription; enterprise pricing | Cloud |
| BI and visualization tools | Firms with existing data needing client-facing dashboards | Data visualization, dashboards, ad hoc reporting | None native; user-supplied data only | High visual customization | Broad connector libraries | Subscription; freemium tiers available | Cloud / on-prem |
| Statistical analysis suites | Quantitative analysts, researchers | Regression, predictive modeling, statistical testing | None native | Output-focused; limited templates | Data import/export; limited ERP | Perpetual license or subscription | Desktop / cloud |
| Industry benchmarking services | Niche verticals (SaaS, e-commerce) | KPI benchmarking, peer comparisons | Narrow; vertical-specific | Limited | API; platform-specific | Subscription | Cloud |
| Budgeting and forecasting suites | Internal finance teams | Budget management, variance analysis, project financials | Minimal | Moderate | ERP, accounting system connectors | Subscription | Cloud / on-prem |
| ERP financial modules | Large enterprises on existing ERP | Financial consolidation, planning, real estate forecasting | Minimal native | Moderate; ERP-dependent | Native ERP ecosystem | Enterprise license | On-prem / cloud |
| Self-service advisory tools | Wealth planners, SMB accountants | Client financial planning, bookkeeping, tax prep | None to minimal | Low to moderate | Accounting software connectors | Subscription | Cloud |
Key constraints to note:
- Enterprise FP&A platforms typically require 3–6 months of implementation and dedicated IT support. They are planning engines, not benchmarking data sources.
- BI tools require you to bring your own benchmark data. Without a provider like Bizminer feeding them, they produce no industry peer comparisons.
- Statistical suites assume quantitative expertise. IBM SPSS Statistics and MATLAB are not designed for client-facing advisory reports.
- ERP modules (JD Edwards EnterpriseOne Advanced Real Estate Forecasting, Yardi Advanced Budgeting and Forecasting) are meaningful only if the firm already runs that ERP stack.
Profiles of Bizminer and the practical alternative categories
Bizminer
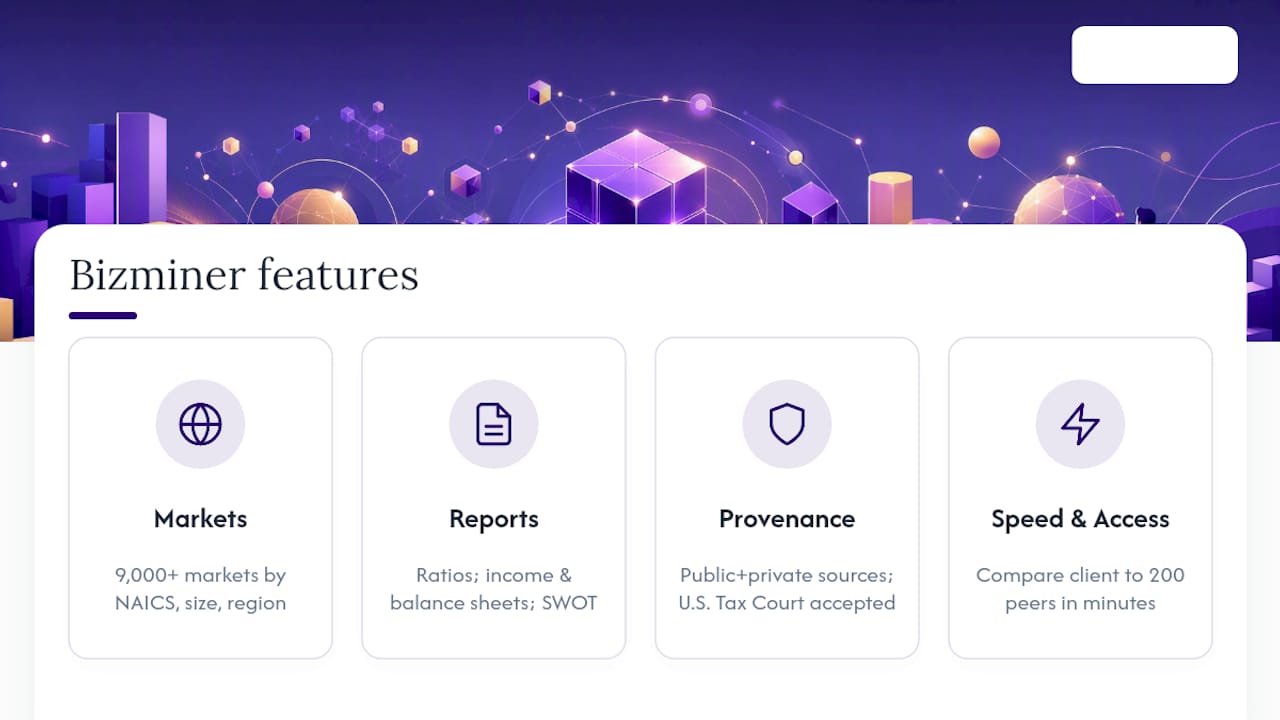
Bizminer delivers customizable industry financial benchmarks across 9,000+ markets, segmented by NAICS code, company size, and geography. Reports cover financial ratios, income statements, balance sheets, market trends, SWOT analysis, and valuation multiples. Data is sourced from public and private datasets, documented for provenance, and accepted in U.S. Tax Court, which matters when a client’s return is under examination or a valuation is contested.
Delivery is flexible: annual subscriptions for firms that run benchmarking regularly, one-off report purchases for occasional engagements, and an API for firms that want to pipe benchmark data directly into their own tools. Sample products are available before purchase, so you can verify format and data depth before committing.
For accounting professionals who need to show a client exactly how their gross margin compares to 200 peers in the same NAICS code and revenue band, Bizminer produces that output in minutes, not hours of manual research.
Enterprise FP&A platforms
Planful, Workday Adaptive Planning, Jedox, and Prophix Budgeting are purpose-built for internal financial planning: rolling forecasts, scenario modeling, consolidation, and board reporting. They are strong where ProfitCents is weak (forward-looking planning) and weak where ProfitCents is strong (external industry benchmarking). Firms that need both typically pair an FP&A platform with a benchmarking data provider.
Pricing is enterprise-tier, demos are available on request, and implementation typically involves a professional services engagement. None of these platforms ship native industry peer data.
BI and visualization tools
Tableau, Looker, Domo, Phocas, Harmoni, and Google Data Studio excel at turning data into client-facing dashboards. The critical limitation: they are blank canvases. They visualize whatever data you feed them. Without a benchmarking data source, they cannot produce industry peer comparisons. Finoview illustrates how visual financial analysis tools map ratios to line items and standardize client reporting, but the underlying benchmark data still needs to come from somewhere.
Google Data Studio (now Looker Studio) is free and widely used for lightweight reporting. Tableau and Looker carry enterprise pricing. All offer free trials or freemium tiers.
Statistical analysis suites
SAS Viya, IBM SPSS Statistics, Minitab, XLSTAT, and MATLAB are the right tools for quantitative researchers running regression models, predictive analytics, or statistical process control. For a CPA firm producing client benchmarking reports, they are overkill and require significant statistical expertise to operate. They have no native financial benchmarking data and no client-report templates out of the box.
Industry benchmarking services
EngineRoom, SaaSGrid, and Triple Whale each serve narrow verticals. SaaSGrid focuses on SaaS metrics (ARR, churn, NRR). Triple Whale is built for e-commerce analytics. EngineRoom targets operational benchmarking. None covers the broad cross-industry NAICS-based benchmarking that ProfitCents users rely on for general advisory work. Live KPI benchmarking across thousands of companies is valuable, but vertical-specific tools leave multi-industry advisory firms with coverage gaps.
Budgeting and forecasting suites
Centage Budget Maestro Enterprise, Serenic Navigator, Flexi Software, Unanet Project Portfolio Financials, and Deltek Ajera are designed for internal finance and project-based businesses. Deltek Ajera targets architecture and engineering firms specifically. Serenic Navigator is built for nonprofits and government entities. These tools manage budgets and project financials well but are not designed to produce external industry benchmarking reports for clients.
ERP financial modules
SAP Analytics Cloud, Exact Globe Next, JD Edwards EnterpriseOne Advanced Real Estate Forecasting, and Yardi Advanced Budgeting and Forecasting are extensions of larger ERP ecosystems. Their forecasting and planning capabilities are strong within their native environments. Outside those environments, they require significant integration work and carry enterprise licensing costs. Real estate-specific modules like JD Edwards EnterpriseOne Advanced Real Estate Forecasting and Yardi are purpose-built for property portfolios, not general advisory benchmarking.
Self-service advisory tools
Sage Intacct handles cloud accounting and financial management for mid-market companies. RightCapital is a financial planning platform for wealth advisors. Gini and Pepper target SMB financial management and expense tracking. TallyPrime is an accounting and inventory management tool popular in specific markets. Each serves a defined niche well. None replicates ProfitCents’ industry peer benchmarking capability.
How to choose the right ProfitCents alternative for your firm
The feature lists across these categories overlap enough to create real confusion. These criteria cut through it.
1. Benchmark coverage and data provenance
Ask every vendor: which industries do you cover, at what geographic granularity, and how is the peer group constructed? A tool that covers 200 industries is not equivalent to one covering 9,000. More importantly, ask for the data source documentation. If a vendor cannot tell you where the benchmark data originates, that data cannot be used in a tax examination or contested valuation.
2. Financial ratio coverage
ProfitCents users rely on a specific set of ratios: liquidity, profitability, efficiency, leverage, and coverage. Check the vendor’s financial ratios glossary or equivalent documentation against your standard client report template before signing anything.
3. Update frequency
Annual benchmark data is adequate for most advisory work. Quarterly or more frequent updates matter for fast-moving industries or clients under active examination. Ask vendors for their update schedule and the lag between data collection and publication.
4. API and data-extract options
If your firm uses a BI tool or FP&A platform, you need benchmark data that can flow into it. Confirm whether the vendor offers a structured API, flat-file exports, or only PDF reports. PDF-only delivery limits how you can use the data downstream.
5. Integration with client accounting systems
For advisory workflows, the ability to import a client’s chart of accounts and map it to benchmark categories saves significant time. Ask vendors to demonstrate this during a proof-of-concept.
6. Security and compliance
Financial data for client engagements carries confidentiality obligations. Confirm SOC 2 compliance, data encryption standards, and user-access controls before sharing any client data with a vendor platform.
7. Scalability and user roles
A solo practitioner and a 50-person advisory firm have different needs. Confirm whether the pricing model scales by user, by report volume, or by data access tier, and whether the platform supports role-based access for staff and partners.
Vendor demo tasks to request:
- Import a sample chart of accounts and map it to benchmark categories.
- Generate a client benchmarking report for a specific NAICS code and revenue band.
- Show the audit trail or documentation for how the peer group was constructed.
- Export the report to PDF and Excel.
- Pull a sample API response for a single industry benchmark.
Questions to surface pricing traps:
- Are there per-report fees on top of the subscription?
- What does custom benchmark construction cost?
- How many onboarding or consulting hours are included?
- What happens to your data if you cancel?
Pro Tip: Before finalizing any shortlist, request a sample benchmark report for an industry you know well and check whether the peer group makes sense. A benchmark built from 12 companies in a national dataset is not comparable to one built from 300 companies filtered by revenue band and geography. The peer group construction method is the single most important quality signal, and most vendors bury it.
Why Bizminer stands out for accountants and advisory firms
Bizminer highlights several key strengths:
- 9,000+ industry markets covered, segmented by NAICS code, company size, and geography.
- U.S. Tax Court acceptance: Bizminer data has been used in tax-court proceedings, which sets a higher evidentiary bar than most benchmarking tools meet.
- Government usage: federal and state agencies use Bizminer data, providing an independent validation of data quality.
- Flexible delivery: subscription licenses for high-volume users, one-off report purchases for occasional engagements, and API access for firms integrating benchmark data into their own platforms.
- Customizable reports: firms can tailor benchmark construction by industry, geography, and size band rather than accepting a fixed peer group.
Bizminer’s acceptance in U.S. Tax Court and use by government agencies means the data meets an evidentiary standard most benchmarking tools never face. For advisory firms that need to defend a client’s financial position, that provenance is not a marketing claim — it is a practical requirement.
Use case 1: CPA firm client advisory. A mid-size CPA firm uses Bizminer to produce quarterly benchmarking reports for 40 small business clients. The firm pulls industry financial profiles by NAICS code and revenue band, maps client financials against the benchmark, and delivers a one-page variance summary showing where each client outperforms or lags peers. The report takes under an hour to produce per client and gives the firm a concrete advisory deliverable beyond tax preparation. Platforms like iLumen show how CPA firms use consolidated datasets for similar peer-group reporting, but Bizminer’s NAICS granularity and Tax Court provenance give it an edge for firms that need defensible outputs.
Use case 2: Valuation support. A business valuation team uses Bizminer’s industry financial profiles as a primary data source for income-approach and market-approach valuations. The team supplements with automated valuation benchmarks for WACC and multiples, but Bizminer provides the industry financial ratio baseline that anchors the analysis. Because the data source is documented and accepted in legal proceedings, the valuation report withstands scrutiny in M&A due diligence and estate planning contexts.
Trust signals to request during vendor evaluation:
- Third-party citations or case studies showing the data used in formal proceedings.
- Audit trail documentation for peer group selection methodology.
- Sample reports with visible data sourcing notes.
- Demo access with real industry data, not synthetic samples.
For business advisors who monetize benchmarking as a service line, the benefits of financial benchmarking software extend beyond client reports to prospect development and risk identification.
When to recommend Bizminer versus a planning or BI tool
The recommendation decision comes down to what the firm is actually trying to produce.
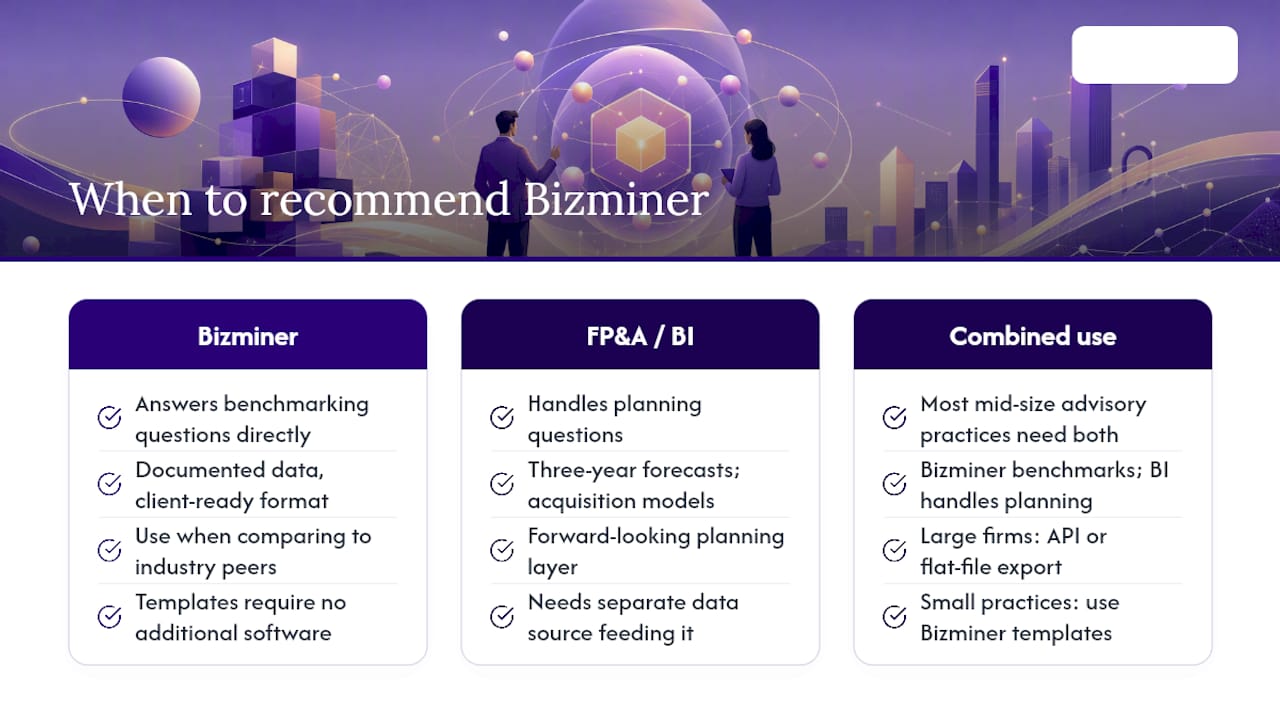
When a client asks “how does my business compare to peers in my industry?”, that is a benchmarking question. Bizminer answers it directly, with documented data, in a format you can hand to the client. No FP&A platform or BI tool does that without a separate data source feeding it.
When a firm needs to build a three-year rolling forecast, model acquisition scenarios, or consolidate financials across multiple entities for board reporting, that is a planning question. Planful, Workday Adaptive Planning, or Jedox are the right tools. Bizminer is not a planning engine.
The practical reality for most mid-size advisory practices: they need both. Bizminer handles the benchmarking and industry data layer. A lightweight BI tool or FP&A platform handles the forward-looking planning layer. The two do not compete; they complement each other.
For larger firms already running SAP Analytics Cloud or a similar ERP-adjacent platform, the integration path is an API or flat-file export from Bizminer into the existing BI environment. The 4 ways accountants use financial benchmarking to drive revenue include exactly this kind of data-layer pairing, where Bizminer supplies the peer data and the firm’s existing tools handle presentation and planning.
For smaller practices, the simpler path is Bizminer’s own report templates, which require no additional software and deliver client-ready outputs directly.
Bizminer is the direct replacement for ProfitCents benchmarking
Most ProfitCents alternatives solve a different problem. Enterprise FP&A platforms plan forward. BI tools visualize what you already have. Statistical suites model quantitative relationships. None of them ship industry peer benchmarks you can hand to a client or use in a tax proceeding.

Bizminer’s industry financial benchmarks cover the same core use cases ProfitCents users depend on: ratio analysis, peer comparisons, industry trend data, and client-ready reports, across 9,000+ markets with documented data provenance. Subscriptions scale from individual practitioners to enterprise teams, one-off reports let you test the data before committing, and API access integrates Bizminer data into your existing BI or FP&A stack.
Request a demo or order a custom benchmarking report to see how Bizminer’s data holds up against your current workflow before making a final decision.
Where to learn more
Verified sources and next-step links for your evaluation:
- Top 10 ProfitCents Alternatives & Competitors in 2026 — G2: Curated list of alternatives mapped to the same financial analysis and benchmarking use cases. Useful for initial market mapping and verified user reviews.
- ProfitCents Software Pricing, Alternatives & More 2026 — Capterra: Compact feature and pricing summary for ProfitCents plus a list of common alternatives. Good starting point for understanding what you are replacing.
- Top 20 ProfitCents Alternatives — GetApp: Expanded alternatives list illustrating the full category breadth buyers consider. Useful for confirming you have not missed a relevant category.
- Bizminer Sample Products: Download sample reports before purchasing to verify data depth, format, and ratio coverage against your current workflow.
- What is Financial Benchmarking Software?: Foundational explanation of benchmarking software use cases, useful for framing vendor conversations and internal stakeholder discussions.
Sources
- Top 10 ProfitCents Alternatives & Competitors in 2026
- ProfitCents Software Pricing, Alternatives & More 2026
- Top 20 ProfitCents Alternatives
- Visual Financial Analysis for Advisors & Companies | Finoview