
A market data API, in the sense that matters to accountants, lenders, and business advisers, delivers standardized, NAICS-aligned industry benchmarks and normalized company financials — income statement, balance sheet, cash flow, and calculated ratios — so teams can automate benchmarking, credit scoring, and client reporting without rebuilding the same spreadsheet every quarter.
Three things to know before you go further:
- Core capabilities: Normalized financial statements, NAICS-segmented industry medians and percentiles, company-level quantitative profiles, and calculated ratios (gross margin, operating margin, current ratio, debt-to-assets) — all returned in machine-ready schemas.
- Trust signal: Bizminer’s data is accepted in U.S. Tax Court and used by government agencies, which sets a provenance bar most providers cannot match.
- Recommended next step: Request a sample NAICS report or a 30-day pilot through Bizminer’s market and industry research page before committing to a license.
Table of Contents
- What does a market data API actually deliver?
- Why lenders and advisers depend on continuous financial data feeds
- What features should you require in a market data API?
- Technical integration checklist: from POC to production
- Security, licensing, and compliance for financial data APIs
- How are market data APIs typically priced?
- What does a realistic integration timeline look like?
- What questions should you ask vendors before signing?
- Why Bizminer fits the needs of accountants, advisers, and government analysts
- Key Takeaways
- The part most procurement guides skip
- Bizminer gives you the benchmarks that hold up under scrutiny
- Useful sources and further reading
What does a market data API actually deliver?
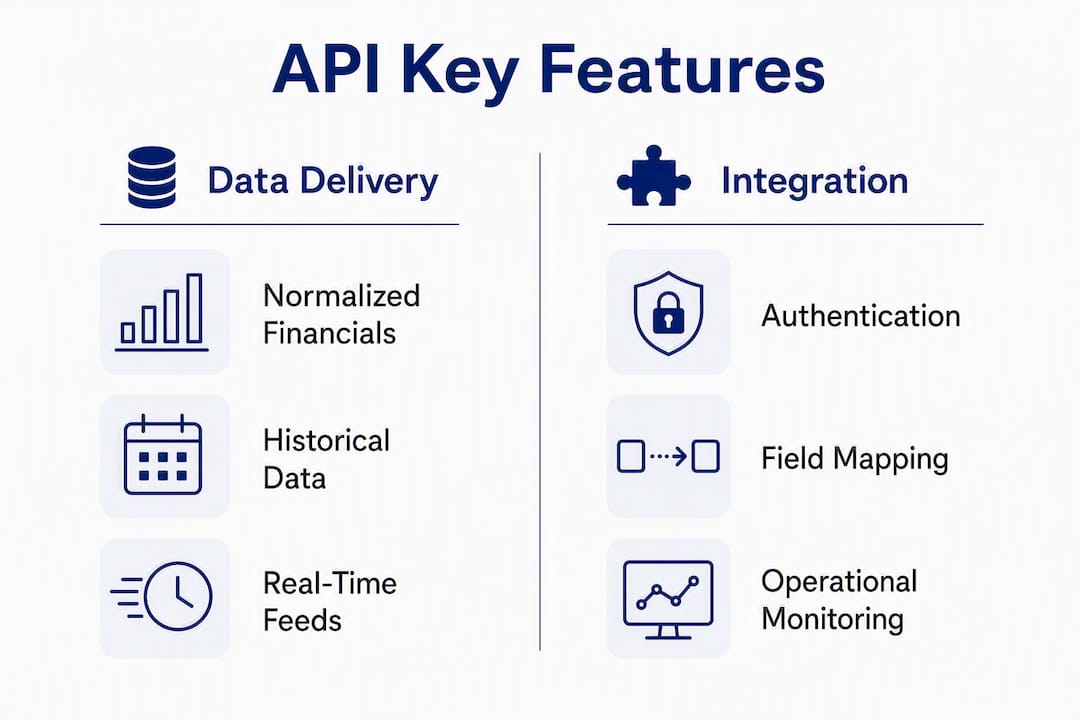
Normalized financial data is the core output. A well-built API returns five primary data categories in a single response package:
| Data Category | Typical Fields Returned | Metadata Included |
|---|---|---|
| Income Statement | Revenue, COGS, gross profit, operating expenses, EBITDA, net income | Period, unit, NAICS code, coverage dates |
| Balance Sheet | Current assets, total assets, current liabilities, long-term debt, equity | Point-in-time flag, source accession |
| Cash Flow | Operating, investing, financing cash flows | Period, filing date |
| Calculated Ratios | Gross margin, operating margin, current ratio, debt/asset | Methodology reference |
| Industry Benchmarks | Median by NAICS segment | Sample size, geography, period |
Historical depth matters here. Quality providers offer 20+ years of statement-level history, which is what you need for trend analysis and valuation work. Update cadence varies by data type: company-level fundamentals typically refresh quarterly, while industry aggregates may update monthly or annually depending on the underlying source.
One practical illustration: an API response for a restaurant client might flag that the client’s gross margin sits notably below the NAICS-specific industry median, and return that variance as a structured field your reporting tool can consume directly.
Why lenders and advisers depend on continuous financial data feeds
The shift from periodic snapshots to continuous API-integrated data is the single biggest operational change in credit and advisory work over the past several years. Static documents answer historical questions. Live feeds let you operationalize monitoring and dynamic credit decisions.
For credit underwriting, combining P&L and balance-sheet data via API is essential because each statement answers a different question: the income statement shows cash generation capacity, the balance sheet shows solvency. Lenders who integrate both get a more complete picture of repayment risk than those relying on either alone. Advisers using continuous feeds report more responsive risk models and lower default rates compared to quarterly-review workflows.
For advisory work, the payoff is repeatability. Instead of manually pulling industry benchmarks each engagement, an adviser’s platform calls the API, compares the client’s ratios against NAICS peers, and surfaces variances automatically. That frees the adviser to focus on the interpretation, not the data assembly.
Academic researchers and government analysts benefit from the same logic: a documented, reproducible data pull beats a one-off export every time an analysis needs to be updated or audited.
What features should you require in a market data API?
Standardized schemas and documented normalization are the single biggest friction reducers for analytics teams. Without them, every new provider means a new mapping pipeline. Here is the non-negotiable checklist:
- OpenAPI/schema discovery endpoints —
/api/schema,/api/fields,/api/datasetsso your engineering team can automate ingestion without reading PDFs. - Field dictionary with period and unit metadata — every field labeled as a flow (period total) or stock (point-in-time) to prevent ratio calculation errors.
- XBRL tags or source accession numbers — traceable provenance on each observation so analysts can cite the underlying filing.
- NAICS alignment — granular segmentation by industry code, geography, and company size band.
- Ratio methodology documentation — published definitions for every calculated metric, including the denominator convention used.
- Coverage and freshness metrics — stated sample size per NAICS segment and a published update cadence.
- SLAs and uptime commitments — written guarantees, not verbal assurances.
- Bulk export and webhook/event support — for portfolio monitoring and batch processing workflows.
- Changelog — a versioned record of schema changes so your pipelines don’t break silently.
Pro Tip: Before purchasing, request a sample dataset for one NAICS code you know well, then manually verify two or three ratio calculations against the underlying statement fields. If the numbers don’t reconcile, the normalization logic has a problem you’ll spend weeks untangling post-integration.
Technical integration checklist: from POC to production
Plan for authentication, field mapping, normalization validation, cadence handling, and operational monitoring before you write a single line of production code.

Authentication. Most providers support API key authentication for single-tenant use and OAuth 2.0 for multi-tenant platforms where you’re pulling data on behalf of multiple clients. Confirm which flows are supported before signing a contract.
Mapping and reconciliation. Map provider field names to your internal GL or data model during the discovery sprint, not after. Run acceptance tests that check: field-level parity (does “revenue” mean net or gross?), period alignment (fiscal vs. calendar year), null handling (missing quarters vs. zero values), and point-in-time treatment for balance-sheet items. A common integration error is averaging point-in-time balance-sheet figures across periods — always verify whether a field is a flow or a stock before calculating ratios.
Operational items. Subscribe to webhooks for data-refresh events rather than polling. Implement paging for bulk endpoints, exponential backoff for rate-limit errors, and scheduled schema-change tests that run before each deployment. For underwriting workflows, also consider whether you need complementary commerce or payment data alongside industry benchmarks.
Security, licensing, and compliance for financial data APIs
Verify data provenance, licensing scope, anonymization policies, and security controls before any client financials touch a third-party endpoint.
- PII and anonymization: — Strip any personally identifiable information — SSNs, EINs, client names — before transmitting data to a vendor API. For accounting professionals, this intersects with Section 7216 of the Internal Revenue Code, which governs disclosure of tax return information. Consult your compliance counsel on the specific scope.
This article is general information, not legal or compliance advice. Confirm current obligations with a qualified professional and the relevant primary sources.
How are market data APIs typically priced?
Pricing follows three main structures, each with different tradeoffs for scale and budget predictability.
| Model | Best For | Watch Out For |
|---|---|---|
| Subscription tier | Teams with predictable, recurring data needs | Feature gating — key endpoints may sit in higher tiers |
| Per-request / per-row | Low-volume or exploratory use | Costs scale fast with portfolio monitoring or bulk pulls |
| Enterprise flat-fee | High-volume production integrations | Minimum commitments; negotiate overage caps |
| Per-report / one-off | Occasional benchmarking or pilot validation | Expensive at scale; no API access |
Hidden costs consistently catch teams off guard: professional services for field mapping, engineering hours for reconciliation, data storage for historical pulls, and overage charges when monitoring workflows spike call volume. Build a TCO estimate that includes onboarding engineering days, ongoing storage, and a 20% buffer for overages before presenting a budget to finance.
What does a realistic integration timeline look like?
A pragmatic pilot runs 4–8 weeks; production integration typically takes 8–16 weeks depending on scope, SLA requirements, and the complexity of your existing data model.
| Phase | Duration | Key Deliverables |
|---|---|---|
| Discovery & sample data | 1–2 weeks | NAICS coverage confirmed, sample dataset reviewed |
| Mapping & validation sprint | 2–3 weeks | Field dictionary mapped, acceptance tests passing |
| Pilot reporting & acceptance | 1–2 weeks | Benchmark reports generated, variances reviewed |
| Production cutover & monitoring | 2–4 weeks | Webhooks live, alerting configured, SLA baseline set |
Resource commitment varies by organization size, but expect product, engineering, and analytics each to contribute meaningfully in the mapping and validation sprint. Vendor professional services can compress the mapping phase if your internal team is stretched.
Pro Tip: Run parallel reconciliation during the pilot: pull the same period’s data from your existing source and the new API simultaneously, then diff the outputs. Normalization gaps surface immediately rather than after you’ve decommissioned the old workflow.
What questions should you ask vendors before signing?
Prioritize provenance, schema documentation, NAICS coverage depth, SLAs, and references from government or tax-court use as your primary trust signals.
- Which NAICS codes do you cover, and what is the sample size per segment?
- Can you provide a sample dataset and schema documentation before purchase?
- Where does your data originate, and can you provide source accession numbers?
- What is your published uptime SLA and historical availability?
- How frequently is data updated, and what is the latency from source to API?
- Do you support bulk export and webhook notifications?
- Is professional services support available for integration?
- Where can I find your methodology page, changelog, and field dictionary?
Published methodology pages, changelogs, and field dictionaries are strong governance signals — they indicate a provider that supports auditability, not just data delivery. A vendor who can’t point you to /methodology and /changelog endpoints is a governance risk.
Pilot scope template: Define objectives (which NAICS codes, which ratio calculations), acceptance tests (field parity, period alignment, ratio reconciliation), duration (30 days minimum), and required deliverables (sample benchmark report, schema documentation, SLA draft).
Why Bizminer fits the needs of accountants, advisers, and government analysts
Bizminer is a production-ready option for this audience because of its NAICS coverage across many markets, documented normalization methodology, and existing acceptance in U.S. Tax Court and by government agencies — a provenance bar that directly addresses the compliance and auditability requirements covered throughout this guide.
Bizminer’s financial data is accepted in U.S. Tax Court and used by government agencies, with documented normalization methodology and coverage across 9,000+ NAICS-segmented markets — making it one of the few providers that can satisfy both analytical and legal evidentiary standards.
Key capabilities for this audience:
- NAICS depth: Industry profiles segmented by industry, geography, and company size across many markets.
- Flexible delivery: — API feeds, bulk exports, and custom reports for different workflow needs.
- Advisory-ready outputs: Business advisers can embed benchmark comparisons directly in client reports.
Verify Bizminer’s data provenance and trust signals on the using our data page, and review sample products before committing to a pilot.
Key Takeaways
A market data API built for financial benchmarking must deliver normalized financials, NAICS-segmented benchmarks, and documented provenance — and Bizminer meets all three criteria with government and tax-court acceptance as additional validation.
| Point | Details |
|---|---|
| Require normalized schemas | Insist on field dictionaries, period metadata, and NAICS alignment to eliminate per-provider mapping work. |
| Test before you buy | Run a 30-day pilot with acceptance tests covering field parity, period alignment, and ratio reconciliation. |
| Budget for full TCO | Include engineering hours, data storage, and overage exposure — not just the subscription fee. |
| Anonymize before transmitting | Strip PII from any client data before it reaches a vendor API; Section 7216 applies to tax return information. |
| Bizminer as a production option | Covers 9,000+ NAICS markets with documented methodology, accepted in U.S. Tax Court and by government agencies. |
The part most procurement guides skip
The vendor evaluation checklists in this space tend to focus on features and pricing. What they underweight is the evidentiary standard question: can you defend this data in a regulatory submission, a tax court proceeding, or a lender audit?
Most financial data providers are built for internal analytics. That’s fine for dashboards. It’s a problem when a client’s valuation gets challenged, or when a government agency asks where your industry benchmark came from. The difference between a provider with documented methodology and source accession numbers and one without isn’t a nice-to-have — it’s the difference between data you can stand behind and data you have to caveat.
The other thing practitioners underestimate is the normalization gap. Raw filings are not comparable across companies or industries without significant cleanup. A provider that publishes its normalization methodology isn’t just being transparent — it’s telling you that the numbers you’re comparing are actually comparable. That’s the whole point of benchmarking.
Bizminer gives you the benchmarks that hold up under scrutiny
Accountants and lenders who need NAICS-segmented benchmarks with documented methodology and production API access have a short list of providers that can satisfy both analytical and evidentiary requirements. Bizminer sits at the top of that list: 9,000+ markets, normalized financials, calculated ratios, and data accepted in U.S. Tax Court and by government agencies.

Licensing options include individual subscriptions, enterprise agreements, and custom API feeds. The fastest way to validate fit is a sample report request or a structured pilot. Browse industry profiles by NAICS code or request a custom report or API feed to start the conversation.
Useful sources and further reading
The sources below support the integration, governance, and methodology topics covered in this guide. Use them as reference material for procurement questions, schema mapping, and acceptance test design.
- Bizminer Market & Industry Research — NAICS coverage, sample reports, and API feed options; start here for pilot scoping.
- Bizminer Financial Ratios Glossary — ratio definitions and methodology; use during acceptance test design to verify calculation logic.
- Financial Data API Guide — Wisesheets Blog — normalization concepts, historical depth expectations, and TCO considerations.
- Benchmarking Client Financials — MeetElevate — automated commentary workflows and PII anonymization best practices for advisory use cases.