Pull your NAICS code and revenue band, then pull 12 months of your own core ratios: gross margin, current ratio, days sales outstanding, debt to equity. Compare those numbers against the 25th, 50th, and 75th percentiles from a public source like the U.S. Census Bureau Quarterly Financial Report, an RMA-style trade study, or a paid provider like Bizminer. That comparison, done once a year at minimum, is what “benchmarking” actually means.
A quick gut check is free. You can find a rough median for your sector in an afternoon through government data or a library database. But if you need a tight peer group filtered by NAICS depth, revenue band, and business model, that level of precision usually means paying for a report or hiring an advisor who has access to one.
- Government data: Free, broad, updated quarterly.
- Trade associations / RMA: Lender-trusted, moderate granularity.
- Library databases: Free with access, good starting point.
- Paid vendors (Bizminer): Granular, customizable, built for decisions with money on the line.
Key Takeaways
Industry financial benchmarks only produce useful decisions when you compare your numbers to a properly matched peer group and translate percentiles into a 12-month target ladder.
| Point | Details |
|---|---|
| Start with NAICS and revenue band | Match peers on industry code, revenue range, and business model before comparing any ratio. |
| Track 5 to 10 core KPIs | Focus on profitability, liquidity, efficiency, and leverage ratios; keep the rest as diagnostic backup. |
| Use the percentile ladder | Set a floor at the 25th percentile, a target at the median, and a stretch goal near the 75th. |
| Run the cycle in three months | Gather baseline data, build peer group, then set targets and assign owners by month three. |
| Pay for precision when it counts | Bizminer’s NAICS-level, revenue-banded reports fit loan prep, valuations, and client advising better than free averages. |
Table of Contents
- Which Financial Ratios Should You Benchmark First?
- Where Can You Find Reliable Benchmark Data?
- How Do You Build a Peer Group That Actually Compares?
- What Do the 25th, 50th, and 75th Percentiles Actually Mean?
- What Does a Full Benchmarking Cycle Look Like?
- How Bizminer Supports Deeper Benchmarking Work
- The Playbook Most Businesses Skip
- Sources
Which Financial Ratios Should You Benchmark First?
Not every ratio deserves your attention every quarter. Pick the ones that actually diagnose a problem, not just describe your business.
Start with profitability: gross margin, net margin, and EBITDA margin tell you whether pricing and cost control are working. Liquidity ratios, the current ratio and quick ratio, tell you whether you can cover short-term obligations without a fire sale. Efficiency metrics like days sales outstanding (DSO) and inventory turns show how well you convert activity into cash. Leverage ratios, mainly debt to equity, show how much risk you’re carrying relative to your equity cushion. Round it out with cash-flow metrics, since a profitable company can still run out of cash.
Sector context changes what “good” looks like. A SaaS company tracks annual recurring revenue (ARR), net revenue retention (NRR), and the Rule of 40 (growth rate plus profit margin should clear 40%). A retailer watches inventory turns and same-store sales. A manufacturer leans on overall equipment effectiveness (OEE) alongside inventory turns.
Pro Tip: Track 5 to 10 core KPIs for your monthly dashboard, and reserve the rest as diagnostic metrics you pull only when a number looks off.
- Profitability: gross margin, net margin, EBITDA margin
- Liquidity: current ratio, quick ratio
- Efficiency: DSO, inventory turns
- Leverage: debt to equity
- Cash flow: operating cash flow margin, free cash flow
Where Can You Find Reliable Benchmark Data?
Credible benchmark data comes from four kinds of sources, and each trades off coverage, granularity, and cost differently.
- Government sources. The U.S. Census Bureau publishes quarterly industry financial data and composite ratios at no cost. It’s broad and reliable, though not always granular enough for a niche NAICS code or a specific revenue tier.
- Library guides. Academic resources like Cornell’s library FAQ and Berkeley’s industry information guide point researchers toward the databases worth checking, including Bizminer and RMA, and are especially useful if you have access through a university or public library.
- Trade associations and RMA. RMA’s Annual Statement Studies are widely used by commercial lenders, which makes them a smart choice if you’re benchmarking to prep for a loan conversation.
How Do You Build a Peer Group That Actually Compares?
A benchmark is only as good as the peer group behind it. Compare your bakery to national restaurant averages and you’ll draw the wrong conclusions every time.

A subscription software company at $2 million in ARR has almost nothing in common financially with a services firm at $2 million in revenue, even if both technically sit in “professional services.” Add geography only when local cost structures genuinely move the numbers, like labor-heavy industries in high-wage metro areas.
Start with a wider net of many candidates, then narrow to a core group that hold up under scrutiny. Refresh that group annually, since a peer that grew or shrank dramatically can quietly skew your comparison.
Pro Tip: If you’re a $3 million private company, resist the urge to lean on public-company data just because it’s easier to find. Public filers carry different capital structures, reporting incentives, and scale economics that will distort your targets.
- Match on NAICS, revenue band, business model, and growth stage.
- Build a wide candidate pool, then narrow it.
- Refresh the peer group every year.
- Avoid mixing industries or leaning on public-company data for private SME comparisons.
What Do the 25th, 50th, and 75th Percentiles Actually Mean?
The percentile framework is the backbone of financial ratio analysis, and it’s simpler than it sounds once you strip out the jargon.
The 25th percentile is your floor, the level where a quarter of your peers perform worse. The 50th percentile is the competitive median, and it’s the number lenders and credit analysts tend to focus on, especially for liquidity ratios during a credit evaluation. The 75th percentile marks the top quartile, the performance tier that signals real operational strength.
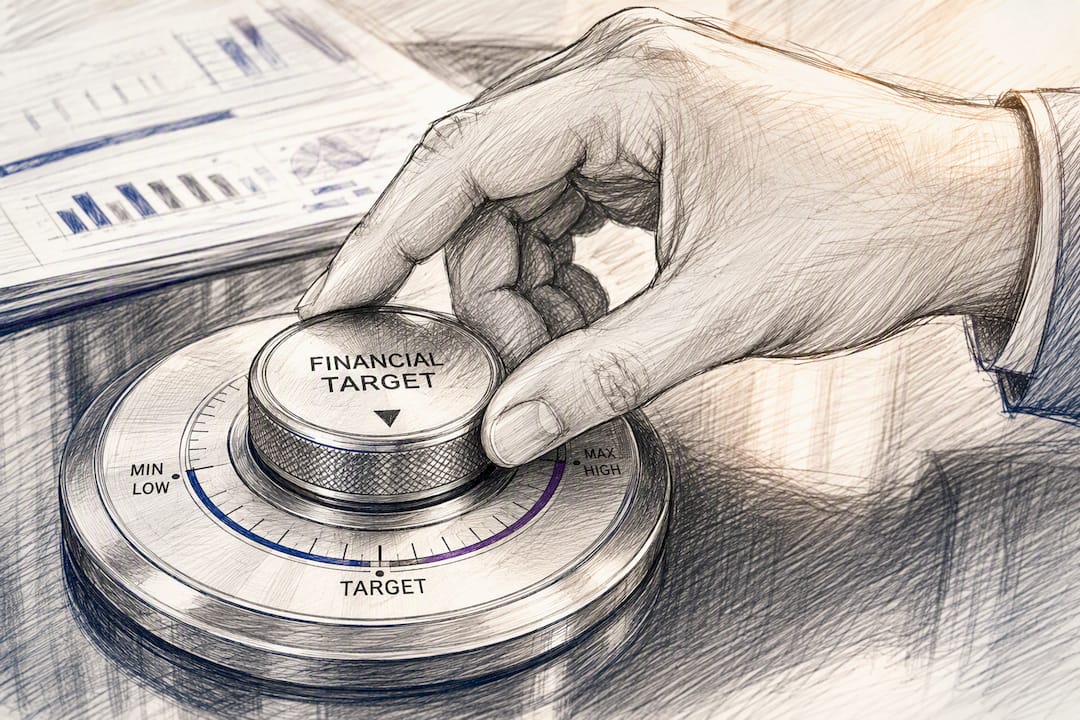
Turn those three numbers into a target ladder: set a floor (don’t fall below the 25th), a target (match or beat the median), and a stretch goal to reach partway toward the 75th percentile within 12 months. Adjust the ambition level based on your strategy. A company chasing growth might tolerate a lower margin ratio while pushing hard on revenue metrics; a company optimizing for a sale might do the opposite.
- Floor: 25th percentile, the line you don’t want to cross
- Target: 50th percentile, the competitive median
- Stretch: close 30 to 50% of the gap to the 75th percentile
Weight your KPIs to match what you’re actually trying to achieve, and report progress against each one monthly, not just at year-end.
What Does a Full Benchmarking Cycle Look Like?
A benchmarking cycle runs cleanly in about three months if you treat it as a project instead of an afterthought.
- Month 1: Confirm your NAICS code and revenue band, then pull 12 months of baseline KPIs straight from your accounting system.
- Month 2: Gather two or three benchmark reports from your chosen sources, build the peer group, and run a gap analysis against the 25th/50th/75th figures.
- Month 3: Set floor, target, and stretch numbers for each KPI, assign an owner to each one, and fold the results into your monthly management review.
Free sources cost time, not money, and a basic Census pull or library search can get you a rough median in a day or two. A paid report or an advisor engagement costs more upfront but buys speed and precision, which matters most before financing events, valuations, or major strategy pivots. Refresh the whole cycle annually, or sooner if your industry moves fast.
How Bizminer Supports Deeper Benchmarking Work
Free sources answer the question “am I roughly in line with my industry?” Bizminer answers the harder question: “how do I compare to the 10 companies that actually look like mine?”
Bizminer covers more than 9,000 distinct market segments, filtered by NAICS depth and revenue band, with customizable reports and API access for teams that need to pull data programmatically. That level of detail matters most when the stakes are concrete: preparing a loan application, advising a client on pricing, or building a valuation report that needs to hold up under scrutiny.
Bizminer’s data is accepted in U.S. Tax Court and used by government agencies, accountants, and business advisors who need numbers that survive a second look. You can see what the output actually looks like on the Bizminer sample products page before committing to a report.
- 9,000+ market segments with NAICS-based filtering
- Revenue-band and business-model matching for tighter peer groups
- Customizable reports and API access for recurring analysis
- Data accepted in U.S. Tax Court and used across government and advisory work
| Use case | Why granular data helps |
|---|---|
| Loan preparation | Lenders compare your ratios to a peer group, not a national average. |
| Client advising | Advisors need defensible numbers, not rough estimates. |
| Valuation work | Court-accepted data holds up under scrutiny. |
The Playbook Most Businesses Skip
Most advice on industry financial ratios stops at “compare yourself to the industry average,” which is close to useless. An average blends fast-growing outliers with declining ones and tells you nothing about where you should actually aim. The percentile framework fixes that, but almost nobody explains how to turn a percentile into a number you can hand to a manager and say “hit this by December.”
The bigger gap is peer selection. Businesses grab whatever benchmark report is easiest to find and treat the numbers as gospel, without checking whether the peer group even resembles their operation. A 4-digit NAICS match matters more than people assume, and revenue band matters almost as much. Skip that step and you’re benchmarking against noise.
Free government and library sources are genuinely good enough for a first pass. Where I’d push back on the instinct to stay free forever: once real money is on the line, a loan package, a valuation, a strategic pivot, the cost of a paid report is small next to the cost of guessing wrong. That’s the actual decision point, not “free versus paid” in the abstract.
— Danny
Sources
Government data and library guides get you a rough median. Bizminer gets you a peer group that actually matches your NAICS code, revenue band, and business model, with the depth to back a loan application, a valuation, or a client recommendation.

Bizminer covers over 9,000 market segments with customizable reports built for accountants, advisors, and business owners who need numbers precise enough to survive scrutiny, including in U.S. Tax Court. If you’re an advisor building recurring client work, the accounting professionals page shows how firms use this data to justify recommendations. If you want to see the format first, browse the sample products before you commit.
Start by searching your NAICS industry to see what data is available for your exact market segment.
- Where can I find financial ratios for an industry?
- U.S. Census Bureau Quarterly Financial Report / Industry financial data
- Financial Metrics That Reveal Your Business’s True Health | CO- by US Chamber of Commerce
- Industry Information: Industry Financial Ratios