Start with public filings and one sector benchmark report, then pick a single KPI to test before you buy anything. Pull your organization’s own Form 990 data alongside a peer benchmark like the Virtuous Benchmark Report to see where you actually stand. From there, get a granular, NAICS-level benchmark from a provider like Bizminer if you need numbers precise enough for board decisions or funder conversations.
TL;DR:
- Benchmark your organization’s key KPIs, such as retention rate and donor lifetime value, against sector-specific, NAICS-level data for accurate comparisons.
- Focus on a small set of high-impact metrics like retention, LTV, and average gift size, and track only these to inform rapid decision-making and strategy adjustments.
- Use peer benchmarking with at least five-year revenue trend data to avoid misleading fluctuations caused by single-year anomalies.
- Conduct targeted message testing and segmentation before scaling fundraising campaigns to improve response rates and optimize ask strategies.
- Prioritize granular, region-specific benchmarks from tools like Bizminer and ensure donor privacy compliance when handling individual data.
Table of Contents
- Which Fundraising Metrics Matter Most for Benchmarking?
- How Do You Turn Nonprofit Data Into a Fundraising Strategy?
- How Long Does Nonprofit Market Research Take, and What Does It Cost?
- Why Granular Benchmarks Matter More Than General Averages
- What Are the Privacy Rules for Nonprofit Data?
- What Tools Help Nonprofits Manage and Analyze Data?
- What Mistakes Do Nonprofits Make When Reading Market Data?
- Start With the Decision, Not the Data
- How Bizminer Supports Your Nonprofit Benchmarking
- Sources
- FAQ
Which Fundraising Metrics Matter Most for Benchmarking?
Not every metric deserves equal attention, especially if your team is small. Rank these by what changes your fundraising decisions fastest, then track the top two or three consistently rather than chasing a dashboard full of numbers nobody reviews.
- Gross donor retention rate. Divide the number of donors who gave again this year by last year’s total donor count. A five-point drop year over year usually signals a stewardship problem worth investigating before you spend more on acquisition.
- Donor lifetime value (LTV). Multiply average gift by average donor lifespan (in years) and giving frequency. Rising LTV alongside flat acquisition often means your upgrade strategy is working.
- Average gift size. Track this by channel and by donor segment, not just as one blended number. A shift toward mid-level donors, as recent Virtuous benchmark data shows, changes how you should structure your ask ladder.
- New donor acquisition cost and rate. Compare cost per new donor against their projected LTV. If acquisition costs exceed first-year value, you’re funding growth you can’t sustain.
- Revenue portfolio balance. What share comes from individual gifts, grants, earned income, and major donors? Bridgespan’s research recommends viewing this mix over a five-year window, not a single snapshot. This helps catch structural shifts before they become emergencies.
- Recurring giving percentage. Organizations with a higher share of monthly donors tend to weather revenue dips better. If yours is under 10%, that’s usually the first lever worth pulling.
Newer organizations should start with acquisition rate and average gift. Established ones with steady donor files get more value from retention and LTV, since those numbers reveal problems acquisition spending can’t fix.
How Do You Turn Nonprofit Data Into a Fundraising Strategy?
Data sitting in a spreadsheet doesn’t raise a dollar. The value comes from three connected workflows: benchmarking against peers, testing your messaging before full deployment, and segmenting your donor file so the right people get the right ask.
Benchmarking starts with choosing three to five genuine peer organizations, similar in budget size, mission area, and geography. Bridgespan’s guidance on funding strategy benchmarking recommends pulling a five-year view of each peer’s revenue mix rather than comparing single years, since one-year snapshots hide capital campaigns, one-time grants, or COVID-era anomalies that distort the picture. Compare not just totals but ratios: earned income as a percent of budget, program expense ratio, fundraising efficiency.
Message testing should come before you commit budget to a full appeal. Test tone, imagery, and ask amount on a smaller segment first. Rutgers Business Review’s research on the “5 Ps of fundraising” found emotional appeals, pleasure, pride, pity, personal interest, and public recognition, are statistically significant predictors of giving behavior. That means an appeal’s emotional register often matters more than its production value. YouGov’s fundraising research recommends validating these choices with actual audience testing rather than internal guesswork, since staff preferences and donor preferences frequently diverge.
Segmentation means using what you already know, giving history, engagement level, demographic data, to tailor the ask rather than sending one appeal to everyone. A lapsed major donor and a new $25 monthly giver need entirely different messages.
- Test one variable at a time: ask amount OR imagery, not both, or you won’t know what moved the needle.
- A segment of a few hundred donors is usually enough to spot a meaningful response difference before a full mailing.
- Track response rate and average gift together. A higher response rate with a lower average gift can be a net loss.
Pro Tip: Run your ask-amount test on your smallest, lowest-risk segment first. If a $50 ask outperforms $35 there, you’ve de-risked the decision before it touches your biggest appeal of the year.
How Long Does Nonprofit Market Research Take, and What Does It Cost?
Match the scope of your research to the size of the decision. A board presentation next month needs a different approach than a three-year strategic plan.
- Define the decision first. Before pulling any data, write down the specific choice you’re trying to make: raise recurring gifts by 15%, decide whether to launch an earned-income program, justify a new major-gifts hire. Skipping this step is the single biggest cause of research projects that produce reports nobody uses.
- Gather secondary data. Pull your own historical numbers, then check Form 990 data for two or three peers and a relevant sector report. This step typically takes one to two weeks and costs little beyond staff time, since much of the highest-value research is desk research rather than expensive fieldwork.
- Run targeted primary research only if gaps remain. A short donor survey or a handful of focus interviews can close specific questions secondary data can’t answer, usually within two to four weeks.
- Scale up for larger decisions. A full benchmarking project with custom NAICS-level reports or API access runs one to three months for a medium-sized organization, and a multi-market or multi-year subscription arrangement can stretch longer depending on how many peer segments you need tracked.
Before trusting any number, confirm the filing date (a three-year-old Form 990 tells you little about current reality), reconcile how peers categorize revenue (one group’s “program income” is another’s “earned income”), and flag any figure pulled from a press release rather than an audited statement.
Why Granular Benchmarks Matter More Than General Averages
A national average donor retention rate tells you almost nothing about whether your food bank in a mid-size metro area is underperforming. Broad category averages flatten out real differences in geography, budget size, and mission type, which is exactly where a general benchmark stops being useful and a granular one starts.
Some providers build custom financial data profiles across many distinct markets, segmented by industry, geography, and organization size, drawing on both public and private datasets. That level of detail matters for nonprofits specifically because Bizminer’s benchmarking data has been accepted in U.S. Tax Court and used by government agencies, which means the underlying methodology holds up under scrutiny, not just in an internal memo.
A funding hypothesis built on a peer group of one, or on a national average that includes organizations five times your size, is a hypothesis built on the wrong evidence. Board members and funders notice the difference between a defensible ratio and a rounded-off guess.
Practitioners use these NAICS-level ratios for board reporting, for stress-testing a new earned-income line against similar organizations, and for putting a real number on what a comparable peer’s overhead ratio looks like before making the case for a budget change.
What Are the Privacy Rules for Nonprofit Data?
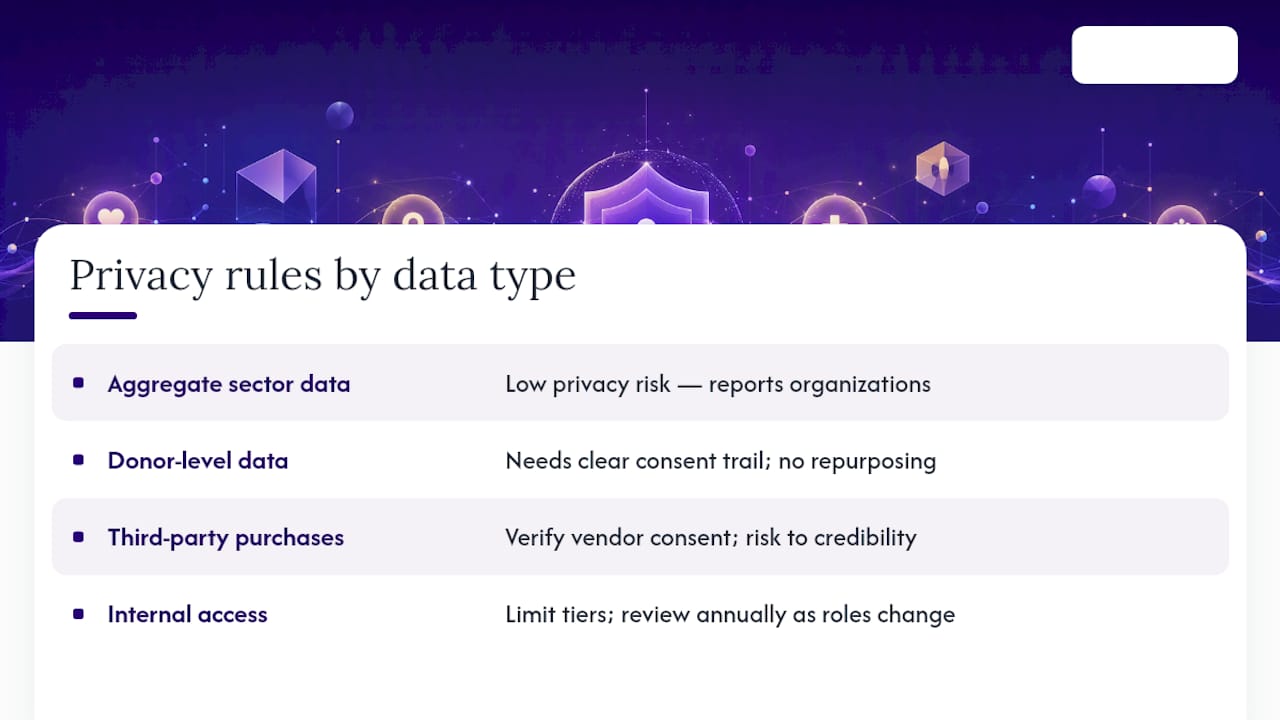
Aggregate sector data (Form 990 summaries, benchmark reports, sector surveys) carries little privacy risk since it reports on organizations, not individuals. Donor-level data is a different matter entirely, and it’s where most nonprofits run into trouble.
Any survey, message test, or segmentation project that touches individual donor records needs a clear consent trail. If you’re surveying donors about giving preferences, tell them what the data will be used for and don’t repurpose it for something else without asking again. State privacy laws increasingly apply to nonprofits the same way they apply to for-profit companies, so a donor database that includes California residents, for example, may fall under state privacy statutes even though the organization itself is tax-exempt.
Third-party data purchases carry their own risk. If you buy a prospect list or append demographic data to your donor file, verify the vendor’s data was collected with appropriate consent. A benchmark built on scraped or improperly sourced donor data isn’t just an ethical problem. It can undermine the credibility of the entire analysis if a funder or auditor asks where the numbers came from.
Internally, segment access matters too. Not every staff member needs to see individual major-donor giving history to do their job, and limiting that access reduces both privacy risk and the chance of an awkward conversation with a donor who finds out more people knew their giving details than they expected. Build access tiers into whatever CRM or data platform you use, and revisit them annually as staff roles change.
What Tools Help Nonprofits Manage and Analyze Data?
Most nonprofits already own more data infrastructure than they use. The CRM (constituent relationship management platform) is the backbone: Salesforce Nonprofit Cloud, Bloomerang, and Neon CRM all handle donor history, segmentation, and basic reporting, and picking one that your team will actually update consistently matters more than picking the one with the most features.
For benchmarking specifically, spreadsheets remain the practical default for small organizations, one tab per peer, standardized line items pulled from Form 990s or audited financials. It’s unglamorous but transparent, and anyone on the board can follow the math. Larger organizations or those running frequent peer comparisons benefit from a market data API that pulls updated industry ratios directly into an internal dashboard, cutting out the manual re-download cycle every time a report needs refreshing.
For message testing, most email platforms (Mailchimp, Constant Contact, or whatever your organization already uses) support basic A/B split testing without any additional purchase. Survey tools like SurveyMonkey or Google Forms cover donor feedback and preference testing at minimal cost.
The mistake to avoid is buying a sophisticated analytics platform before your data hygiene is solid. A $10,000 dashboard built on inconsistent donor records or unreconciled revenue categories just produces confident-looking wrong answers faster.
What Mistakes Do Nonprofits Make When Reading Market Data?
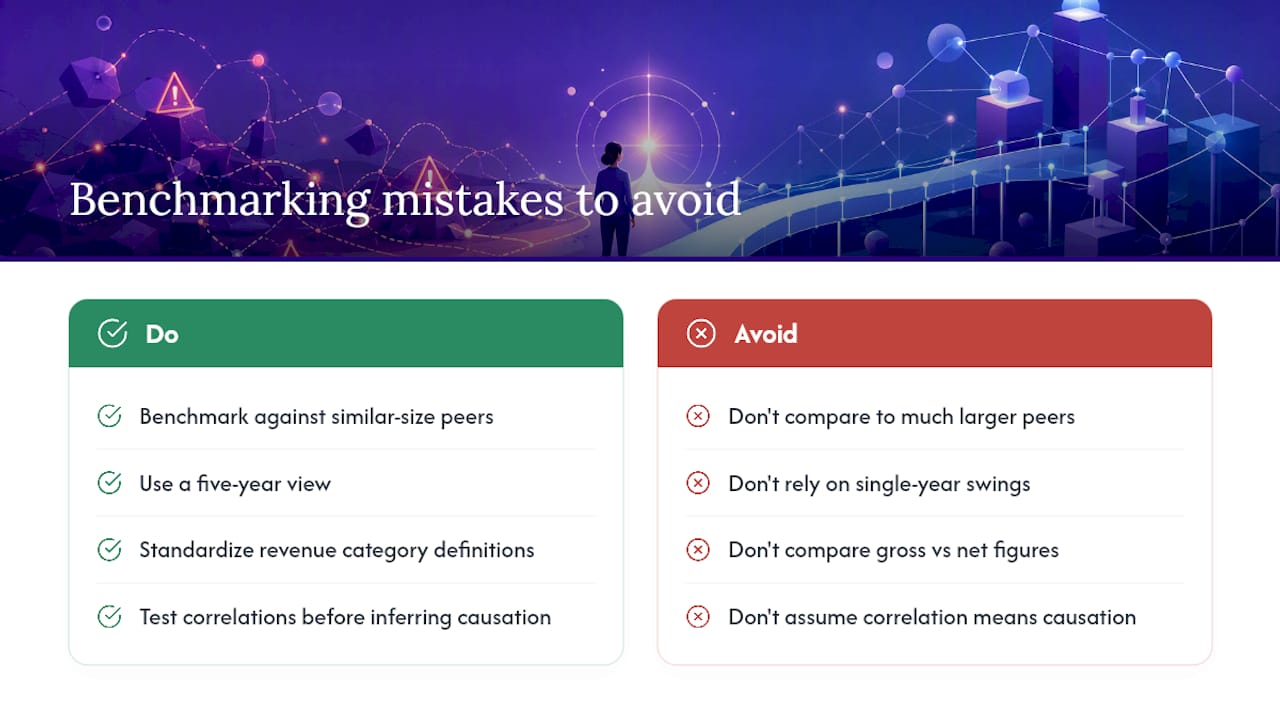
The most common error is comparing against the wrong peer group. An organization with a $2 million budget benchmarking itself against national averages that include organizations ten times its size will always look like it’s underperforming, when it’s actually comparing apples to a fruit basket.
Single-year comparisons cause the second-biggest problem. A peer’s revenue jumped 40% one year because of a single capital campaign gift, not because their annual fundraising program suddenly got dramatically better. Bridgespan’s guidance on benchmarking specifically recommends a five-year view to smooth out exactly this kind of noise.
Inconsistent revenue categorization trips up even experienced analysts. One organization’s “special events revenue” nets out event costs; another reports it gross. Compare the two without adjusting and you’ll draw a false conclusion about which one runs a more efficient gala.
Confusing correlation with a decision-ready insight is the subtler trap. A benchmark report showing that peer organizations with strong social media engagement also have higher retention doesn’t prove social media caused the retention. It might just mean well-resourced, well-managed organizations tend to do both things well.
Finally, treating every data point with equal confidence causes bad decisions. An audited financial statement, a Form 990 note, and a number from a press release don’t carry the same reliability, and a defensible funding hypothesis records which is which rather than presenting all three as equally solid.
Start With the Decision, Not the Data
The instinct to gather everything before deciding anything is the single biggest time sink I see in nonprofit research. Backward market research, starting with the exact decision you need to make and pulling only the data that answers it, beats building a comprehensive data warehouse nobody has time to interpret.
Pick one KPI. Get a baseline. Run a small test before committing a full budget to any strategy shift. The organizations that improve fastest aren’t the ones with the most data. They’re the ones that iterate on the smallest measurable piece first.
What KPI are you benchmarking right now? That’s usually the more useful question to answer before opening another spreadsheet.
— Danny
How Bizminer Supports Your Nonprofit Benchmarking
Bizminer gives nonprofit finance teams and their advisors something Form 990 aggregators and generic sector surveys can’t: financial ratios built for your exact subsector and region, not a flattened national average. That’s the practical difference when a board wants to know whether your overhead ratio genuinely lags peers or whether the “peers” being cited aren’t peers at all.

Custom reports, NAICS-level granularity, and API access mean you can pull a defensible benchmark for a specific decision, whether that’s justifying a new earned-income line, stress-testing a funding hypothesis before a board meeting, or supporting a valuation for a program you’re considering spinning off. If you already work with an accountant or advisor on annual filings, ask whether they can pull a custom market and industry research report scoped to your organization’s exact NAICS code and peer set. It’s a faster path to a number you can actually defend in front of a funder than another round of generic sector averages.
Sources
Free sources get you most of the way. IRS Form 990 filings, searchable through the IRS’s own database or aggregators like Candid, show revenue mix and program-versus-administrative splits for any registered nonprofit. They rarely show individual donor names, though, so treat them as institutional funder and revenue-mix research, not donor prospecting tools.
Sector reports fill in the trend picture Form 990s can’t. The Council of Nonprofits maintains state and national data on workforce, funding, and policy shifts, updated regularly enough to spot emerging patterns. Bridgespan’s research on funding strategy explains how to read those filings against peer organizations. The Virtuous Benchmark Report tracks fundraising-specific metrics like retention and average gift across thousands of organizations, and Rutgers Business Review has published peer-reviewed work on what actually drives donor psychology.
When free sources don’t have the granularity you need, paid data closes the gap:
- Market research for nonprofits and charities | YouGov
- The Virtuous Benchmark Report (summary) | Virtuous
- The 5‑Ps of Fundraising (Rutgers Business Review)
Pick the free layer first. Pay for precision only once you know exactly what decision the data needs to inform.
FAQ
Is there a database for nonprofit organizations?
Yes. The IRS maintains a searchable database of Form 990 filings, and aggregators like Candid compile that data alongside additional profile information for most registered nonprofits.
What is the 80/20 rule for nonprofits?
It generally refers to the idea that roughly 80% of donations come from about 20% of donors, a pattern that shows up often enough in fundraising data to justify prioritizing major and mid-level donor stewardship over broad, thin outreach.
What are the current trends in nonprofit fundraising?
Recent benchmark data points to modest growth in donor lifetime value and a shift toward mid-level donors, which means retention and donor upgrade strategies are becoming more central to fundraising plans than acquisition alone.
How granular can nonprofit financial benchmarks get?
Providers like Bizminer offer benchmarks segmented down to specific NAICS codes, geography, and organization size, which is far more precise than the broad “nonprofit sector” averages found in most free reports.