The most reliable industry ratio sources fall into four buckets: commercial benchmarking databases (subscription platforms), IRS-derived almanacs, academic data repositories, and vendor or association reports. Which one you need depends on a single question: how granular does your industry cut have to be, and can you verify how the numbers were built?
For client-facing work that needs a specific NAICS code and firm-size breakout, a granular subscription database wins. For long-run, tax-return-based benchmarking, an IRS/Almanac dataset is the better fit. For research that has to hold up to peer review, academic datasets carry more weight because their methodology is published and repeatable.
Look for these names when you evaluate any source:
- RMA Annual Statement Studies
- Dun & Bradstreet (D&B) industry data
- Compustat/WRDS (via CRSP, Compustat North America, and IBES)
- Damodaran/NYU sector ratio tables
- Almanac of Business and Industrial Financial Ratios
- Bizminer
Key Takeaways
Choosing the right industry ratio source depends on matching classification detail, sample transparency, and update frequency to the specific task at hand, whether that’s lending, valuation, or research.
| Point | Details |
|---|---|
| Match source to task | Use academic datasets for reproducible research, IRS/Almanac data for long-run benchmarking, and commercial platforms for client deliverables. |
| Check the classification system | Confirm NAICS, SIC, or GICS alignment before paying for any report or subscription. |
| Favor medians over means | Use percentile bands and standard deviation to avoid outlier-skewed averages. |
| Verify sample and vintage | Look for disclosed firm counts, private-versus-public composition, and a recent data update date. |
| Consider Bizminer for granular client work | Bizminer covers 9,000-plus markets with firm-size breakouts and export/API options, and its data has held up in U.S. Tax Court. |
Table of Contents
- Why Industry Ratio Sources Matter for Benchmarking
- How to Choose the Right Ratio Data Source
- Accessing These Sources and What They Cost
- Interpreting Ratios Without Getting Misled
- When Bizminer Is the Right Call
- Get Granular Industry Benchmarks Built for Client Work
- Where to Go Next for Industry Ratio Data
- Frequently Asked Questions
- Sources
Why Industry Ratio Sources Matter for Benchmarking
Industry ratios give you the context to judge whether a company’s liquidity, profitability, leverage, and efficiency numbers are actually good, or just average dressed up as good. A 12% net margin means nothing until you know the peer group runs at 4% or 20%.

Credit underwriters lean on these figures to size risk. Appraisers use them as a valuation cross-check. Operators use them to spot the line item quietly dragging performance down, long before it shows up in cash flow.
Pro Tip: Pull the median and percentile bands, not just the mean, whenever a sample includes a handful of outsized firms or a small sample size. A few large outliers can drag a mean industry benchmark far from what a typical business actually looks like.
How to Choose the Right Ratio Data Source
Pick a source based on three things, in order: how finely it slices the industry, whether it discloses its sample, and how often it refreshes. A dataset with a thin sample or a five-year-old vintage will mislead you faster than having no benchmark at all.
Run any candidate source through this checklist:
- Industry classification alignment (NAICS, SIC, or GICS, matched to your target)
- Disclosed firm count and sample composition
- Size buckets by asset value or revenue, not just an industry-wide blend
- Update frequency and data vintage
- Published methodology, not a black-box average
- Coverage of private firms if that’s your subject
- Export or API access for repeatable workflows
The trade-offs are real. Library access is free but often limits you to older archived editions. A paid subscription costs money but gets you current data and finer classification detail. Academic datasets reproduce well for published research; commercial platforms move faster for a lending decision due next week.
For a quick procurement request, copy this into a library-help ticket or a purchasing email:
- Confirm NAICS/SIC code coverage for [your target industry]
- Request sample size and firm-size breakouts
- Ask for the data vintage and next scheduled update
- Request a sample extract before purchase
Accessing These Sources and What They Cost
Most authoritative ratio sources sit behind a subscription, but library access and one-off report purchases cover a lot of ground for occasional users.
- Academic/library subscriptions. WRDS and Compustat access nearly always runs through a university library seat, not an individual purchase.
- Commercial subscriptions. D&B and similar platforms sell tiered enterprise licenses built for repeated professional use.
- Association reports. RMA Annual Statement Studies are purchasable as a standalone volume or through many academic and public library systems.
- IRS-derived products and almanacs. Often sold pay-per-report, with some editions available through library reference desks.
- Bizminer. Offers subscription tiers, one-off report purchases, and API access, with sample reports available before you commit.
Before you buy anything, ask about academic pricing and enterprise licensing; a per-download rate can beat a subscription if you only need one report a quarter. Confirm NAICS/SIC alignment using a dedicated industry search tool first. It’s the fastest way to avoid paying for data that doesn’t match your target industry code.
Interpreting Ratios Without Getting Misled
Before you trust any industry average, check five things: sample size, distribution shape, outlier handling, accounting policy differences, and how current the data actually is. Skip that check and you risk benchmarking a real company against a statistical mirage.
- Mean versus median versus percentile bands, since averages skew hard when a few large firms dominate a sample
- Sample composition, meaning private firms mixed with public ones, or vice versa
- Accounting-policy differences that distort comparability across firms
- Seasonal effects that skew ratios if the data snapshot lands mid-cycle
- Firm-size segmentation, since a $2 million company and a $200 million company in the same NAICS code rarely behave alike
- Data vintage, since a benchmark built on five-year-old filings may not reflect current conditions
Pro Tip: When quartiles or standard deviation are available, use them. A tight standard deviation around the median tells you the peer group behaves consistently; a wide spread tells you the “industry average” is barely meaningful.
Pro Tip: For private-company benchmarking specifically, favor sources that disclose how many private firms sit in the sample. A dataset that hides that number is asking you to trust a black box.
Reproducibility matters more than most people give it credit for. A source that publishes its methodology and date-stamps its releases lets you defend the number later, whether that’s to a client, a court, or a peer reviewer.
When Bizminer Is the Right Call
Bizminer earns a spot on your shortlist when you need highly granular, market-level benchmarks with firm-size breakouts and reporting you can customize for a client deliverable, not a generic industry-wide average.
The platform covers more than 9,000 unique markets, and its data has been accepted in U.S. Tax Court and used by government agencies, a level of scrutiny most commercial datasets never face. Granular export and API options mean the numbers can drop straight into a report template instead of getting retyped by hand.
Two scenarios where this shows up in practice:
- An accounting professional building a benchmarking exhibit needs size-bucketed ratios (say, firms under $1 million in revenue versus firms between $1 million and $10 million) rather than one blended industry figure.
- A lender running a stress test needs a historical ratio vintage to see how a sector’s leverage and liquidity actually moved through a prior downturn.
Access runs through subscription tiers, one-off report purchases, or API feeds, all covered on the business advisors page. Confirm your NAICS or SIC code first. A mismatch there undermines everything downstream.
A note on how I’d actually use these sources
For open research, I reach for Damodaran or Compustat/WRDS first, since the methodology is public and the numbers hold up under scrutiny. For client deliverables, a database like Bizminer wins on speed and granularity. For tax-history benchmarking, nothing beats the IRS-based almanacs. Speed trades against granularity; cost trades against reproducibility. There’s no universal winner, only the right tool for the task in front of you.
Get Granular Industry Benchmarks Built for Client Work
If you’ve been stitching together library archives and outdated PDFs to build a benchmarking exhibit, there’s a faster path. Bizminer gives you firm-size breakouts and NAICS-level granularity across thousands of markets in one customizable report, instead of forcing you to reconcile three different data vintages by hand.

That granularity is what shows up when the data gets used somewhere with real stakes. Bizminer’s benchmarks have been accepted in U.S. Tax Court and used in government agency work, which matters if you’re the one signing off on the numbers. Start with the market and industry research page to see coverage for your target NAICS code, or pull a sample report first to check the size buckets and vintage before you commit to a subscription or a custom API feed.
Where to Go Next for Industry Ratio Data
Start your research with these resources rather than a generic search, since each one points to a specific, verifiable dataset instead of a recycled blog list.
- MIT Library’s business and industry resource guide for a curated map of commercial databases by classification and coverage
- WRDS’s industry-level financial ratios page for academic access details and category breakdowns
- Damodaran’s sector working-capital data for free, citable academic tables
- University of Cincinnati’s industrial ratios guide for IRS-based almanac sourcing
- Bizminer’s NAICS industry search tool to confirm classification alignment before ordering a report
- Kontrol Media’s list of commercial due diligence agencies if you need a third-party firm for private-company diligence work
Frequently Asked Questions
What is the most authoritative source for U.S. industry ratios?
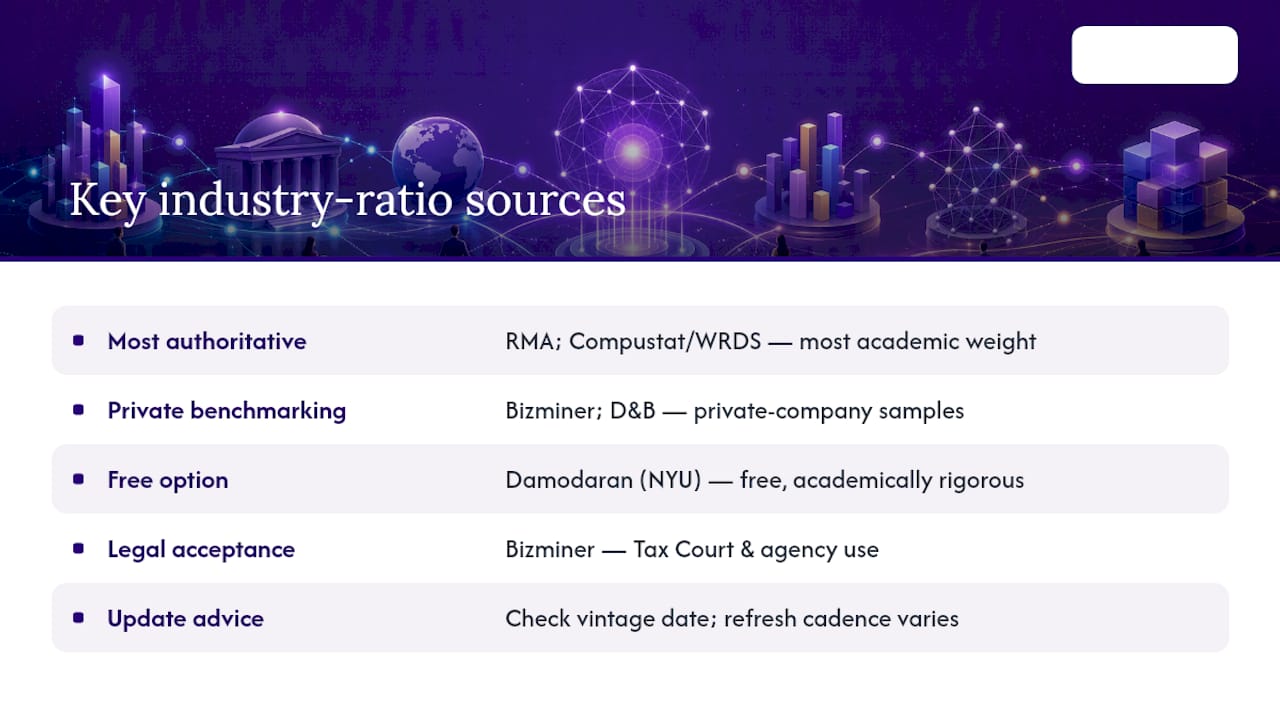
No single source wins across every use case. RMA Annual Statement Studies and Compustat/WRDS carry the most weight academically, while a platform like Bizminer or D&B is stronger for granular, client-ready benchmarking that needs firm-size breakouts.
Are free industry ratio sources reliable?
Damodaran’s NYU tables are free, academically rigorous, and widely cited, which makes them a solid exception to the rule that free data is weaker. Most other free sources trade off either sample size disclosure or update frequency.
How often should I check for updated industry ratio data?
That depends on the source’s own cadence. Some datasets refresh annually, others less often. Always check the vintage date on any report before using it, since a benchmark built on outdated filings can misrepresent current industry conditions.
Can I use industry ratios to benchmark a private company?
Yes, but choose a source that explicitly discloses its private-firm sample count. Dun & Bradstreet and Bizminer both compile private-company data, which makes them better fits than sources built purely from public filings like Compustat.
Do courts and government agencies accept commercial ratio data as evidence?
Some do. Bizminer’s data has been accepted in U.S. Tax Court and used by government agencies, which sets a higher bar for reliability than most consumer-facing benchmarking tools meet.
Sources
Five categories cover almost every legitimate use case: commercial databases, association/vendor reports, IRS-derived datasets, academic compilations, and library research guides. Here’s what each brings to the table.
- MIT Library: Business & Management – Industry resources
- WRDS — Financial Ratios: Industry Level
- Aswath Damodaran — Working Capital Ratios by Sector (US)
- Industrial Ratios — Industry Data Sources (University of Cincinnati Libraries)