Local market analysis is the process of measuring local demand, competitive supply, and purchasing power within a defined geography to support a specific business decision. If you’re deciding whether to open a second location, adjust your pricing, or pitch an investor, this is where you start. Three things you can do in the next 24–72 hours: define your objective in one sentence, draw your geographic boundary (zip code, city, county, or metro area), and pull one free federal dataset from the U.S. Census Bureau, the Bureau of Labor Statistics, or the Bureau of Economic Analysis.
- Define your objective: Write one sentence stating the decision this analysis must inform.
- Pick your geography: Choose the smallest unit that matches your real customer reach (zip, city, county, or MSA).
- Pull one free dataset: Start with Census population and demographic data, BLS local unemployment figures, or BEA county personal income.
Key Takeaways
A complete local market analysis combines free federal data (Census, BLS, BEA, NAICS, SUSB) with primary research and, when precision matters, a granular industry benchmark to produce a defensible, decision-ready market picture.
| Point | Details |
|---|---|
| Start with a clear objective | Write one sentence defining the decision your analysis must inform before pulling any data. |
| Use federal sources first | Census ACS, BLS LAUS, BEA county GDP, and SUSB give you population, employment, and competitor counts at no cost. |
| Size the market with TAM/SAM/SOM | Apply the three-tier formula with sourced inputs; a 1% SOM on an $86.4M SAM yields an $864K year-one revenue target. |
| Add benchmarks when stakes are high | Lenders and investors compare your projections to industry norms; granular benchmarks close that gap and reduce model error. |
| Bizminer for court-ready reports | Bizminer covers 9,000+ markets with financial benchmarks accepted in U.S. Tax Court, making it the right tool when your analysis needs to withstand scrutiny. |
Table of Contents
- What is local market analysis and who benefits from it?
- Why local market analysis matters for small businesses
- When should you run a local market analysis?
- Core components to evaluate in a local market analysis
- How do you conduct a local market analysis step by step?
- What U.S. data sources and tools should you use?
- Why granular benchmarks change the quality of your decisions
- How do you turn analysis findings into business decisions?
- What does a local market analysis cost and how long does it take?
- Practical checklist and templates to use right now
- What most local market analyses get wrong
- When Bizminer saves you time and reduces risk
- The part most guides skip: why your analysis is only as good as your geography definition
- Sources
What is local market analysis and who benefits from it?
Local market analysis differs from broad industry research in one critical way: it is geographically bounded. A national industry report tells you how the restaurant sector performs across the U.S. A local market analysis tells you whether a specific neighborhood in Columbus, Ohio can support another fast-casual concept given current competition, income levels, and foot traffic patterns.
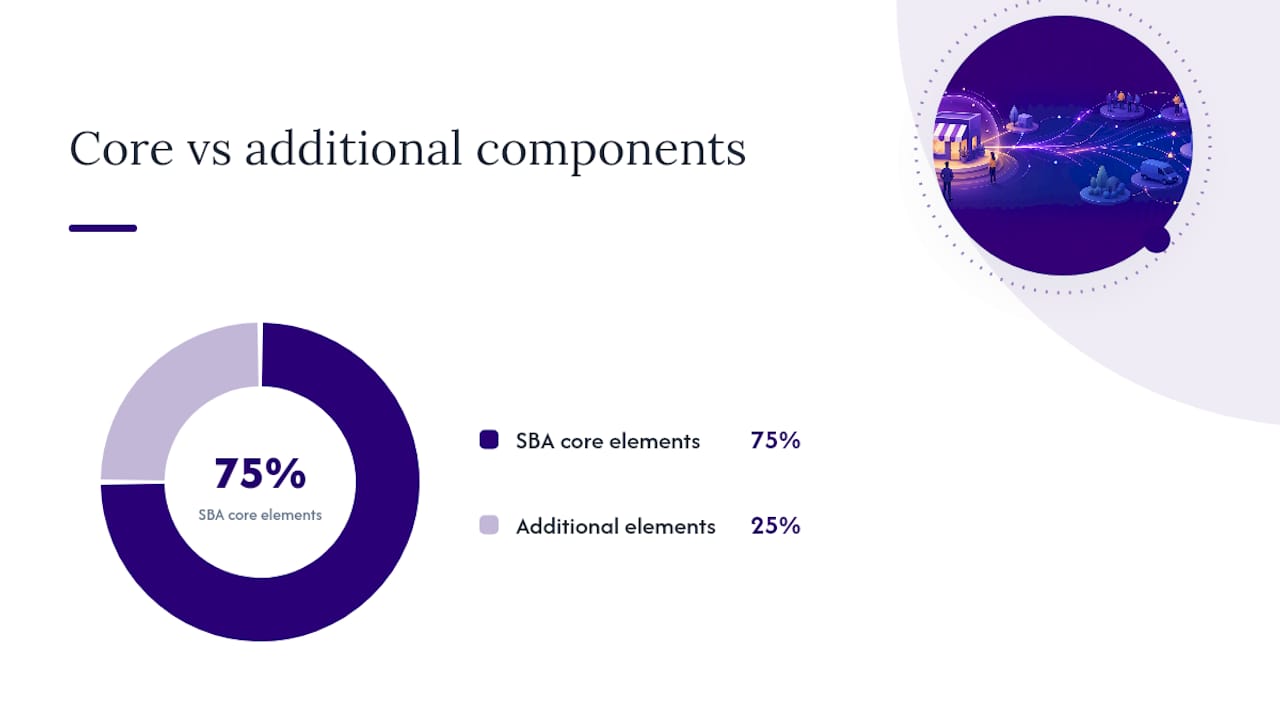
The SBA defines the core elements as demand, market size, economic indicators, location, market saturation, and pricing. That framework applies whether you’re a solo service provider or a regional franchise operator.
Who benefits most:
- Retail store owners evaluating a new location or a second storefront
- Service businesses (HVAC, dental, legal, fitness) assessing whether a market is underserved
- Franchisees validating territory potential before signing a franchise agreement
- Lenders and business advisors underwriting a loan or advising a client on expansion
- B2B companies mapping regional demand before hiring a sales rep or opening a regional office
- Startups building a business plan that needs a credible market-size section for investors
Geographic scales used in local analysis range from the zip code (the tightest, best for retail and foot-traffic businesses) up through city, county, and Metropolitan Statistical Area (MSA). The right scale depends on how far your customers realistically travel to reach you, or how far your sales team covers in a territory.
Why local market analysis matters for small businesses
Three business decisions hinge directly on a solid local analysis: site selection, pricing, and customer acquisition targeting. Get any one of them wrong and the cost compounds quickly.
Site selection is the most obvious application. A retailer who skips a geographic market study and signs a lease based on gut feel risks landing in a trade area with too many competitors, insufficient foot traffic, or a median household income that doesn’t match the price point. A proper analysis surfaces those signals before the lease is signed.
Pricing is where most small businesses leave money on the table. National pricing benchmarks are almost always wrong at the local level. A plumbing company in suburban Phoenix operates in a different cost and competitive environment than one in rural Vermont. Knowing what local competitors charge, and what local customers can afford, lets you price with confidence rather than guesswork.
Customer acquisition becomes far more efficient when you know exactly who lives, works, or shops in your trade area. Local demographic data from the Census narrows your ad targeting, your direct mail radius, and your hiring geography.
Three short real-world scenarios:
- A coffee shop owner in a mid-sized Midwestern city uses county-level income data and SUSB competitor counts to confirm the neighborhood is underserved. She opens, hits break-even in month seven.
- A regional HVAC company uses BLS employment data and BEA personal income figures to rank three counties by expansion priority. The county with the fastest income growth and lowest competitor density wins.
- A B2B software firm uses MSA-level industry employment data to size the addressable market before hiring its first regional sales rep.
Benefits at a glance:
- Reduces the risk of a costly location or product mistake
- Produces credible market-size numbers for lenders and investors
- Sharpens marketing spend by targeting the right customer segments
- Reveals pricing headroom or compression before you commit
When should you run a local market analysis?
Timing matters. Running a full analysis when you don’t need one wastes time; skipping it when you do need one is how businesses make expensive mistakes. The triggers below tell you when a formal analysis is worth the effort.
- Opening a new location or entering a new market — the highest-stakes trigger; always warrants a full analysis.
- Launching a new product or service line — especially if the customer base or price point differs from your current offering.
- Repricing an existing product or service — local competitive and income data should anchor any significant price change.
- Seeking a loan or outside investment — lenders and investors expect a credible market-size section; a federal-data-backed analysis satisfies that expectation.
- Responding to a sudden economic shift — a plant closure, a major employer moving in, or a demographic shift in your trade area all warrant a quick re-check.
- Preparing an annual business plan — even if nothing dramatic has changed, a light annual review keeps your assumptions current.
- Noticing a sustained revenue decline — before cutting costs or changing your offer, confirm whether the market itself has shifted.
For an existing business, a practical cadence is a quarterly light check (pull BLS unemployment and one or two revenue-trend indicators) and an annual deep review that revisits market size, competitor counts, and customer demographics.
Core components to evaluate in a local market analysis
The SBA’s framework covers six core elements. A thorough analysis adds two more: target customer profiles and qualitative insights from primary research. Each component answers a specific question, and each maps to at least one authoritative U.S. data source.
| Component | Question it answers | Primary U.S. source |
|---|---|---|
| Demand | Is there enough customer need in this geography? | BLS LAUS (employment/income), Census ACS |
| Market size | How large is the total revenue opportunity? | Census SUSB, BEA county GDP |
| Economic indicators | Is the local economy growing, stable, or contracting? | BEA county GDP, BLS CPI |
| Location/reach | Can customers access you, and can you reach them? | Census population density, mapping tools |
| Market saturation | How many competitors already serve this market? | SUSB by NAICS |
| Pricing | What do competitors charge and what can customers pay? | BLS CPI, industry benchmarks |
| Target customers | Who specifically buys, and what do they value? | Census ACS demographics, primary surveys |
| Qualitative insights | Why do customers choose or avoid options like yours? | Customer interviews, focus groups |
A few notes on using these sources together. NAICS codes are the connective tissue: you need the right 4–6 digit NAICS code to pull SUSB competitor counts and BEA industry data for your specific business type. The BEA’s county and metro data gives you personal income and GDP figures that anchor your purchasing-power estimates. BLS LAUS gives you the unemployment rate and labor force size, which matters both for demand-side analysis (employed people spend more) and for hiring feasibility.
Pro Tip: Pull BEA personal income per capita alongside Census median household income for the same county. The two figures often diverge, and the gap tells you something real about income distribution in your market.
How do you conduct a local market analysis step by step?
The most effective workflow moves from objective to geography to secondary data to primary research to market sizing, then loops back to test your assumptions before producing deliverables. Here is the full sequence.
- Define your objective. Write one sentence: “This analysis will determine whether [geography] can support [business type] at [price point].” Every subsequent step filters through that sentence.
- Define your geography. Pick the smallest unit that matches your real customer reach. A walk-in retail shop might use a 3-mile radius or a zip code. A regional B2B firm might use a multi-county MSA.
- Gather secondary data. Pull federal datasets first: Census population and demographics from data.census.gov, BLS LAUS employment figures, BEA county personal income, and SUSB competitor counts filtered by your NAICS code.
- Run primary research. Design a short survey (10–15 questions) or conduct 5–10 customer interviews. Primary research fills the gaps that federal data can’t answer: why customers choose competitors, what they’d pay for your offer, and what frustrates them about current options.
- Conduct competitor analysis. Use SUSB to count competitors by NAICS in your geography. Then go deeper: visit or call the top 5–10, check their pricing, read their reviews, and map their locations relative to yours.
- Size the market using TAM/SAM/SOM.
- Test your assumptions. Run a sensitivity check: what happens to your revenue forecast if your market share is half what you projected? If the business still works, proceed.
- Prepare deliverables. At minimum: a market-size table, a SWOT analysis, a competitor matrix, and a one-page summary of findings tied back to your original objective.
Worked TAM/SAM/SOM example
Suppose you’re opening a residential cleaning service in a mid-sized county with 180,000 households.
- TAM (Total Addressable Market): All 180,000 households × $1,200 average annual spend on cleaning services = $216 million
- SAM (Serviceable Addressable Market): You serve households with incomes above $75,000. Census ACS data shows 40% of households meet that threshold: 72,000 households × $1,200 = $86.4 million
- SOM (Serviceable Obtainable Market): In year one, you realistically capture 1% of your SAM: 720 households × $1,200 = $864,000
That $864,000 SOM becomes your year-one revenue target. It also tells you how many crews you need, what your marketing budget should accomplish, and whether the unit economics work.
Pro Tip: The $1,200 average spend figure in the example above should come from BLS Consumer Expenditure Survey data or an industry benchmark report, not a guess. Using a sourced figure makes the model defensible to a lender or investor.
What U.S. data sources and tools should you use?
Start with federal sources for broad measures. Add a paid, granular source when you need subcounty industry benchmarks or court-ready financial profiles.
Federal sources and their best uses:
- Data: Population counts, age and income distributions, household size, housing tenure. Pull American Community Survey (ACS) 5-year estimates for small geographies.
- BEA county GDP and personal income: Compare economic size and growth across counties. BEA’s interactive maps let you visualize which counties are growing fastest.
- NAICS lookup: Find the correct 4–6 digit industry code before pulling any SUSB or BEA industry data. Using the wrong code produces meaningless competitor counts.
- SUSB: Firm counts, employment, and payroll by NAICS and county or MSA. The fastest way to measure competitor density and market saturation.
- BLS CPI: Regional price indexes and inflation data. Use it to adjust historical revenue figures and to contextualize pricing sensitivity.
- BEA regional datasets: Downloadable GDP by industry and personal income by county, useful for industry-level contribution analysis.
- SBA resources: Templates, guides, and links to federal data sources specifically framed for small business planning.
Practical tools and software:
- Benchmarking reports: When free federal data isn’t granular enough, a paid source like Bizminer’s industry benchmarks covers over 9,000 markets with financial profiles segmented by industry, geography, and company size.
Bizminer’s financial data is accepted in U.S. Tax Court and used by government agencies — a standard of reliability that matters when your analysis supports a loan application, a legal proceeding, or an investor pitch.
Pro Tip: Combine three or four free federal pulls with one precise paid benchmark. The federal data gives you population, employment, and competitor counts. The paid benchmark gives you industry-specific profit margins, revenue per employee, and pricing norms. Together, they answer questions neither source can answer alone, and the total cost is a fraction of commissioning a full custom study.
Why granular benchmarks change the quality of your decisions
Federal data tells you how many competitors exist and how many people live in your market. It does not tell you whether those competitors are profitable, what margins are typical for your industry at your revenue size, or how your projected financials compare to peers. That gap is where granular benchmarks earn their keep.
Consider two scenarios. A restaurant owner uses Census and BLS data to confirm there’s demand in her trade area. Her lender flags the discrepancy and the loan stalls.
A business advisor working with a regional HVAC company uses Bizminer’s financial benchmarks to pull revenue-per-employee and gross margin norms for HVAC contractors in the client’s county. The benchmarks reveal the client’s labor costs are running 8 percentage points above the local peer median. That single data point drives a staffing restructure that improves margins within two quarters.
Where granular benchmarks add the most value:
- Pricing decisions: Confirm whether your proposed price is above, at, or below the local competitive norm for your industry tier.
- Loan underwriting: Lenders compare your projected financials against industry benchmarks; a mismatch raises red flags.
- Prospecting lists: Advisors and lenders use benchmarked data to identify firms in a geography that are underperforming peers, which signals a sales or advisory opportunity.
- SWOT analysis: Benchmarks give the “S” and “W” columns real numbers instead of subjective impressions.
Business advisors and accountants who use Bizminer regularly report that the ability to show a client exactly how their financials compare to local peers shifts the conversation from opinion to evidence. That shift is what makes recommendations stick.
How do you turn analysis findings into business decisions?
Findings sitting in a spreadsheet don’t make decisions. The deliverables below translate raw data into choices your business can act on.
Standard deliverables from a complete local analysis:
- Market-size table (TAM/SAM/SOM with sourced inputs and assumptions)
- SWOT analysis grounded in local data, not generic impressions
- Competitor matrix scoring the top 5–10 local competitors on price, quality, location, and reach
- Customer personas built from Census demographics and primary interview findings
- Forecast adjustment showing how your revenue model changes under different market-share scenarios
Sample decision matrix
Score each candidate market or location on a 1–5 scale for each factor, then sum the scores. The highest total wins.
Market A wins on this scoring. But notice that Market B scores higher on accessibility and costs. If your business model is highly cost-sensitive, you’d adjust the weights before making a final call.
That $259,000 gap changes your break-even timeline, your hiring plan, and the size of the credit line you need. Running this sensitivity check before you commit is the whole point of the analysis.
For guidance on translating these findings into financial projections, a practical resource on financial forecasting for small businesses covers the mechanics of converting market assumptions into 12-month income statements.
What does a local market analysis cost and how long does it take?
The honest answer: it depends almost entirely on how much primary research you need and how granular your benchmarks have to be. A solo entrepreneur pulling free federal data over a weekend is not the same project as a multi-location retailer commissioning a custom report with primary surveys.
What drives cost up:
- Primary research (surveys, interviews, focus groups) adds time and often requires an incentive budget.
- Geographic granularity below the county level (zip code or census tract) requires more data pulls and more cleaning.
- Benchmarking depth: a paid industry benchmark report from a source like Bizminer costs far less than a full custom study and delivers court-accepted financial norms that free sources can’t match.
- Multiple geographies: comparing three candidate markets triples the data-gathering work.
For most small businesses, the mid-depth analysis at $500–$2,500 hits the right balance. You get credible market-size numbers, a defensible competitor count, and enough primary insight to validate your assumptions, without the cost of a full agency engagement.
Practical checklist and templates to use right now
Work through this checklist in order. Each item maps to a step in the methodology above.
Project checklist:
- [ ] Write your one-sentence objective
- [ ] Define and document your geographic boundary
- [ ] Identify your NAICS code using the Bizminer NAICS search tool or the Census NAICS lookup
- [ ] Pull Census ACS data (population, income, age, household size) for your geography
- [ ] Pull BLS LAUS employment and unemployment data for your county or MSA
- [ ] Pull BEA personal income and county GDP data
- [ ] Pull SUSB competitor counts for your NAICS and geography
- [ ] Design and field a 10–15 question customer survey or schedule 5–10 interviews
- [ ] Visit or research the top 5–10 local competitors (pricing, reviews, location)
- [ ] Build your TAM/SAM/SOM table using the formula below
- [ ] Complete a SWOT analysis using local benchmark data
- [ ] Score candidate markets or locations using the decision matrix
- [ ] Adjust your 12-month revenue forecast based on your SOM
- [ ] Document sources and assumptions for every figure
Templates to build or download:
- Market-size spreadsheet with TAM/SAM/SOM rows, input cells for population and penetration rate, and auto-calculated revenue figures
- Competitor matrix with columns for competitor name, location, price range, estimated revenue tier, strengths, and weaknesses
- SWOT template with four quadrants pre-labeled and a column for the data source behind each entry
- Customer survey script with 12 standard questions covering purchase frequency, price sensitivity, current provider satisfaction, and switching triggers
TAM formula snippet:
TAM = [Target population in geography] × [Average annual spend per customer]
SAM = TAM × [% of population that fits your customer profile]
SOM = SAM × [Your realistic market share % in year one]
What most local market analyses get wrong
The most common mistake is defining the geography wrong. Entrepreneurs tend to draw the boundary too wide because a larger market looks more impressive in a business plan. A coffee shop does not serve a 20-mile radius. A residential cleaning service does not serve an entire MSA. When the geography is too broad, every downstream number is inflated, and the analysis loses credibility with anyone who knows the market.
The second mistake is leaning on national averages when local data exists. Using a national median household income figure when the Census publishes county and zip-level ACS data is a choice to be less accurate. Local data is available and free. Use it.
Common mistakes and how to fix them:
- Wrong geography: Define the boundary based on actual customer travel behavior, not administrative convenience. Use a drive-time radius for retail; use county or MSA for B2B.
- National averages standing in for local data: Replace national figures with county or MSA data from Census, BLS, and BEA wherever it exists.
- Ignoring seasonality: A beach town’s market looks very different in July than in January. Pull at least two years of BLS employment data to see seasonal patterns.
- Weak primary research design: Surveys with leading questions produce useless data. Ask behavioral questions (“How often do you currently use X?”) rather than hypothetical ones (“Would you use X if it existed?”).
- Treating competitor counts as competitor analysis: SUSB tells you how many firms exist. It doesn’t tell you which ones are strong, which are vulnerable, and which are poorly reviewed. You still have to do the qualitative work.
Pro Tip: After you complete your quantitative analysis, conduct at least five in-person or phone interviews with people who match your target customer profile. Ask them to describe the last time they bought what you sell: where they went, why they chose that provider, and what they’d change. Those five conversations will surface at least one insight your spreadsheet missed.
When Bizminer saves you time and reduces risk

Free federal data gets you most of the way there. But there’s a specific moment when a paid, benchmarked report pays for itself: when your analysis needs to hold up to scrutiny from a lender, an investor, a court, or a sophisticated advisor.
Bizminer delivers granular market and industry research across more than 9,000 unique markets, segmented by industry, geography, and company size. The reports include industry financial benchmarks, market trend analysis, company-level SWOT analysis, valuation reports, and prospect lists. The data is accepted in U.S. Tax Court and used by government agencies, which means it carries a level of credibility that a DIY spreadsheet built from free sources cannot match.
What Bizminer gives you that free sources don’t:
- Industry-specific profit margins, revenue per employee, and expense ratios benchmarked to your geography and company size
- Customizable financial data profiles that match your exact NAICS code and revenue tier
- Prospect lists for identifying underperforming local firms, useful for advisors and lenders
- API access for teams that need to integrate benchmarked data into their own models
- Custom reports that can be ordered for a specific market, industry, and company size combination
For accountants, business advisors, and financial institutions, Bizminer’s subscription tiers make it practical to run benchmarked analyses for multiple clients without commissioning a separate study each time. For a small business owner who needs one credible report for a loan application or investor deck, a one-off report purchase is the right entry point.
Request a sample report at Bizminer to see the data format and depth before committing to a purchase.
The part most guides skip: why your analysis is only as good as your geography definition
A perspective from Danny
Every local market analysis failure I’ve seen traces back to the same root cause: the geography was wrong. Not the data sources, not the methodology, not the TAM formula. The boundary.
Business owners draw their market too wide because a bigger number feels safer in a business plan. But a market that’s technically accurate and practically useless is worse than no analysis at all. It gives you false confidence. You build a revenue model on a $216 million TAM when your real serviceable market is closer to $12 million, and you don’t find out until month eight when customer acquisition costs are three times your projection.
The fix is almost embarrassingly simple: define your geography based on observed customer behavior, not administrative convenience. Pull your existing customer addresses if you have them. Map them. If you’re pre-revenue, use drive-time analysis (most GIS tools and even Google Maps can approximate this) and be conservative.
The second thing most guides skip is the integration of qualitative and quantitative data. Federal datasets tell you what is happening in a market. Customer interviews tell you why. A market with low competitor density and strong income levels looks attractive on paper. But if five interviews reveal that local customers are intensely loyal to an incumbent provider and have no interest in switching, that’s information your SUSB pull will never surface. The quantitative analysis sets the stage. The qualitative work tells you whether the play actually works.

Run the numbers. Then talk to ten people. The combination is what separates a real analysis from a document that just looks like one.
Sources
These are the primary federal and professional resources for conducting a local market analysis in the United States.
- County, Metro and Other Local Areas | U.S. Bureau of Economic Analysis (BEA)
- GDP by County | U.S. Bureau of Economic Analysis (BEA)
- Market research and competitive analysis | U.S. Small Business Administration
- Statistics of U.S. Businesses (SUSB) | U.S. Census Bureau
- NAICS | U.S. Census Bureau