Market trend analysis is the systematic process of spotting, measuring, and testing market signals so teams can anticipate demand and prioritize strategic actions. Done well, it converts raw data into a defensible forecast and a ranked list of bets worth making. Here is the short version of how it works:
- Define the decision the analysis needs to inform.
- Collect data from first-party sources (CRM, sales, transactions) and secondary sources (industry reports, government data, social listening).
- Analyze and decompose the data: separate trend from seasonality, smooth noise, and identify drivers.
- Validate signals against multiple independent sources before acting.
- Translate insights into prioritized experiments with owners, KPIs, and deadlines.
- Monitor on a cadence: monthly for competitive signals, quarterly for tactical reviews, annually for deep-dive sizing.
The outputs you are aiming for: a written insight statement, a ranked list of tests to run, and a live dashboard with alert thresholds. Keep those three deliverables in mind throughout every step below.
Key Takeaways
Effective market trend analysis requires a decision-aligned workflow, triangulated data sources, validated methods, and a clear prioritization framework to convert signals into strategic bets.
| Point | Details |
|---|---|
| Start with the decision | Define the specific decision the analysis informs before collecting any data. |
| Triangulate across sources | Combine first-party CRM data, government datasets, and syndicated reports to reduce false positives. |
| Smooth before concluding | Apply a moving average to noisy signals; act only when the smoothed trend shows a clear direction. |
| Score by impact and confidence | Multiply impact by confidence to rank insights and match them to the right investment size. |
| Bizminer anchors benchmarks | Bizminer’s granular, NAICS-segmented U.S. benchmarks provide the defensible data foundation that trend forecasts require. |
Table of Contents
- Why should your team run market trend analysis right now?
- What types of trends should analysts monitor?
- How to run a market trend analysis from start to finish
- Which analytical methods and metrics actually matter?
- How do you turn trend insights into strategic actions?
- What pitfalls and ethical risks should you watch for?
- How does high-granularity U.S. industry data strengthen your analysis?
- What the data keeps teaching me about trend analysis
- Bizminer gives your trend analysis a defensible data foundation
- Sources
Why should your team run market trend analysis right now?
The honest answer is that most strategic decisions are made on stale data. Product teams bet on features that customers stopped wanting six months ago. Marketing teams pour budget into channels that peaked last quarter. Pricing teams miss the window when demand is rising and competitors have not yet caught up.
Trend analysis gives teams a structured way to detect historical patterns and project them forward, using surveys, focused research, and tracking tools to separate meaningful signals from noise. The business case is not abstract.
Concrete outcomes teams use trend analysis to drive:
- Positioning: Spot a demand shift before competitors do and reframe messaging to capture it.
- Investment prioritization: Rank product bets by demand trajectory, not gut feel.
- Pricing and promotional timing: Identify seasonal peaks and price-sensitivity windows before they arrive.
- Budget allocation: Shift spend toward growing channels and away from declining ones with data to back the decision.
- Risk reduction: Detect early warning signals in sales or sentiment data before a demand drop becomes a revenue problem.
Market analysis frameworks that tie analysis to decisions and run on a defined cadence consistently outperform one-off research projects. The reason is simple: a one-time analysis answers last quarter’s question. A recurring process answers the question you have right now.
What types of trends should analysts monitor?
Not every signal deserves the same response. Some trends are structural shifts that reshape an industry over years. Others are seasonal rhythms that repeat every twelve months. Knowing which type you are looking at determines how fast you need to act and how much you should invest.
- Consumer/behavioral trends: Shifts in purchase patterns, channel preferences, or product usage. Signal: rising return rates in a category, declining average order value, or a spike in a specific search query cluster. Example: a sustained increase in mobile checkout completions signals a channel shift worth investing in.
- Seasonal/cyclical trends: Predictable fluctuations tied to calendar events, fiscal cycles, or weather. Signal: year-over-year (YoY) revenue spikes in Q4 for retail, Q1 for tax services. These are the easiest to model and the most dangerous to ignore when planning inventory or staffing.
- Technological trends: Adoption curves for new tools, platforms, or production methods. Signal: rising API call volumes, new patent filings in a category, or a surge in job postings for a specific skill set. Example: a jump in “generative AI” job postings across an industry is a leading indicator of where technology spend is heading.
- Economic trends: Macro signals that affect purchasing power and business investment. Signal: interest rate movements, unemployment rates, consumer confidence indices, and input cost indices from the Bureau of Labor Statistics.
- Competitive trends: Changes in competitor pricing, product launches, market share, or geographic expansion. Signal: share-of-voice shifts in paid search, new product SKUs from key rivals, or changes in their job posting patterns.
- Social/sentiment trends: Shifts in how consumers talk about a category, brand, or topic online. Signal: net sentiment score movement, topic cluster emergence in social listening tools, or a rising volume of a specific complaint type.
- Geographic trends: Demand patterns that vary by region, metro area, or zip code. Signal: regional sales data showing growth in markets where national averages are flat.
- Channel shift trends: Movement of purchase behavior from one distribution channel to another. Signal: declining in-store traffic alongside rising direct-to-consumer (DTC) revenue in the same category.
On time horizons: a spike in Google Trends data is a short-term signal, worth watching but not worth a capital investment on its own. A three-year upward slope in CAGR across multiple data sources is a structural shift that warrants a strategic response. Always ask whether a signal is a blip or a direction before deciding how to act.
How to run a market trend analysis from start to finish
This is the workflow. Follow it in order. Each step produces an output that feeds the next.
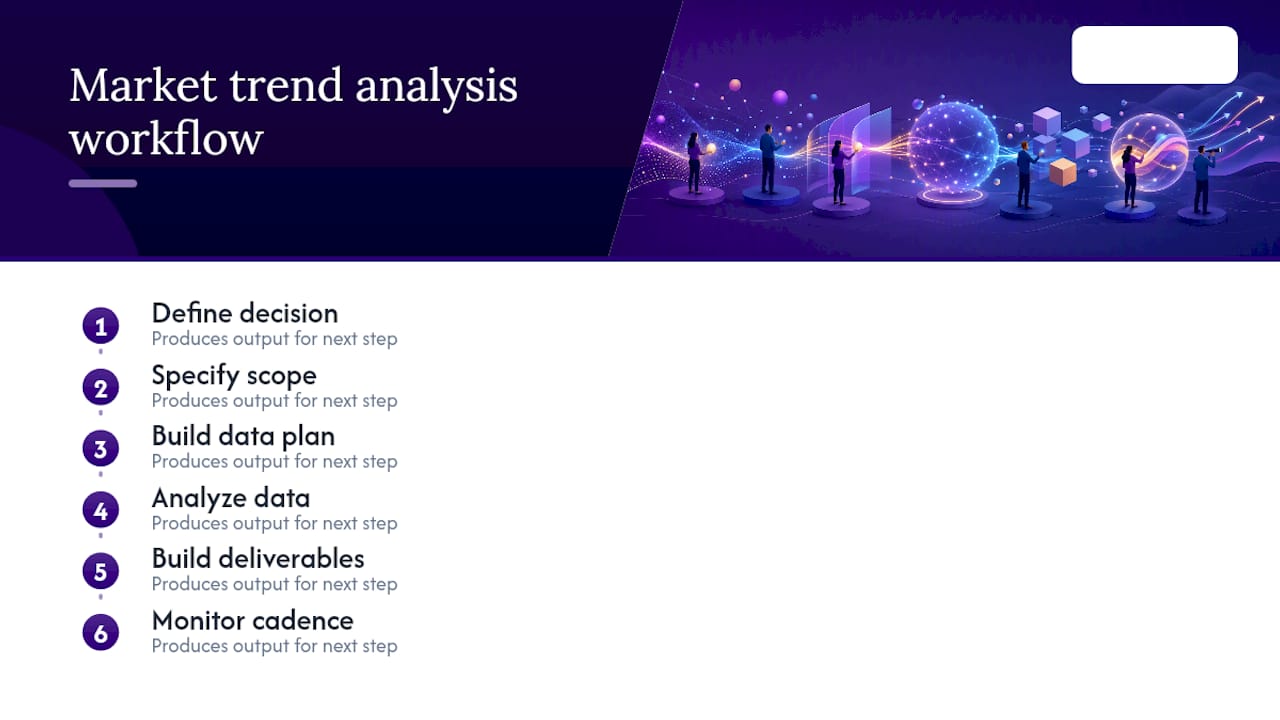
Step 1: Define the decision
Write one sentence: “This analysis will inform [specific decision] by [date].” If you cannot write that sentence, you are not ready to collect data. Market analysis that does not tie to a decision is unlikely to change outcomes.
Step 2: Specify scope and market boundaries
Define your TAM (total addressable market), SAM (serviceable addressable market), and SOM (serviceable obtainable market). Use NAICS codes to set industry boundaries precisely. Set a time horizon: 12 months for tactical decisions, 3–5 years for strategic ones. Document both before touching any data.
Step 3: Build your data plan
List the minimum datasets you need and why. A practical blend combines first-party data (CRM records, transaction logs, customer support tickets) with secondary sources (industry reports, government data) and voice-of-customer inputs. Triangulating across sources reduces false positives — a signal that appears in your CRM data, a government dataset, and a social listening tool is far more credible than one that appears in only one place.
Step 4: Run the analytical sequence
Clean the data first: remove duplicates, handle missing values, and flag outliers. Then:
- Decompose the time series into trend, seasonality, and residual components.
- Smooth the trend line using a moving average (see Section 6 for the formula).
- Forecast using exponential smoothing or ARIMA for short-to-medium horizons.
- Segment by cohort, geography, or customer type to find where the trend is strongest.
- Cross-check with external signals (search trends, industry benchmarks, competitor data).
Step 5: Build your deliverables
A strong market analysis report includes market sizing (TAM/SAM/SOM), customer segmentation, competitive landscape, key trend drivers, risks, and prioritized recommendations. Structure your output around those components.
KPI tracking table template:
Forecasting scenario outline:
- Base case: Current trend continues at the observed CAGR.
- Upside case: Demand accelerates by [X]% if [named driver] materializes.
- Downside case: Demand contracts by [Y]% if [named risk] occurs.
- Trigger conditions: Define the data thresholds that would move you from base to upside or downside.
Step 6: Monitor on a cadence
Run monthly competitive monitoring, quarterly tactical reviews, and an annual deep-dive sizing update. Set dashboard alerts for threshold breaches so the team responds to signals, not to scheduled meetings.
Pro Tip: When a data source produces a noisy signal, apply a 3-period centered moving average before drawing any conclusion. If the smoothed line still shows a clear direction, the signal is real. If it flattens, you are looking at noise.
Which analytical methods and metrics actually matter?
Method selection depends on the question. Time-series analysis, regression, and comparative analysis each serve different purposes, and mixing them up wastes time.
Core methods
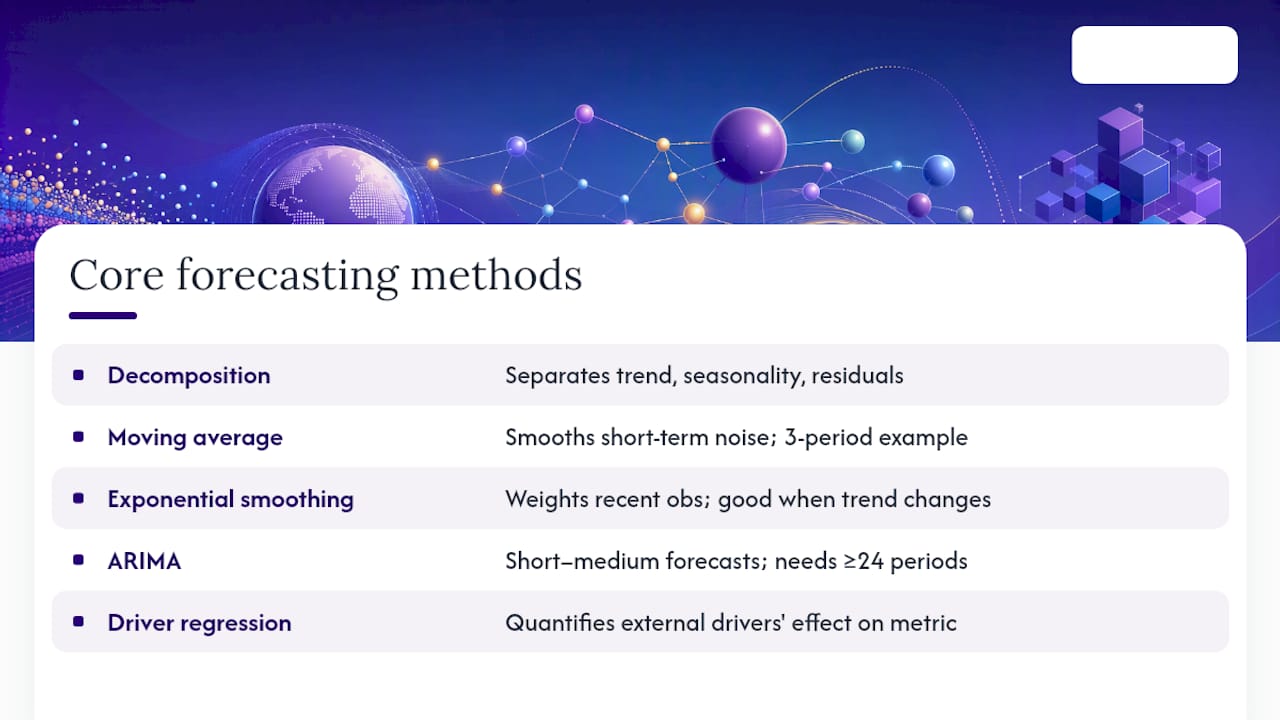
Time-series decomposition splits a data series into trend, seasonality, and residual. Use it whenever you need to know whether a growth signal is structural or seasonal. Most BI tools (Tableau, Power BI, Looker) have built-in decomposition functions.
Moving average smooths short-term noise. A simple 3-period moving average for period t is:
MA(t) = [Value(t-1) + Value(t) + Value(t+1)] / 3
Use a longer window (12 periods) for monthly data with strong seasonality.
Exponential smoothing weights recent observations more heavily than older ones. Better than a simple moving average when the trend is accelerating or decelerating.
ARIMA (AutoRegressive Integrated Moving Average) is the standard for short-to-medium horizon forecasting when you have at least 24 periods of clean data. It handles both trend and seasonality. Python’s statsmodels library and R’s forecast package both implement it with minimal setup.
Regression for driver analysis answers “what is causing the trend?” rather than “what will happen next?” Use it to quantify the relationship between an external variable (consumer confidence, input costs) and your outcome metric.
Cohort analysis tracks groups of customers who share a common characteristic (acquisition month, product tier) over time. It reveals whether retention is improving or degrading beneath a flat aggregate number.
Sentiment scoring assigns a numeric value to qualitative social or survey data. Net sentiment = (positive mentions / total mentions) × 100. Track it over time as a leading indicator of brand health.
Key metrics
A strong market analysis report uses market growth rate and penetration rate as core benchmarks. Here is the full set worth tracking:
| Metric | Formula / Definition | What It Tells You |
|---|---|---|
| YoY growth rate | (Current period / Prior period) – 1 | Short-term momentum |
| CAGR | (End value / Start value)^(1/n) – 1 | Long-term compound growth |
| Market penetration rate | (Your customers / TAM) × 100 | White space remaining |
| Share of voice | (Your mentions / Total category mentions) × 100 | Competitive visibility |
| Cohort retention rate | Active users in cohort at period n / Original cohort size | Behavioral loyalty trend |
| Customer LTV by segment | Average revenue per user × Average customer lifespan | Segment value trajectory |
For definitions of financial ratios that support these calculations, Bizminer’s financial ratios glossary is a useful reference.
Visualization templates
- Trend + seasonality plot: Two-panel chart with the raw series on top and the decomposed trend line below. Stakeholders can immediately see whether a dip is seasonal or structural.
- Cohort retention heatmap: Rows are cohorts (by acquisition month), columns are periods since acquisition, cells are retention rates. Darker cells = higher retention. A diagonal fade is normal; a sudden cliff in one cohort flags a product or service problem.
- Forecast fan chart: A center line (base case) flanked by shaded confidence intervals for upside and downside scenarios. Forces stakeholders to see uncertainty as a range, not a point estimate.
Data quality checklist before any analysis:
- No duplicate records in the dataset
- Missing values documented and handled (imputed or excluded with rationale)
- Outliers flagged and investigated before removal
- Date fields standardized to a single format
- Source and collection date recorded for every dataset
How do you turn trend insights into strategic actions?
An insight that does not produce a decision is just a report that gets filed. The gap between analysis and action is usually a prioritization problem, not a data problem.
Prioritization framework
Score each insight on two dimensions: impact (revenue, cost, or risk magnitude if the trend plays out) and confidence (how many independent sources confirm the signal). Multiply the two scores to get a priority rank.
Map the result to an investment type:
- High impact, high confidence: Scale investment now. Allocate budget, assign owners, set a 90-day milestone.
- High impact, low confidence: Run a pilot. Limit spend to what you can afford to lose if the signal is wrong.
- Low impact, high confidence: Monitor. Set a dashboard alert and revisit quarterly.
- Low impact, low confidence: Deprioritize. Document and archive; do not spend resources on it now.
Experiment structures for validating trend-driven bets
- Pricing test: Run an A/B test on two price points for a new segment identified in the trend analysis. Measure conversion rate and average order value over 4–6 weeks. Decision rule: if the higher price point produces equal or better revenue per visitor, adopt it.
- Channel shift pilot: Allocate 10–15% of a channel’s budget to the emerging channel the trend data flagged. Run for one quarter. Decision rule: if cost per acquisition is within 20% of the incumbent channel, expand.
- Limited product launch: Release a minimum viable version of a trend-driven feature to a defined cohort. Measure adoption rate and retention delta versus the control cohort at 30 and 60 days.
Timeline and cost reality
Short pilots (4–8 weeks) require minimal budget but need a clear decision rule written before launch, or they drift into indefinite “learning mode.” Multi-quarter strategic bets require dedicated analyst time, a data infrastructure investment, and executive sponsorship. The decision-aligned cadence that works in practice: monthly monitoring for competitive signals, quarterly reviews for tactical adjustments, and an annual deep-dive for strategic repositioning.
The one-page decision memo
Every trend-driven initiative should produce a single document with five fields: the insight (one sentence), the proposed test (what, who, how long), the success KPI (one primary metric), the owner (one name), and the deadline. If it does not fit on one page, the thinking is not clear enough yet.
What pitfalls and ethical risks should you watch for?
The most expensive mistakes in trend analysis are not methodological. They are cognitive and structural.
Common analytic pitfalls:
- Survivorship bias: Analyzing only the companies or products that are still in the market gives you an optimistic picture of what works. Include failed entrants in your competitive analysis.
- Look-ahead bias: Using data in a backtest that would not have been available at the time the decision was made. Always simulate decisions using only the data that existed at that point in time.
- Overfitting: A model that fits historical data perfectly but fails on new data. Use a holdout validation set (typically the most recent 20% of your data) to test generalizability.
- Correlation vs. causation: Two metrics moving together does not mean one drives the other. Run a regression with controls or a designed experiment before claiming a causal relationship.
- Sampling bias: If your survey or panel over-represents a demographic, your trend signal reflects that group, not the market. Document sample composition and weight results accordingly.
- Mis-specified market boundaries: Defining your TAM too broadly inflates opportunity estimates; too narrowly and you miss adjacent threats. Use NAICS codes and cross-check with industry benchmark data to set defensible boundaries.
Practical safeguards:
- Hold out the most recent data period before fitting any model.
- Backtest every forecast model against at least two prior periods.
- Require at least two independent sources to confirm a signal before acting on it.
- Pre-commit to a decision rule before running any experiment, so results cannot be reinterpreted after the fact.
- Run a significance check (p-value or confidence interval) on any A/B test result before declaring a winner.
Ethics and data privacy:
The Insights Association Code of Standards & Ethics sets professional responsibilities for market research and data analytics, including how data is collected, handled, and reported. Follow it. The ICC/ESOMAR international code goes further: it requires researchers to disclose significant use of AI or synthetic data and to document methodology and oversight when those techniques affect research outputs. If your analysis pipeline uses AI-generated synthetic data or automated modeling, that disclosure is not optional. On privacy: collect only the data you need, anonymize where possible, and confirm your data collection practices comply with applicable U.S. state privacy laws before building a panel or survey instrument.
How does high-granularity U.S. industry data strengthen your analysis?
The difference between a trend analysis that gets approved and one that gets questioned in a budget meeting usually comes down to the benchmark data behind it. Saying “demand in this segment is growing” is an assertion. Saying “demand in this segment is growing at a CAGR of X%, compared to an industry benchmark of Y% for comparable firms in this NAICS code” is a defensible finding.
Bizminer’s granular industry financial and market benchmarks cover more than 9,000 U.S. industry segments, segmented by NAICS code, geography, and company size. That granularity matters because national averages routinely mask regional divergence. A trend that looks flat at the national level can be growing sharply in specific metro areas or among firms in a specific revenue band.
How Bizminer data integrates into the workflow:
- Benchmarking: Map your client’s or firm’s financial ratios against industry peers to identify whether a trend signal is firm-specific or category-wide.
- Anomaly detection: When a firm’s metrics diverge from the industry benchmark, that gap is a signal worth investigating. It could indicate early adoption of a trend or early-stage distress.
- Regional demand mapping: Use geographic segmentation in Bizminer reports to identify which U.S. markets are ahead of or behind the national trend curve.
- Regulatory and financial reporting support: Bizminer data is accepted in U.S. Tax Court and used by government agencies, which means it carries the credibility standard required for formal reporting contexts, not just internal dashboards.
Integration checklist:
- Export Bizminer benchmark data in the format your BI tool accepts (CSV, Excel, or API feed).
- Map Bizminer’s industry financial fields to your internal KPI table column headers before importing.
- Set a refresh cadence that matches Bizminer’s data update schedule so your benchmarks stay current.
- Document the data source, NAICS code, geographic scope, and report date in every dashboard that uses Bizminer outputs.
For accounting professionals and business advisors, this documentation is especially important: a benchmark that cannot be traced to a specific, dated source is not defensible in a client presentation or a regulatory filing. Bizminer’s custom report capabilities let you pull exactly the fields and segments your analysis requires, rather than working around a pre-packaged report that does not quite fit your market definition.
What the data keeps teaching me about trend analysis
The biggest mistake I see in trend analysis is treating it as a research project rather than a decision-support system. Teams spend weeks building a beautiful analysis, present it once, and then watch it gather dust because no one owns the follow-up. The insight statement, the KPI table, the experiment list: those are not deliverables for a presentation. They are operating documents that should be reviewed every month.
The second thing I keep coming back to: confidence in a signal is not binary. The question is not “is this trend real?” It is “how much should I bet on it, given what I know right now?” The impact-times-confidence scoring framework in Section 7 is the most practical answer I have found to that question. It forces you to separate the size of the opportunity from the quality of the evidence, which is exactly the distinction most stakeholders conflate.
On validation: I always run a backtest before presenting a forecast. Not because it proves the model is right, but because it shows stakeholders where the model has been wrong before, and under what conditions. That honesty builds more trust than a clean forecast with no error analysis attached.
Finally, the ethics piece is not a compliance checkbox. The ICC/ESOMAR code’s disclosure requirements for AI and synthetic data exist because undisclosed automation in a research pipeline can produce findings that look rigorous but are not. If you are using AI tools in your analysis workflow, document it. Your stakeholders deserve to know.
Bizminer gives your trend analysis a defensible data foundation
Most trend analyses stall not because the methodology is wrong, but because the benchmark data behind them cannot withstand scrutiny. A forecast built on national averages or a single syndicated report is easy to challenge. One built on granular, NAICS-segmented financial benchmarks for your exact market, geography, and firm-size band is not.

Bizminer covers more than 9,000 U.S. industry segments with financial benchmarks, market sizing data, and custom reports that map directly into the KPI tables and forecasting models described in this guide. The data is accepted in U.S. Tax Court and used by government agencies, which means it meets the credibility bar for formal reporting, not just internal strategy decks. Business advisors use it to benchmark client performance against industry peers. Financial institutions use it to assess loan risk against sector norms. Analysts use it to anchor regional demand maps with real numbers.
Request a sample report or explore Bizminer’s market and industry research to see the exact fields and segments available for your market before committing to a license.
Sources
- ICC/ESOMAR international code on market, opinion and social research and data analytics (PDF)
- Insights Association Code of Standards & Ethics
- Trend analysis article (Coursera)
- Market Analysis for B2B: The Executive Guide for 2026 | MarkCMO
- What Is a Market Analysis Report Example? Definition, Insights, and Best Practices | Sona