Industry data New York means New York–filtered industry financial benchmarks and company-level reports covering revenue, margins, ratios, and valuation multiples segmented by NAICS code, geography, and company size. If you’re pulling numbers for a valuation, a credit decision, or client advising, the next step is straightforward: request a New York report filtered by NAICS code, size band, and metro or county, with percentile output rather than a single average.
TL;DR:
- Use six-digit NAICS codes and county-level filters for precise peer groups that accurately reflect local market conditions.
- Rely on percentile output and three to five years of trend data to assess risk distribution and avoid misleading comparisons with averages.
- Request detailed breakdowns, transaction data, and sample size disclosures to ensure benchmarks can withstand expert review or legal scrutiny.
- Filter reports by relevant size bands and geographic levels to prevent comparing businesses with differing revenue scales or local market factors.
- Emphasize granular, customized data above broad averages to turn benchmark reports into actionable insights that reflect true business risk.
Table of Contents
- What Data Sources Back New York Industry Reports
- Which Financial Ratios Matter for New York Benchmarking
- How Do Professionals Apply These Benchmarks in Practice?
- What to Request When Customizing a New York Report
- Why New York-Specific Granularity Changes the Advisory Conversation
- Get New York Industry Benchmarks Built Around Your Client’s Numbers
- Sources
- FAQ
What Data Sources Back New York Industry Reports
Reports covering New York industries typically draw on three source layers: filed financial statements, aggregated firm samples pulled from public and private datasets, and, for the most granular providers, transaction-level records. Each layer answers a different question. Filed statements tell you what companies actually reported. Aggregated samples tell you where a peer group tends to sit. Transaction data tells you why a single company might deviate from that peer group.
Geographic granularity matters more than most first-time users expect. A statewide New York figure blends Manhattan retail with rural Chautauqua County agribusiness, which is nearly useless for a Buffalo lending decision. Ask for metro-level or county-level cuts whenever the industry is sensitive to local rent, labor cost, or customer density. State-level numbers work fine for macro context or academic comparison, not for underwriting a specific loan.
NAICS precision and size-band segmentation shape everything downstream. A six-digit NAICS code paired with a revenue-size band (say, $1 million to $2.5 million) produces a peer group tight enough to mean something; a three-digit code lumps businesses that don’t compete for the same customers or capital.
- Filed statements and public records for baseline accuracy
- Aggregated firm samples for peer-group median and percentile calculations
- Transaction or firm-level detail where available, for anomaly detection
- Sample-size notes and methodology disclosures at delivery
Data granularity, not sample size alone, determines whether a benchmark survives cross-examination. Granular, client-specific models calibrated to a company’s actual patterns catch real risks that one-size-fits-all industry benchmarks miss, and that same logic applies directly to how tightly you filter a New York report before you rely on it. Bizminer data has also been accepted in U.S. Tax Court and used by government agencies, which matters if a report needs to survive scrutiny beyond your own client file.
Which Financial Ratios Matter for New York Benchmarking
Five ratio categories cover nearly every credit, valuation, or advisory question you’ll face: liquidity, profitability, leverage, efficiency, and market value. Ratio analysis across these five buckets remains the standard toolkit for evaluating financial health, and each one answers a different practical question.
- Liquidity (current ratio, quick ratio): can the business cover near-term obligations?
- Profitability (gross margin, net margin, return on assets): how much of revenue converts to earnings?
- Leverage (debt-to-equity, interest coverage): how exposed is the company to a downturn or rate shock?
- Efficiency (inventory turnover, receivables days): how well does the company convert assets into revenue?
- Market value (price-to-earnings, EBITDA multiples): what would a buyer plausibly pay?
A single-year average tells you almost nothing about risk distribution. Percentile bands and interquartile ranges tell you where a company sits relative to its peers, and that positioning is what actually drives a lending decision or a valuation discount. A company at the 15th percentile for liquidity within its NAICS group is a different conversation than one sitting at the median, even if both look “fine” against a raw average.
Cross-NAICS comparison is a common mistake. Comparing a Rochester specialty manufacturer against a generic “manufacturing” median ignores that different six-digit codes carry wildly different capital intensity and margin structure. Match size bands too. A company generating $500,000 in revenue does not belong in the same benchmark pool as one generating $20 million, even inside the identical NAICS code.

Not every deviation is a red flag. High leverage in an early-stage growth company can be a strategic choice tied to its life-cycle stage rather than distress, and following NAICS-based benchmarks over multiple years helps separate a one-year anomaly from a real trend.
How Do Professionals Apply These Benchmarks in Practice?
The workflow differs slightly by job, but the underlying discipline is the same: define the peer group first, then compare, then document.
Credit review sequence:
- Define the lending objective and the specific risk questions the credit memo needs to answer.
- Identify the correct NAICS code and size band for the borrower.
- Pull New York–filtered ratios for that peer group, using metro or county detail if the business is location-sensitive.
- Compare the borrower’s trend against peer medians and percentiles over three to five years, not a single snapshot.
- Document any exceptions, including why a deviation is or isn’t a concern.
Valuation checklist: Select multiples appropriate to the industry (EBITDA multiples for most operating companies, revenue multiples for early-stage or low-margin businesses), then adjust for the company’s life-cycle stage and New York’s local market conditions. A restaurant group in Westchester County doesn’t value the same way as one in a lower-rent upstate market, even with identical financials.
Advisory benchmarking: Pick two or three KPIs that matter most to the client’s strategy, run a variance analysis against the peer median, and turn the gap into a specific recommendation rather than a report full of numbers.
Pro Tip: Aggregated, industry-wide averages can hide clustered risk, a vendor concentration, a seasonal cash crunch, an account-level anomaly, that a percentile breakdown or transaction-level sample would catch immediately. When the decision size justifies it, ask for the more granular cut.
What to Request When Customizing a New York Report
The quality of a New York benchmark report depends entirely on how specific your request is. A vague ask (“send me retail benchmarks for New York”) produces a generic report that won’t hold up in an underwriting file or an expert opinion.
- NAICS code(s), ideally six-digit for the tightest peer group
- Geographic level: state, metro area, or county, matched to how location-sensitive the industry is
- Company size band, by revenue or employee count
- Fiscal year range, with at least three years for trend analysis
- Percentile output (25th, median, 75th) rather than a single average
- Sample count disclosure so you know how many companies back each figure
Delivery format matters too. Decide upfront whether you need a formatted CSV or Excel file, raw sample rows for your own modeling, or API access if you’re running the data through a recurring workflow. If the report supports an expert opinion or a loan file, ask for methodology notes and source citations at delivery, and confirm the underlying data spans firm-level or transaction-level detail rather than a single blended average. Add-ons worth requesting when the stakes justify the cost include transaction-level detail, prospect lists for market entry work, and comparables segmented specifically by revenue band.
| Request field | What to specify | Why it matters |
|---|---|---|
| NAICS code | Six-digit where possible | Tightens the peer group to real competitors |
| Geography | State, metro, or county | Matches local cost and demand conditions |
| Size band | Revenue or employee count | Prevents comparing unlike companies |
| Fiscal range | 3 to 5 years | Distinguishes trend from anomaly |
| Output type | Percentiles, not just averages | Shows risk distribution, not just center |
Why New York-Specific Granularity Changes the Advisory Conversation
The difference between a state-level average and a county-filtered, size-matched New York report is the difference between a compliance document and something a lender can actually stand behind. I’ve seen the same underlying business look marginal against a generic New York retail median and look entirely defensible once the peer group was corrected for the right size band and metro.
That’s the real value: sharper data turns a report into an actual recommendation. A client’s leverage ratio that looks alarming against a broad industry number can look completely ordinary once you match the fiscal year, the size band, and the local metro conditions. None of that replaces judgment about the business model itself. Benchmarks tell you where a company sits relative to peers; they don’t tell you whether the peers are the right comparison in the first place.
— Danny
Get New York Industry Benchmarks Built Around Your Client’s Numbers
Bizminer is built for exactly the workflow described above: New York industry and company-level reports filtered by NAICS code, geography, and size band, with percentile output instead of a flat average. Coverage spans a wide array of markets, and reports are used by various agencies and professionals.
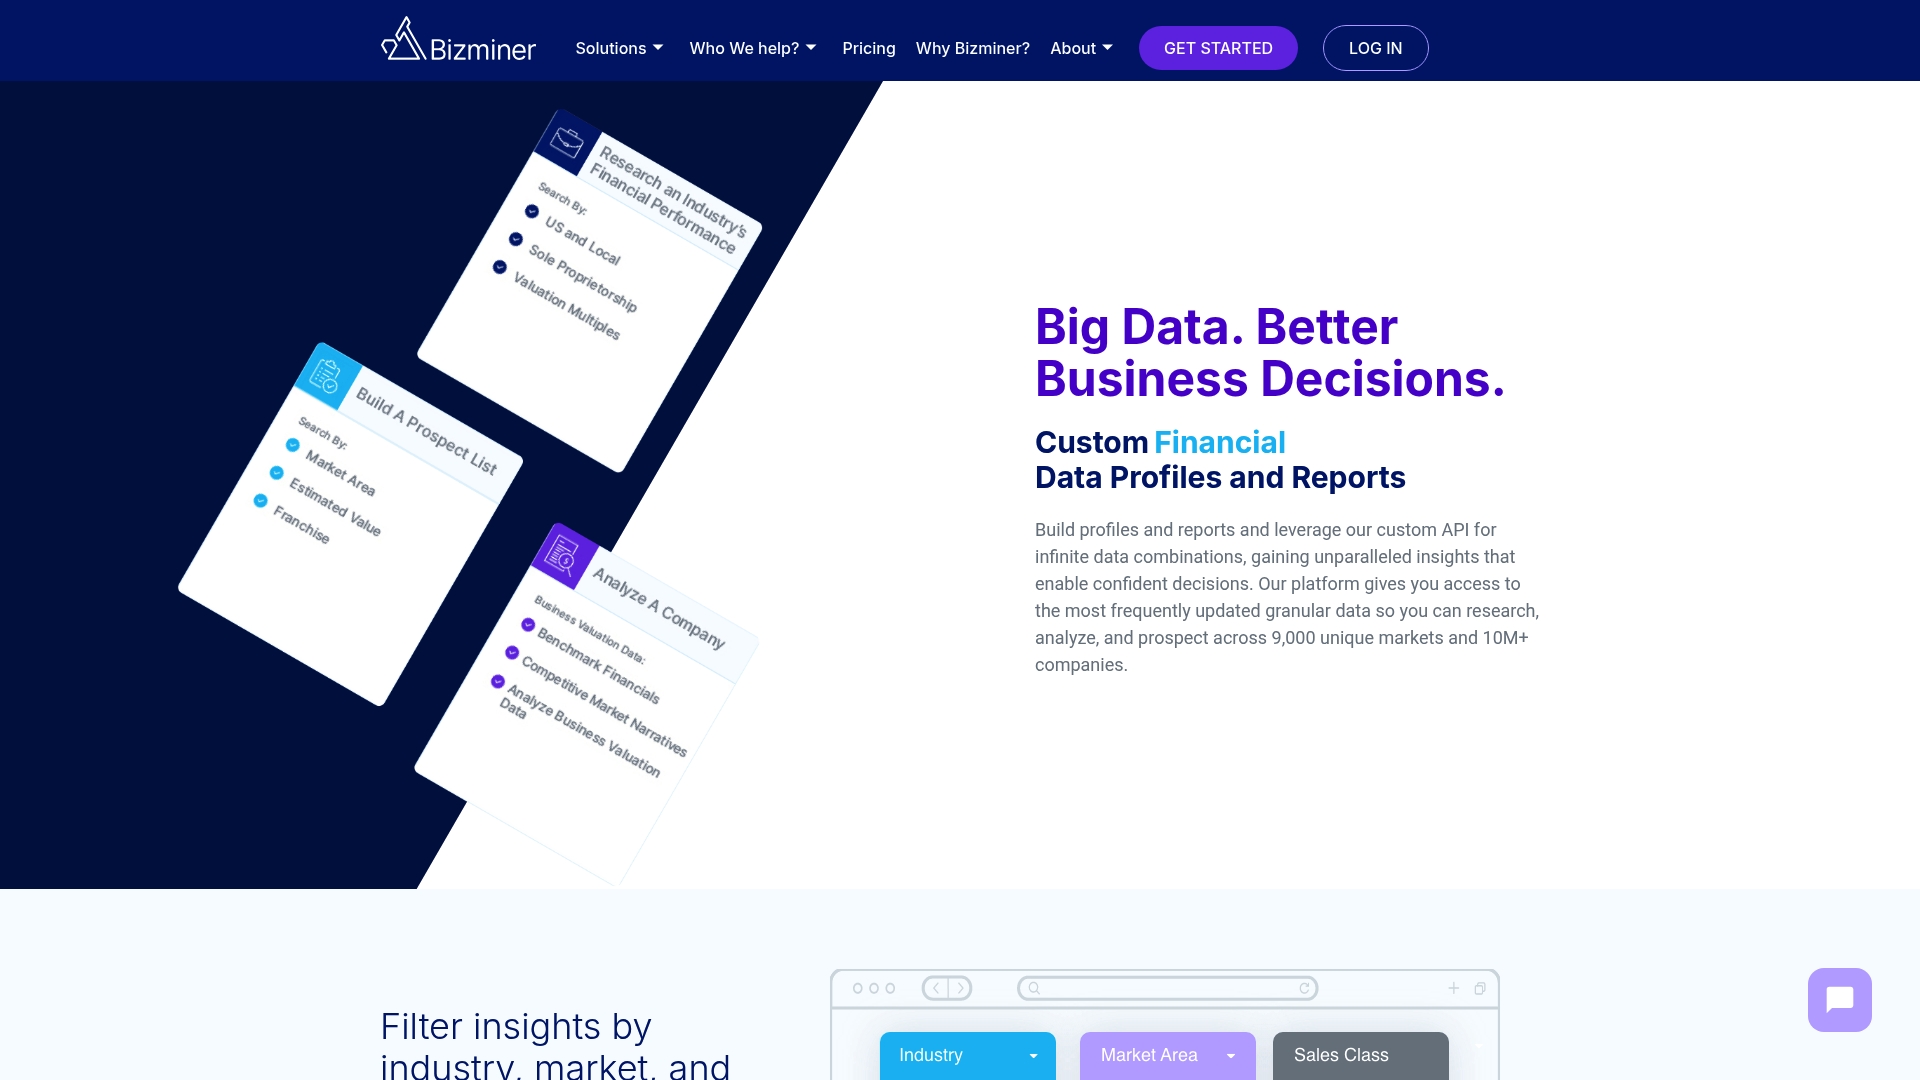
When you order a report, you can request NAICS-specific filtering, county or metro-level New York detail, CSV or API delivery, and percentile breakdowns alongside sample rows so the methodology is transparent to a client or a loan committee. For deeper ratio background before you order, the financial ratios glossary walks through each formula and how it’s typically interpreted.
Start by pulling a New York industry and market report filtered to your client’s exact NAICS code and size band, then layer in trend years once you see how the peer group looks.
Sources
- The case for granularity | Baker Tilly
- Financial ratio analysis: a complete guide to liquidity, profitability, leverage & market ratios | Ryan O’Connell, CFA
FAQ
What Does “Industry Data New York” Actually Include?
It refers to New York–filtered industry financial benchmarks and company-level reports, covering revenue, margins, ratios, and valuation multiples, not general labor or employment statistics.
Which NAICS Precision Level Should I Request?
Request six-digit NAICS codes whenever available; three- or four-digit codes group unrelated business types together and weaken the comparison.
How Many Years of Data Should a Benchmark Report Cover?
Most practitioners pull three to five years to separate a genuine trend from a single anomalous year.
Is Bizminer’s Data Accepted for Legal or Lending Purposes?
Bizminer data has been accepted in U.S. Tax Court and is used by government agencies, which supports its use in underwriting files and valuation reports that need to withstand scrutiny.
Should I Rely on Industry Averages or Percentiles?
Percentiles and medians reveal risk distribution across a peer group; a single average can mask wide variation and lead to a misleading comparison.