New business applications remain elevated well past the 2025 surge, but projected employer formations are only inching upward. That gap is the single most important thing to understand about the U.S. startup pipeline right now. For July 2026, seasonally adjusted Business Applications hit 578,926, up 8.1% from June.
That divergence tells you something the headline number alone hides: intent to start a business is running far ahead of confirmed payroll growth. The Richmond Fed’s analysis of industry composition and Bizminer’s granular market data both help explain why, and how to forecast what comes next.
The numbers that matter this cycle:
- Total business applications: 578,926 (July 2026, seasonally adjusted, +8.1% month over month)
- Projected employer formations within four quarters: 29,959 (+0.7% month over month)
- The gap between these two figures is the story: application growth is outpacing projected payroll formation by a wide margin
That imbalance sets the agenda for everything below: what the series actually measure, how industry mix shapes job creation, and where to find the raw data for independent verification.
Key Takeaways
Business applications are running far ahead of projected employer formations, which means the current surge signals rising entrepreneurial intent more than confirmed job creation.
| Point | Details |
|---|---|
| Applications outpace formations | July 2026 applications rose 8.1% month over month while projected formations (PBF4Q) rose only 0.7%. |
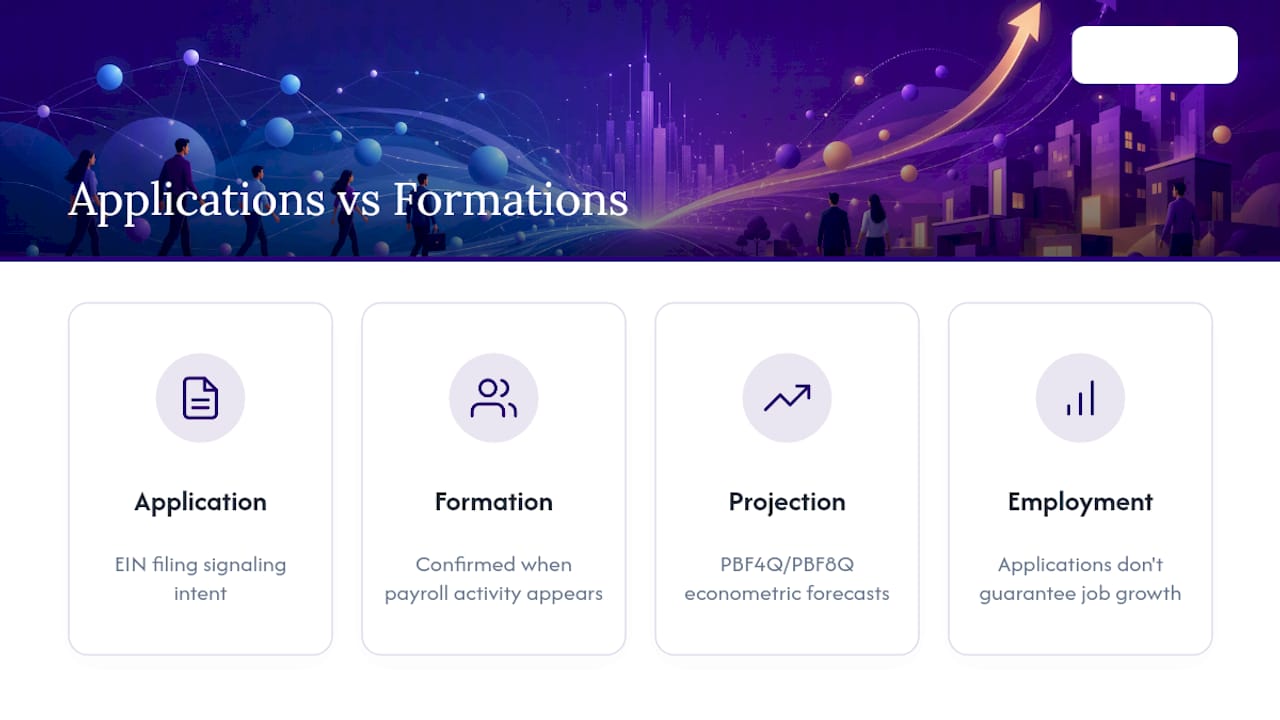
| Intent is not employment | An EIN application signals intent; only BF4Q payroll data confirms an actual employer formation. |
| Industry mix drives job creation | Retail, professional services, and construction led recent application growth and correlate with stronger historical job gains. |
| Watch planned wages and duration | The share of applications “with planned wages” and average duration (DUR4Q) are stronger near-term hiring signals than raw counts. |
| Pair public data with commercial benchmarks | Bizminer’s industry and market data helps translate national BFS projections into local revenue and survival estimates for specific NAICS segments. |
Table of Contents
- What Business Formation Statistics Actually Measure
- Recent Trends: Where the Data Stand Through Mid-2026
- How Should Researchers Interpret Application Volumes?
- Methodology Notes and Known Limitations
- Leading Indicators Worth Watching
- Where to Access the Raw Data
- What Public Data Alone Can’t Tell You
- Turning Formation Data Into a Usable Forecast
- Frequently Asked Questions
- Sources
What Business Formation Statistics Actually Measure
The Census Bureau’s Business Formation Statistics (BFS) program tracks a chain of events, not a single moment. Confusing the links in that chain is the most common analytical mistake in this space.
A Business Application is filed the moment an entity requests an Employer Identification Number using IRS Form SS-4. It signals intent, nothing more. Most applications never become active payroll employers, so treating raw application counts as a jobs number overstates the near-term hiring case.
High-Propensity Business Applications narrow the pool to filings statistically more likely to become employers, based on characteristics like entity structure. Within that group, the Census Bureau also flags applications identified as corporate applications and those filed with planned wages, meaning the filer indicated an expected first-quarter payroll date.
The forward-looking metrics matter most for policy work:
- BF4Q / BF8Q: actual business formations observed four or eight quarters after an application, confirmed once the entity reports payroll
- PBF4Q / PBF8Q: projected formations within four or eight quarters, generated by an econometric model rather than observed payroll data, as documented in the BFS release
- DUR4Q / DUR8Q: the average duration, or delay, between application and confirmed formation
Pro Tip: Never cite an application count alone as evidence of job creation. Always pair it with PBF4Q or, once enough time has passed, the observed BF4Q figure. The gap between the two is often the more interesting story than either number by itself.
Recent Trends: Where the Data Stand Through Mid-2026
The July 2026 release put total applications at 578,926, an 8.1% jump from June, while PBF4Q rose only 0.7%. That’s a much smaller lift than the 2024 to 2025 surge produced, suggesting the boom in filings is decelerating in terms of projected payroll impact even as raw volume climbs.
Industry composition explains a lot of the disconnect. The Richmond Fed’s macro analysis finds that industries posting the sharpest application growth, retail, professional services, and construction among them, have historically correlated with stronger job creation once formations mature. That’s a meaningfully different signal than a broad, undifferentiated spike across every sector.
A few things worth tracking as this data set evolves:
- Monthly headline figures come from the Census Bureau’s standard release, with weekly application detail available for higher-frequency analysis
- Industry-level breakdowns (by NAICS sector) let you separate the retail and services surge from slower-moving sectors like manufacturing
- Geographic detail exists at the state level monthly and county level annually, useful for localized policy questions
- The Census Bureau’s June 2026 press release confirms ongoing collaboration with the Federal Reserve Board, the Atlanta Fed, the University of Maryland, and Notre Dame on refining these products
How Should Researchers Interpret Application Volumes?
Converting raw application counts into a defensible economic or policy signal takes a specific sequence of steps, not a single data pull.
- Start with the Business Applications series, but immediately pair it with PBF4Q or PBF8Q. The application count tells you about entrepreneurial intent; the projected formation series tells you what the Census model expects to actually show up on payroll.
- Break out the industry-level detail before drawing employment conclusions. A surge concentrated in professional services carries different job-creation implications than one concentrated in low-payroll retail formats, per the Richmond Fed’s industry table.
- Cross-reference with BLS establishment birth data and Bizminer’s industry financial benchmarks to sanity-check whether a given sector’s formation pace lines up with revenue and survival patterns already observed in comparable markets.
- Adjust for methodology vintage. If your time series spans a NAICS restatement or a High-Propensity/Corporate Business Application (HBA/CBA) definition change, don’t treat pre- and post-change data as strictly comparable without a note.
Pro Tip: Watch the share of applications filed “with planned wages” as a leading indicator. Bank of America’s research found this share has diverged from total application growth, a signal that a rising portion of new filers may be capital-light, digitally enabled operations rather than traditional payroll-heavy startups.
Methodology Notes and Known Limitations
No projection model is exact, and BFS is explicit about where its own numbers can mislead an unwary analyst.
PBF4Q and PBF8Q are econometric projections, not confirmed outcomes, so they carry genuine forecast error on top of ordinary non-sampling issues like misreported entity types or coding mistakes in the underlying SS-4 data. The BFS methodology page also flags two structural issues researchers routinely miss:
- Seasonal adjustment runs through X-13ARIMA-SEATS, and the annual January update can meaningfully restate several years of prior seasonally adjusted history
- NAICS vintage changes and periodic redefinitions of High-Propensity and Corporate Business Application categories can break strict year-over-year comparability
- IRS EIN Assistant system outages have, in past periods, temporarily distorted weekly application counts independent of any real economic shift
Document the release vintage and NAICS version behind every figure you cite. Skipping that step is the fastest way to publish a chart that quietly contradicts itself six months later.
Leading Indicators Worth Watching
A handful of subseries do more forecasting work than the topline application count ever will.
- High-Propensity Business Applications: filters out the applications least likely to ever become employers, giving a cleaner read on real startup intent
- Share of applications “with planned wages”: a direct signal of near-term hiring intent, and one that’s currently diverging from total applications according to Bank of America’s research
- Industry-level BA divergence: watching which sectors are pulling ahead (or falling behind) the national trend flags where job creation is likely to concentrate
- BF4Q conversion rates: the ratio of confirmed formations to prior applications, a direct measure of how much intent is actually converting
- Average duration (DUR4Q): shifts in how long it takes an application to become a confirmed formation can signal changing financing or hiring conditions
- Enterprise software spending relative to headcount growth: a widening budget-to-headcount wedge suggests more new entrants may be digitally intensive and less labor-intensive from day one
Where to Access the Raw Data
Everything above traces back to a handful of public sources, and pulling them yourself is straightforward.
- Monthly tables, the full PDF release, and weekly application microdata are all posted on the Census Bureau’s BFS current data page
- FRED mirrors the core BFS time series for anyone who prefers a standard time-series API over raw Census files
- Always record the seasonal adjustment flag, NAICS vintage, and the date of the most recent annual update before archiving a pull
- Prefer CSV downloads from Census for tabular work and FRED for charting; keep versioned snapshots so a later revision doesn’t silently change your historical baseline
What Public Data Alone Can’t Tell You
Census BFS answers the macro question well: how many people are filing to start a business, and roughly how many are likely to become employers. It can’t tell you whether a specific formation surge in, say, home health services in a mid-sized county is likely to produce a viable, revenue-generating business or a wave of quick closures.

That’s where granular commercial data earns its place alongside the public series. Bizminer’s industry and market research covers revenue benchmarks and survival patterns across more than 9,000 markets, segmented tightly enough to cross-walk against a NAICS code and a specific geography. Pairing a PBF4Q projection with actual establishment-level financial benchmarks turns a national forecast into a defensible local one, which is exactly the kind of analysis that has held up to scrutiny in U.S. Tax Court.
Turning Formation Data Into a Usable Forecast
Census BFS tells you how many businesses are being started. It doesn’t tell you how big they’ll get, how long they’ll survive, or what their competitors already look like in a given market, and that’s the gap most policy and advisory work actually needs closed.

Bizminer fills that gap with financial benchmarks, market profiles, and survival data built for the exact task of translating a formation projection into a plausible revenue or hiring scenario. An analyst working with a PBF4Q figure for, say, professional services in a mid-sized metro can pull Bizminer’s industry-level benchmarks to estimate typical first-year revenue, staffing ratios, and failure risk for that specific NAICS segment, something the national BFS series was never designed to provide on its own. Advisors use the same data to move clients from “should I start this business” to a grounded financial plan, and business advisors rely on it for exactly that reason. If your next report needs to go beyond a national application count, start with a custom industry report built around the specific market you’re forecasting.
Frequently Asked Questions
What is the difference between business applications and business formations?
A business application is an EIN filing that signals intent to start a business. A business formation is confirmed only once that entity reports payroll activity, which is what the BF4Q and BF8Q series measure.
Why are business applications rising faster than projected formations in 2026?
Industry composition and founder demographics both play a role. A rising share of applications comes from digitally enabled, capital-light ventures that may never generate payroll, which widens the gap between raw filing counts and projected employer formations.
Where can I find historical new business formation trends going back further than 2023?
The Census Bureau’s BFS series extends back to July 2004 and is fully downloadable, with FRED offering a parallel time-series mirror for charting and analysis.
How reliable are projected business formation figures?
PBF4Q and PBF8Q are econometric projections, not confirmed outcomes, so they carry model error on top of standard reporting inaccuracies. Treat them as a forward estimate, not a fact, until the corresponding BF4Q figure is later observed.
Do rising business applications guarantee job growth?
No. Application volume reflects intent, and the industry mix behind that volume matters more than the topline number. A surge concentrated in low-payroll sectors produces a different employment outlook than one concentrated in professional or construction services.
Sources
- Business Formation Statistics — Current monthly data and releases
- Application Accepted: Business formation boom continues — Richmond Fed
- A new generation of business formation — Bank of America Institute