Small business benchmarks are standardized financial and operational ratios that let you measure your company’s performance against similar firms in your industry, size band, and region. The fastest way to get relevant U.S. numbers today: pull your 6-digit NAICS code, pick a revenue band, and compare against one of these authoritative sources.
- RMA Annual Statement Studies — lender-grade percentile ratios across hundreds of industries; the standard bankers use when evaluating your loan application
- BizStats — free industry financial profiles with quick ratio snapshots, useful for a first-pass check
- SBA Office of Advocacy — small-business-specific size standards and economic profiles by sector
- FRED (Federal Reserve Economic Data) — macro context for interest rates, sector credit conditions, and flow-of-funds data
- Bizminer — granular NAICS-segmented reports across 9,000+ markets with revenue band filtering, custom reports, and API access
Once you have a source, the workflow is simple: find your NAICS, filter to your revenue band, pull your last 12 months of financials, calculate your ratios, and compare against the median and top quartile.
Table of Contents
- What types of small business benchmarks should you use?
- Key benchmark ratios, how to calculate them, and what healthy looks like
- How to compare your business to industry benchmarks right now
- What being outside a benchmark range usually tells you
- How to turn benchmark gaps into a 90-day improvement plan
- Why Bizminer stands out for U.S. small business benchmark data
- Key Takeaways
- The part most owners skip
- Bizminer gives you the granular benchmarks your business actually needs
- Authoritative U.S. sources for business benchmarking
What types of small business benchmarks should you use?
Not every benchmark category fits every business decision. The three primary types are financial ratios, operational metrics, and productivity measures, and each answers a different question.
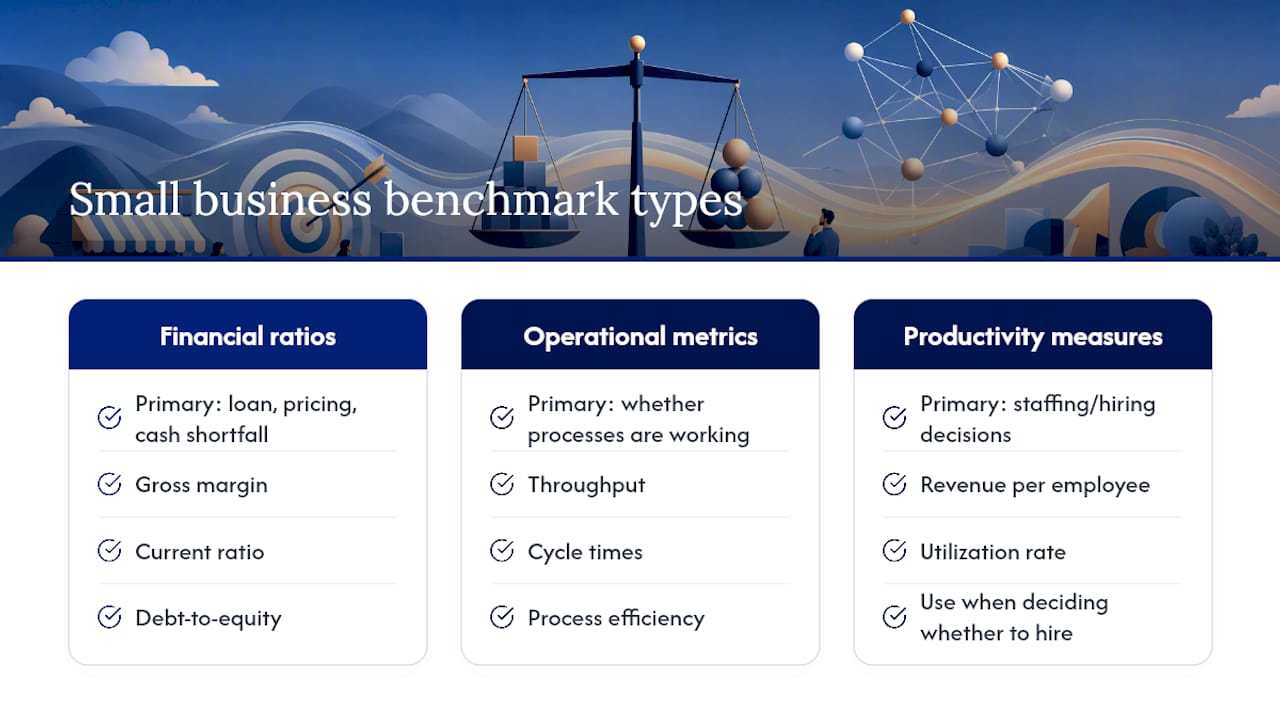
Financial ratios (gross margin, current ratio, debt-to-equity) are the right tool when you are preparing a loan package, reviewing pricing, or diagnosing a cash shortfall. Bankers evaluating creditworthiness focus on gross profit margin, operating margin, current ratio, days outstanding, and debt-to-equity. If you are heading into a credit conversation, these five are non-optional.
Operational metrics cover throughput, cycle times, and process efficiency. A restaurant owner tracks prime cost (food plus labor as a percentage of revenue) above almost anything else. A contractor watches job-cost variance and days-to-close. These metrics tell you whether your processes are working, not just whether your books look clean.
Productivity measures answer the staffing question. Revenue per employee is the headline figure for professional services firms, law offices, and consulting shops. Utilization rate matters for any business billing by the hour. When you are deciding whether to hire, these ratios give you a defensible threshold.
A quick rule of thumb: use financial ratios for lender and investor conversations, operational metrics for day-to-day management, and productivity measures when headcount decisions are on the table.
Key benchmark ratios, how to calculate them, and what healthy looks like
The table below covers the core small business financial ratios you should track, with formulas and illustrative healthy ranges by sector. Ranges are drawn from RMA, Crestmont Capital, and CurrentCFO guidance and are labeled as illustrative because the right number for your firm depends on your specific NAICS and revenue band.
| Ratio | Formula | Retail (illustrative) | Restaurants (illustrative) | Professional Services (illustrative) |
|---|---|---|---|---|
| Gross Margin | (Revenue − COGS) ÷ Revenue | 25% | 60% | 55–75% |
| Net Profit Margin | Net Income ÷ Revenue | 2–6% | 3–9% | 10–20% |
| Current Ratio | Current Assets ÷ Current Liabilities | 1.2–1.5 | 1.0–1.2 | 1.5–2.0 |
| Quick Ratio | (Cash + Receivables) ÷ Current Liabilities | 0.8–1.0 | 0.4–0.6 | 1.0 |
| Inventory Turnover | COGS ÷ Average Inventory | 6–12× | 20× | N/A |
| Revenue per Employee | Revenue ÷ FTE Headcount | typical ranges vary widely by sector and size | typical ranges vary widely by sector and size | typical ranges vary widely by sector and size |
| Debt-to-Equity | Total Debt ÷ Shareholders’ Equity | 1.0 | 2.0–3.0 | 0.8–1.2 |
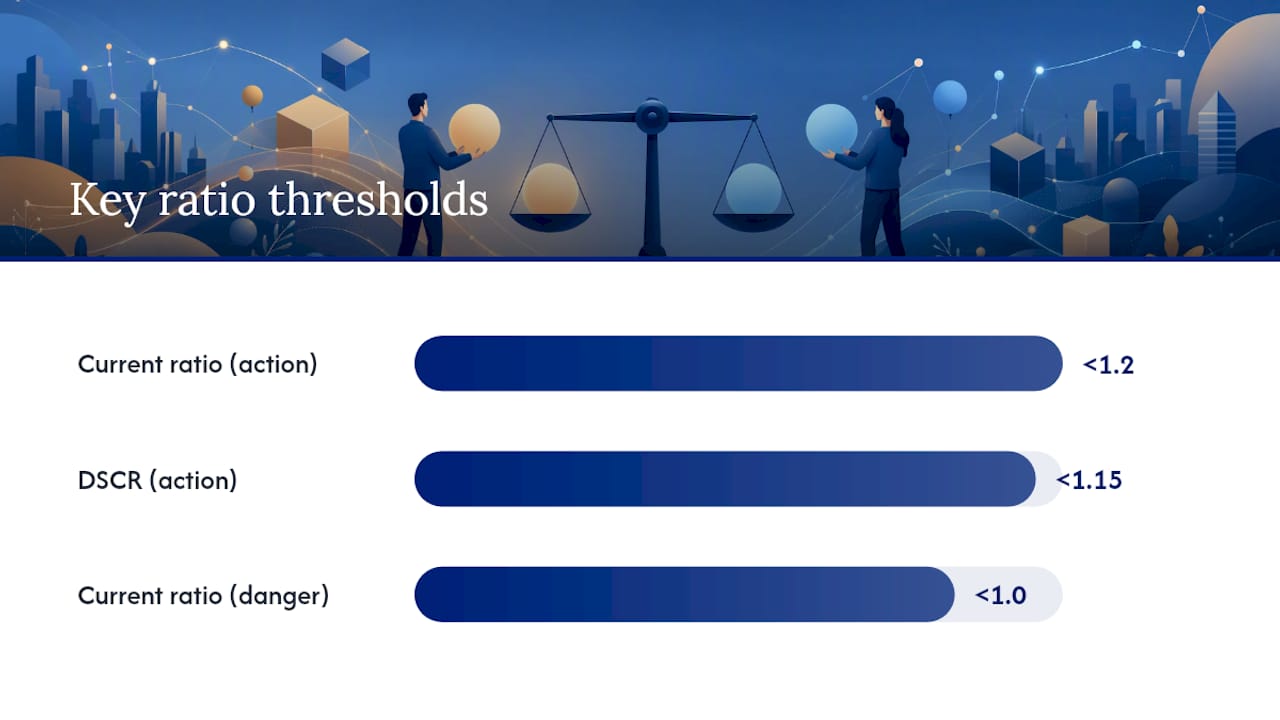
| DSCR | Net Operating Income ÷ Total Debt Service | below 1.15 is a lender red flag | below 1.15 is a lender red flag | preferred threshold varies by lender and sector |
Benchmark signal: A DSCR below 1.15 is a common lender red flag — it signals that operating income may not reliably cover debt payments. Restaurants and construction firms tend to run the tightest DSCR margins of any sector.
For service businesses, a gross margin target around 60% is a reasonable starting threshold, though the right number shifts with your pricing model and labor intensity.
Pro Tip: Run gross margin and cash conversion cycle (CCC) first. Gross margin tells you whether your pricing and cost structure are sound; CCC tells you how fast cash moves through the business. Together, they surface the two most common small-business problems in under 15 minutes.
How to compare your business to industry benchmarks right now
A structured workflow keeps this from becoming a two-hour rabbit hole. Follow these steps and you will have a usable comparison in under an hour.
- Find your 6-digit NAICS code. Use the Bizminer industry search tool or the U.S. Census Bureau NAICS lookup. The 6-digit code is specific enough to matter; a 2-digit code groups you with firms that share almost nothing with your business.
- Select your revenue band — Most data sources segment by annual revenue ($0–$1M, $1M–$5M, $5M–$10M, etc.). Pick the band that matches your trailing 12-month revenue.
- Build a three-column comparison. Column one: your numbers. Column two: industry median. Column three: top quartile (75th percentile). This three-column format immediately shows where you stand and how far the gap is to best-in-class.
Data sources and what each is best for:
What being outside a benchmark range usually tells you
An out-of-range ratio is a symptom, not a diagnosis. The table below maps common signals to likely root causes.
Low gross margin usually points to one of three things: pricing is too low, COGS is too high, or your product mix has shifted toward lower-margin items. Start with a line-item COGS review before touching prices.
Low current ratio (below 1.0) means short-term liabilities are outpacing short-term assets. The immediate fix is tightening receivables terms and, if possible, extending payables. A current ratio below 1.0 in a restaurant is less alarming than in a manufacturing firm because restaurants collect cash daily, but it still warrants attention.
High debt-to-equity signals that the business is heavily creditor-financed. This is not automatically bad, but it limits future borrowing capacity and makes the business vulnerable to rate increases. Eight core ratios across industries show that restaurants and construction firms carry the highest debt-to-equity exposure and face the most stress when interest rates rise.
Low revenue per employee in a professional services firm often means either underpricing or overstaffing relative to current revenue. Run a utilization check before assuming headcount is the problem.
Pro Tip: Before acting on any out-of-range result, check two things: your business lifecycle stage and regional seasonality. A startup in year two will have a weaker current ratio than a mature firm in the same NAICS. A retail shop in January looks nothing like the same shop in December. Adjust your interpretation before you adjust your operations.
Immediate corrective actions by signal:
- Gross margin below range: audit top-five COGS line items; run a pricing sensitivity analysis
- Current ratio below 1.2: accelerate receivables collection; negotiate extended payables with key vendors
- DSCR below 1.15: model debt refinancing options; identify discretionary expenses that can be deferred
- Inventory turnover below range: identify slow-moving SKUs; consider a clearance cycle before reordering
How to turn benchmark gaps into a 90-day improvement plan
A benchmark gap without a plan is just a number. Here is how to close the gap.
- Pick one or two priority metrics. The ratio farthest below the industry median gets the most attention. Trying to fix five ratios at once produces mediocre results across the board.
- Set a measurable target. “Improve gross margin from 38% to 42% within 90 days” is a plan. “Improve gross margin” is a wish.
- Assign an owner. Every metric needs a single person responsible for the weekly number. Shared ownership means no ownership.
- Schedule weekly check-ins. A 15-minute weekly review of the two priority metrics catches drift early. Monthly reviews are too slow when you are trying to move a number in 90 days.
- Re-benchmark at day 90. Pull fresh ratios, rebuild your three-column comparison, and measure the gap change. If the gap closed, hold the gain and pick the next priority. If it did not, diagnose why before changing tactics.
Weekly vs. monthly tracking:
- Weekly: cash balance, receivables aging, daily/weekly revenue vs. prior period, prime cost (restaurants)
- Monthly: gross margin, current ratio, payroll as a percentage of revenue, inventory turnover
- Quarterly: full ratio suite against NAICS benchmarks, DSCR, debt-to-equity, revenue per employee
The five-metric diagnostic framework covering gross margin, CCC, working capital ratio, revenue per employee, and debt-to-equity gives you a complete picture of profitability, liquidity, efficiency, and solvency in a single pass.
Why Bizminer stands out for U.S. small business benchmark data
Most free sources give you a national average. Bizminer gives you the number for your specific industry, your revenue band, and your market. That distinction matters when you are preparing a loan package or advising a client.
What Bizminer offers:
- NAICS-segmented industry financial benchmarks across 9,000+ markets, filterable by revenue band and geography
- Custom report generation and API data feeds for advisors and institutions who need repeatable, branded output
- Faster analysis and deeper segmentation than free sources, with repeatable reporting workflows built for advisory practices
Trust signals that matter:
Use cases where Bizminer fits best:
Accountants and business advisors can build entire benchmarking service lines around Bizminer’s custom reports, turning what used to be a manual research task into a repeatable, revenue-generating workflow.
Key Takeaways
Industry-specific U.S. small business benchmarks, filtered by 6-digit NAICS and revenue band, give you the most reliable baseline for diagnosing performance gaps and building a credible improvement plan.
| Point | Details |
|---|---|
| Start with two ratios | Run gross margin and cash conversion cycle first for a 15-minute diagnostic of your core financial health. |
| Use NAICS + revenue band | A 6-digit NAICS code paired with your revenue band produces the fairest peer comparison; national averages mislead. |
| DSCR threshold to know | A DSCR below 1.15 is a common lender red flag; restaurants and construction firms face the tightest margins here. |
| Re-benchmark quarterly | Trend direction over four quarters reveals whether gaps are closing; a single snapshot rarely tells the full story. |
| Bizminer for granular data | Bizminer’s NAICS-segmented reports across 9,000+ markets, accepted in U.S. Tax Court, give advisors and owners lender-grade benchmarks with revenue band filtering. |
The part most owners skip
Most small business owners who try benchmarking make the same mistake: they compare their numbers to a national industry average, find they are “close enough,” and move on. That is the wrong comparison. A national average blends a $200K sole proprietorship with a $9M regional operation in the same NAICS code. The resulting median is accurate for neither.
The owners who actually move their numbers do two things differently. First, they filter to their revenue band before they look at any ratio. Second, they track the direction of each ratio over four quarters rather than treating a single comparison as a verdict. A gross margin that was 34% a year ago and is 38% today is a business that is improving, even if 38% still sits below the industry median. The trend is the signal.
There is also a timing trap worth naming. Advisors who work with restaurants and retailers regularly see owners benchmark in January or February, see a weak current ratio, and panic. The same business benchmarked in October, after the holiday inventory build, looks completely different. Seasonality is not a footnote; it is a core part of interpreting any ratio correctly.
The practical rule: never make a structural business decision based on a single benchmark comparison. Run the comparison, note the direction, adjust for your lifecycle stage and season, and then decide whether the gap is a real problem or a temporary condition. That sequence takes an extra 20 minutes and saves a lot of bad decisions.
Bizminer gives you the granular benchmarks your business actually needs
Generic industry averages are free for a reason. They blend thousands of firms across revenue sizes, geographies, and business models into a single number that fits almost no one precisely. Bizminer’s approach is different: every report is filtered to your specific NAICS code, your revenue band, and your market, producing the kind of peer comparison a lender or advisor will actually trust.

For small business owners preparing a loan package, advisors building a benchmarking practice, or managers who need to show an investor where the business stands, Bizminer’s industry and market research reports cover 9,000+ markets with the granularity that free sources cannot match. The data is accepted in U.S. Tax Court and used by government agencies, which means it holds up under scrutiny.
Pull a sample report for your NAICS to see exactly what your peer comparison looks like before committing to a subscription.
Authoritative U.S. sources for business benchmarking
- SMB Financial Health Diagnostic: Compare Your Metrics to Industry Peers — Small Business | CurrentCFO
- SMB Financial Benchmarks 2026: 8 Ratios That Predict Business Distress vs. Growth
- RMA Annual Statement Studies
- Industry Financial Ratio Benchmarking for Small Businesses 101: Tips for Business Owners and Bankers | RMA Blog
- Financial Health Benchmarks by Industry: Complete 2026 Data Guide for Small Business Owners
- Financial Benchmarking: How to Compare Your Business Performance to Industry Standards | Beancount.io
- What is Financial Benchmarking? | Bizminer
- 5 Benefits of Financial Benchmarking Software | Bizminer
A note on data vintage: free sources often lag by 12–24 months. When you are making a current-year lending or pricing decision, prefer sources that update quarterly or publish recent-year data explicitly. Always note the reporting period of any benchmark you cite in a loan package or client report.