
A market risk analysis, in the sense that matters to lenders and advisors, means measuring industry- and company-level exposure: demand shifts, margin compression, customer concentration, and cash-flow strain, then weighing that exposure against defensible benchmarks. The deliverable isn’t a narrative. It’s three concrete outputs:
- A risk inventory that categorizes threats as market-wide or firm-specific
- A benchmarked financial profile comparing the company against its NAICS peers
- One to three stress-test scenarios showing what happens to cash flow under pressure
Two things make this defensible rather than anecdotal. First, RMA Statement Studies and SBA default-rate data give you industry norms that a credit committee can’t wave away. Second, Bizminer’s granular NAICS-level reports have been accepted in U.S. Tax Court, which tells you the underlying data holds up under adversarial scrutiny, not just internal review.
Key Takeaways
A defensible market risk analysis pairs a firm-specific risk inventory with industry benchmarks and at least one stress test that ties directly to loan or strategy decisions.
| Point | Details |
|---|---|
| Scope before you measure | Match analysis depth to materiality: a renewal needs less than a new approval or acquisition review. |
| Combine benchmark types | Use margin, leverage, and default-rate data together since SBA default rates range from 6.3% to 37.8% by industry. |
| Watch combined risk | A firm-specific weakness layered on a volatile sector is riskier than either factor alone. |
| Document every assumption | Record benchmark source, NAICS vintage, and sample size so auditors and examiners can trace your logic. |
| Use Bizminer for granular data | Bizminer supplies NAICS-level, court-accepted reports across 9,000+ industries for defensible underwriting files. |
Table of Contents
- Building a Market Risk Analysis Framework You Can Repeat
- Which Benchmarks Actually Hold Up Under Scrutiny
- Reading Benchmarks: Where the Red Flags Actually Hide
- Turning the Analysis Into Loan Terms and Strategic Calls
- What Ten Years of Benchmarking Client Files Teaches You
- Get Court-Tested Benchmarks Instead of Building Your Own
- Frequently Asked Questions
- Sources
Building a Market Risk Analysis Framework You Can Repeat
The workflow only works if you scope it before you dive into ratios. A five-figure line of credit renewal doesn’t need the same depth as a $2 million acquisition loan, and treating them identically wastes your time and the client’s fee.
- Scope by materiality. Decide upfront whether this is a new approval, an annual review, or a strategic engagement, then set the depth of analysis accordingly.
- Inventory and categorize risks. Split them into market risk (demand cycles, competitive pressure, input costs) and firm-specific risk (customer concentration, management depth, single-location exposure).
- Assign exposure scores. Populate margins, leverage ratios, debt service coverage, and customer concentration against peer benchmarks.
- Select mitigants and document them. Covenant structure, collateral requirements, or operational changes, tied to whatever risk scored highest.
Damodaran’s framing is useful here: risk assessment should help you find opportunity, not just avoid loss. A company scoring poorly on customer concentration but strongly on margin might still be a good credit risk with the right covenant, not an automatic decline.
Pro Tip: Keep a one-page risk-scoring template for each NAICS code you underwrite often. Reusing the same scoring logic across deals makes your files consistent, and consistency is what credit committees and examiners actually check for.
If you want a structured starting point for the scoring step, FundingOptimal’s risk-profile guide walks through a similar four-part sequence worth cross-referencing.
Which Benchmarks Actually Hold Up Under Scrutiny
Three benchmark types drive most lending and advisory decisions: profitability and margin ranges, leverage and liquidity ratios, and industry default rates. Each answers a different question, so pulling only one gives you a partial picture.
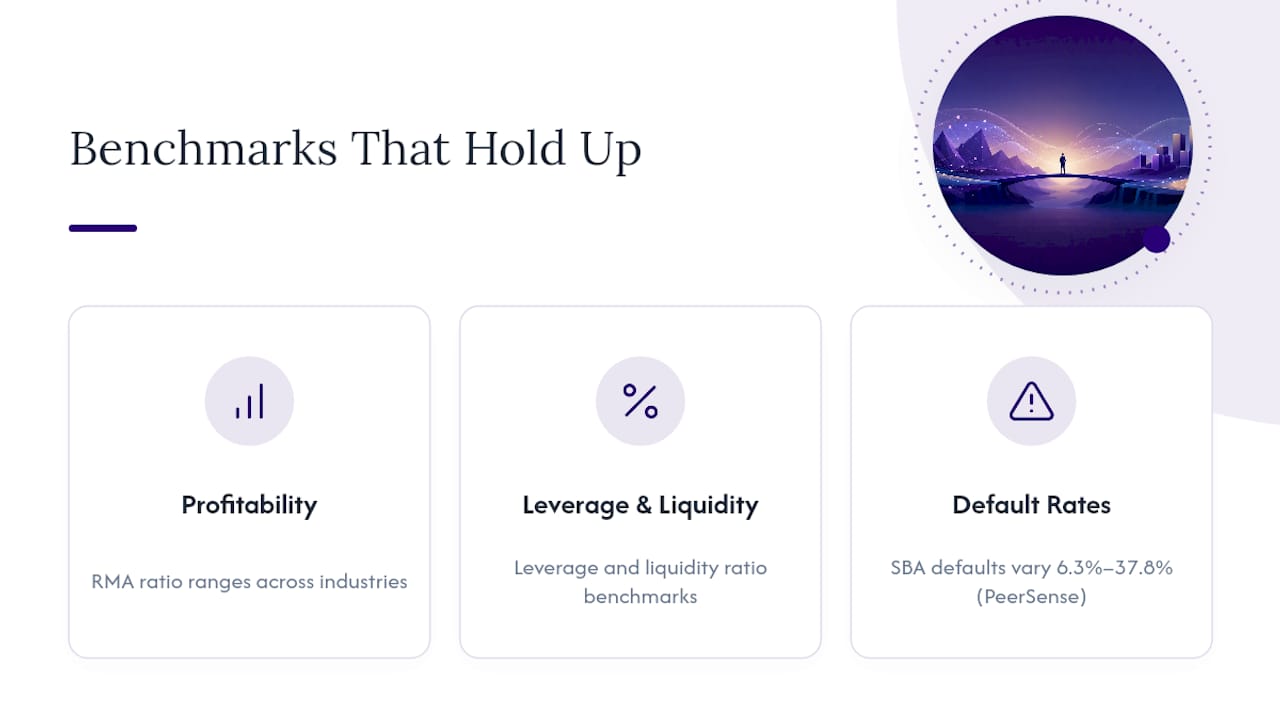
Margin and liquidity benchmarks come from RMA Statement Studies, long the standard bankers cite for comparative ratio ranges across hundreds of industries. Default-rate evidence is a different animal entirely, and it’s where a lot of advisors underinvest.
PeerSense’s analysis of SBA 7(a) and 504 outcomes found default rates ranging from roughly 6.3% for Animal Production to 37.8% for Credit Intermediation — a six-fold spread that should directly shape pricing and risk routing, not just sit in a footnote.

Lender sentiment adds a forward-looking layer benchmarks alone can’t provide. The J.S. Held Q2 2026 lending survey found finance and insurance cited as the most volatile sector by 46.31% of lenders, down sharply from 63% in Q1. That kind of shift tells you covenant tightness for a sector can loosen quarter to quarter, which static ratio tables never capture.
For small or thin NAICS codes, don’t force precision you don’t have. Widen to a broader industry bucket, document why you did it, and note the sample size limitation explicitly in your file. Bizminer’s NAICS-level reports exist specifically to solve the granularity problem most public sources can’t, since court-tested data needs a defensible chain back to its source.
Reading Benchmarks: Where the Red Flags Actually Hide
Ratios only matter once you know what triggers action. A DSCR of 1.10x isn’t automatically a decline, but it changes what you require alongside it.
Underwriting norms give you a starting point: the SBA’s SOP 50 10 8 puts minimum DSCR at 1.15x for startups, while most lenders privately hold the line closer to 1.25x and run a 10% revenue stress test against it. Interest coverage below 2x, margin gaps of more than a few points against the peer median, or receivables aging that’s stretched two consecutive quarters are the classics. None of them alone should sink a deal. Combined, they change the conversation fast.
- Revenue concentration above 25% in a single customer, especially paired with thin margins
- Leverage climbing while margins compress in the same period, a classic pre-distress pattern
- Seasonality mismatched against the loan’s repayment schedule
| Stress scenario | What it tests | Typical trigger threshold |
|---|---|---|
| 10% revenue shock | Cash-flow resilience under demand decline | DSCR falling below 1.0x |
| a moderate rate increase | Debt service capacity on variable-rate exposure | Coverage ratio drop below covenant floor |
| Supply disruption lasting a material period | Margin and liquidity buffer under cost spikes | Current ratio falling under 1.2x |
The dangerous combination isn’t one bad number. It’s a firm-specific weakness (concentration, thin management bench) layered on top of a market-wide one (a sector the J.S. Held survey flags as volatile). That’s when a routine renewal becomes a workout candidate within two quarters.
Turning the Analysis Into Loan Terms and Strategic Calls
None of this matters if it doesn’t change a decision. A risk score has to map to something concrete in the credit memo or the strategic plan, or the analysis was academic.
- Advance rates and collateral. Higher-risk sector scores should tighten advance rates on receivables and inventory, not just raise the interest rate.
- Covenant frequency. Move from annual to quarterly reporting requirements when concentration or leverage scores cross your threshold.
- Valuation multiples. Elevated sector risk (thin margins, high default rates, low barriers to entry) justifies a discount on peer multiples, not a flat haircut applied everywhere.
- Resilience versus hedging. For firms with volatile input costs but weak hedging infrastructure, operational resilience, cash buffers, flexible supplier contracts, often outperforms a financial hedge that management can’t monitor properly.
Pro Tip: When you present a covenant recommendation, attach the specific benchmark source and the peer sample size next to each ratio. Auditors and examiners increasingly ask where a number came from, not just what it says.
Documentation is the part advisors skip under deadline pressure, and it’s the part that gets challenged later. Note the benchmark source, the NAICS code and vintage, and the stress-test assumptions in every file, every time.
What Ten Years of Benchmarking Client Files Teaches You
The benchmark rarely tells you the client is fine or finished. It tells you where to ask the next question. I’ve seen a loan nearly get declined on a weak current ratio alone, until a peer comparison showed the entire subsector runs lean on inventory by design. Context changed the outcome.
Presenting this to a credit committee works best with one chart, not five. Show where the company sits against the peer median on the two or three ratios that actually drove your recommendation, and let the stress test carry the rest of the argument.
Get Court-Tested Benchmarks Instead of Building Your Own
Building a defensible peer set from scratch, digging through public filings, estimating NAICS medians by hand, eats hours you’re billing to something else. Bizminer’s market and industry research reports cover more than 9,000 industries with granular financial profiles built for exactly this kind of underwriting and advisory work.

Reports are customizable by geography and company size, available through one-off purchase or API feed for firms running volume, and backed by data that’s already been accepted in U.S. Tax Court, so you’re not the first person testing whether the source holds up. If you’re prepping a loan file or a strategic review this quarter, start by pulling a sample report for the client’s NAICS code and see how the peer ranges compare to what you’ve been estimating manually.
Frequently Asked Questions
What’s the difference between market risk analysis and financial-market risk analysis?
Market risk analysis in this context evaluates industry- and company-level exposure, demand, margins, concentration, and cash flow, for lending, valuation, and strategy decisions. It’s distinct from quantitative finance methods like VaR that measure losses from price or rate movements in securities markets.
How granular should my benchmark data be?
As granular as your sample size allows. A six-digit NAICS code with hundreds of reporting firms gives tighter ranges than a broad three-digit sector bucket. When the sample thins out, widen the bucket and note why in your file.
What DSCR threshold should trigger a covenant change?
Most lenders treat 1.25x as a comfortable standard, with 1.15x as the SBA’s startup minimum. Anything below that, especially after a 10% revenue stress test, usually warrants tighter reporting or additional collateral.
How often should I update a market risk analysis?
Annually for a stable client, quarterly for anyone flagged as elevated risk or operating in a sector the J.S. Held survey marks as volatile. Update immediately after a material event: a major customer loss, a rate change, or a supply disruption.
Can benchmark data alone justify a loan decline?
No single ratio should. Benchmarks flag where to dig deeper. A weak ratio paired with strong peer context, or a mitigant like collateral or personal guarantees, can offset what looks alarming in isolation.
Sources
- J.S. HELD LENDING SURVEY
- What to Consider in Your Industry Analysis
- Safest and Riskiest Industries for SBA Loans 2026 | PeerSense Research
- Strategic risk (Aswath Damodaran)