Start with the free public sources: IPEDS for completions and enrollment trends, BLS/OES for occupational employment projections, and job-postings data for real-time skills demand. Layer in commercial datasets like Bizminer’s industry benchmarks only where public sources lack the granularity your program decision needs. Market data for academia works best as one input among several, not a replacement for faculty judgment and institutional review. The resource map below shows exactly which source fits which question.
TL;DR:
- Public datasets like IPEDS and BLS/OES provide foundational trends on program enrollment, completions, and regional labor demand for academic decision-making.
- Job-postings data offers real-time insights into current employer skill demands but should be used cautiously due to coverage biases and overrepresentation of certain industries.
- Commercial sources such as Bizminer add detailed industry and financial benchmarks mainly when public data lacks sufficient granularity for specific regional or company-level analysis.
- Embedding regular, structured market data reviews into governance processes ensures decisions remain strategic and avoid reliance on outdated or anecdotal evidence.
- Always verify data licensing and vendor transparency through pilot testing, metadata checks, and early legal and library involvement to prevent costly restrictions or black-box issues.
Table of Contents
- What Market Data Sources Should Academic Researchers Use First?
- How Do Institutions Use Market Data to Validate and Grow Programs?
- How Do You Conduct Market Research for a New Academic Program?
- What Should Academic Buyers Watch for in Data Licensing and Procurement?
- How Do You Evaluate Data Quality and Vendor Transparency?
- How Does Bizminer Support Academic Market Research and Program Decisions?
- An Honest Take on the Limits of Market Data in Academic Decisions
- How Bizminer Can Help With Academic Market Research
- Sources
- FAQ
What Market Data Sources Should Academic Researchers Use First?
Different questions call for different datasets, and picking the wrong one wastes months. A dean asking “should we cut this program?” needs different evidence than a curriculum committee asking “which skills belong in this course?”
Public datasets form the foundation, and each one answers a specific question.
- IPEDS tracks enrollment, completions, and institutional characteristics across nearly every degree-granting institution in the country, making it the standard tool for competitor benchmarking and gauging whether a program category is growing or shrinking nationally.
- NCES (the parent agency behind IPEDS) also publishes broader education statistics, including graduation rates, financial aid patterns, and survey-based data on student outcomes that IPEDS alone doesn’t capture.
- BLS/OES (Occupational Employment and Wage Statistics) covers employment levels and wages across more than 800 occupations, updated annually, and answers the question “is there a job market for graduates of this program?”
- American Community Survey (ACS) data from the Census Bureau adds population and demographic context, useful for understanding whether your regional labor pool matches program capacity.
Job-postings data fills a gap none of the above can close: timeliness. IPEDS and OES report on a lag of a year or more, while postings data from services that scrape employer listings can show skills demand shifting within weeks. A practitioner guide from Lightcast recommends pairing completions data for competitor analysis with labor-market data for viability checks and job-postings data specifically for curriculum and skill mapping. The limitation is coverage bias. Postings data overrepresents industries that post openly online and underrepresents government, small-business, and referral-based hiring, so treat postings volume as a leading indicator, not a census.
Commercial datasets earn their cost when public data runs out of granularity. Financial benchmarks (like the kind Bizminer produces for over 9,000 industry segments) let researchers compare a program’s target industry against real company-level performance data rather than national averages. Company-level datasets, people/contact data, and specialized archives such as WRDS-hosted financial and market databases round out the category, though a study of commercial data usage in business research found these sources appear in only a minority of published papers, with two or three dominant datasets (Compustat, CRSP) accounting for most of that use, and libraries facilitating access in nearly every case where commercial data shows up.
Here’s the quick version for readers who just want a starting point:
- If you need national program growth trends: start with IPEDS.
- If you need to know whether jobs exist for your graduates: start with BLS/OES.
- If you need current skills demanded by employers this quarter: start with job-postings data.
- If you need financial or competitive benchmarking at the industry or company level: consider a commercial source like Bizminer’s industry and market research profiles.
- If you need regional population and demographic context: pull ACS tables from the Census Bureau.
No single source answers every question a curriculum committee will ask. The skill is knowing which combination to reach for.
How Do Institutions Use Market Data to Validate and Grow Programs?
Most institutions that use market data well follow a three-step cycle: discovery, quantitative labor-demand analysis, and iterative alignment. IPEDS-based competitor benchmarking combined with occupational data from OES is common practice for validating whether a proposed program has both academic peer precedent and job-market pull.
- Discovery. A department or market-intelligence office scans for signals: declining enrollment in an adjacent program, rising employer inquiries, or a spike in job postings mentioning skills the current curriculum doesn’t teach. CU Denver’s market intelligence framework describes this stage as pulling together student demand signals, competitor program counts, and employer demand data before anyone commits to a formal proposal.
- Quantitative labor-demand and competitor analysis. This is where IPEDS completions data meets OES occupational projections and job-postings skills extraction. The goal is a defensible number: how many regional employers are hiring for this occupation, what wages they’re offering, and how many competing institutions already grant a comparable credential.
- Iterative alignment. Findings go back to faculty and curriculum committees for review, get revised against academic mission and accreditation constraints, and cycle through governance approval. This step is where data-driven recommendations either survive contact with institutional reality or are shelved.
Programs worth prioritizing tend to show up in the numbers before anyone notices them anecdotally. Track completions trends over several years, job-posting growth rate for the target occupation, median regional salaries, and the overlap between current curriculum skills and skills employers list in postings. Discrepancies between these indicators should prompt further investigation before drawing conclusions.
West Virginia University offers a useful example of institutional practice: WVU has built labor-market data directly into its curriculum proposal process, treating it as a required input alongside enrollment history and faculty recommendations rather than as a standalone justification. CU Denver’s market intelligence office runs a similar model, generating reports that feed program review cycles instead of sitting in a drawer after a single presentation.
Pro Tip: Build a standing data review into your curriculum committee’s calendar (quarterly works for most departments) instead of pulling data only when a program is already in crisis. Programs that get data reviews only during a budget scare tend to produce reactive decisions instead of strategic ones.
Embedding data into governance means giving someone ownership of refreshing it. If the market-intelligence report a committee reviewed two years ago never gets updated, the “data-driven” decision becomes just as stale as the anecdote it replaced. Assign a librarian, institutional researcher, or program coordinator to own the refresh cycle, and put that responsibility in writing during the next governance review.
How Do You Conduct Market Research for a New Academic Program?
A defensible market research process for a new or existing program follows a structured sequence: define the decision context, pull and triangulate quantitative data, validate through multiple sources, and document everything for reproducibility. Academic market research methodology generally requires defining a clear research purpose, selecting the right respondent groups or datasets, choosing a methodology, and managing data quality throughout fieldwork.
- Define the decision context and map CIP codes to occupations. Before touching a dataset, write down exactly what decision this research supports (launch, sunset, redesign, or resource reallocation) and translate your program’s Classification of Instructional Programs (CIP) code into the Standard Occupational Classification (SOC) codes it feeds. The Department of Education’s CIP-SOC crosswalk makes this mapping straightforward, and skipping it is the single most common reason program market studies produce mismatched, unusable comparisons.
- Combine completions and enrollment data with occupational trends. Pull IPEDS completions for your program’s CIP code and nearby competitor CIP codes over a five-year window. Cross-reference against BLS/OES employment projections for the mapped SOC codes, then layer in job-postings skills extraction to see which specific competencies employers are asking for right now.
- Extract, clean, and triangulate. Raw exports from any of these sources need cleaning: normalize geographic units (metro area versus state versus national), reconcile occupation code versions across years (SOC codes get revised periodically), and flag any gaps where a small regional labor market suppresses data for privacy reasons. Triangulate findings across at least two independent sources before drawing a conclusion. If IPEDS shows declining completions but OES shows rising regional wages for the associated occupation, that discrepancy is worth investigating before it goes into a report, not smoothing over.
- Interpret margins of error honestly. Regional occupational estimates, especially in smaller metro areas, often carry wide confidence intervals. Treat a single year’s wage figure for a niche occupation in a mid-size metro as a range, not a precise number, and say so in your report.
- Document metadata, exports, and permissions for reproducibility. Record the exact vintage of every dataset pulled (IPEDS release year, OES reference period, job-postings extraction date), note any licensing restrictions on redistributing the raw data, and keep export files in a shared, access-controlled location. A market research report that can’t be reproduced by the next analyst who inherits the file isn’t worth much to a governance committee two years from now.
Researchers who skip step one (defining the decision context first) tend to produce technically sound reports that answer the wrong question. Get institutional agreement on what decision the data needs to support before pulling a single export.
What Should Academic Buyers Watch for in Data Licensing and Procurement?
The single most expensive mistake in academic data procurement is discovering a publication restriction after the analysis is already done. Commercial data licenses for academic use often carry corporate B2B terms by default, and those terms frequently restrict publication rights or campus-wide sharing unless a library or procurement office negotiates academic-specific language up front.
Watch for these clauses before signing anything:
- Publication rights. Can findings derived from this dataset appear in a thesis, journal article, or public-facing report, or only in internal memos?
- User caps. Is the license seat-based (named users only) or does it cover a department, college, or the entire campus?
- Time-of-year access limitations. Some licenses restrict student access during non-term months, which can quietly break a summer research project.
- Derivative-data rules. Can you publish aggregated statistics derived from the raw data, or does the license prohibit any output beyond internal use?
- Aggregate export caps. Some vendors cap how many records can be exported in total, which matters enormously for a longitudinal study spanning several years of data pulls.
Structuring campus access is its own decision. An enterprise license spreads cost across the whole institution and usually gets better per-seat pricing, but it requires buy-in from departments that may never touch the data. Departmental buy-in keeps cost isolated to actual users but risks duplicate purchases when two colleges license the same dataset independently. A cost-sharing consortium model, common among research libraries, splits both cost and negotiating leverage across multiple departments or even multiple institutions.
Loop in library acquisitions, legal counsel, and IT early, not after a vendor contract lands on someone’s desk for signature. Subtle restrictions like prohibitions on using licensed data for entrepreneurial or consulting projects, or caps on aggregate exports, have derailed research projects that were weeks from completion.
Pro Tip: Ask every vendor for a sample contract and a data dictionary before your library commits budget. If a vendor hesitates to share either one before signature, that hesitation tells you something about how they’ll handle support requests after you’re locked in.
How Do You Evaluate Data Quality and Vendor Transparency?
Test any commercial dataset for three problems before trusting it in a publication or a program-decision report: missing values, reporting lags, and undisclosed methodology changes. Vendors that won’t document their collection methods are handing you a black box, and a black box doesn’t hold up under peer review or a governance committee’s questions.
Run this checklist before committing budget or building an analysis around a new source:
- Metadata completeness. Does the vendor document exactly how each field was collected, when, and from what universe of respondents or filings?
- Export limits. Can you actually export enough raw or aggregated data to support the analysis you’re planning, or does the interface cap you below what publication requires?
- Method disclosure. Will the vendor explain, in writing, any changes to their collection methodology across the years covered in your dataset?
- Pilot extract testing. Request a small sample extract and compare it against a known public benchmark (IPEDS completions, OES wage data) for the same industry or occupation before buying the full dataset.
Academic researchers report genuine interest in corporate and proprietary datasets alongside real ethical concerns about transparency and publication restrictions, and that tension is worth taking seriously rather than papering over with a signed contract. Stress-testing vendor data against a pilot extract and comparing results to a public benchmark before full purchase catches most of the black-box problems before they become a peer-reviewer’s objection.
How Does Bizminer Support Academic Market Research and Program Decisions?
Bizminer builds customizable financial and industry profiles segmented by industry, geography, and company size. For a program office trying to answer “does the regional market support this credential?”, that granularity matters more than a national average ever could.
Two things separate Bizminer from a generic statistics portal. First, the data is accepted in U.S. Tax Court and used by government agencies. Second, the Market Data API supports programmatic export, which matters for reproducibility. A governance committee reviewing a program proposal next year should be able to pull the same figures the original analysis used, not a vendor’s updated snapshot that no longer matches the report on file. Bizminer’s academic institutions support resources are built specifically for this kind of campus use case, from single-department benchmarking to institution-wide licensing.
An Honest Take on the Limits of Market Data in Academic Decisions
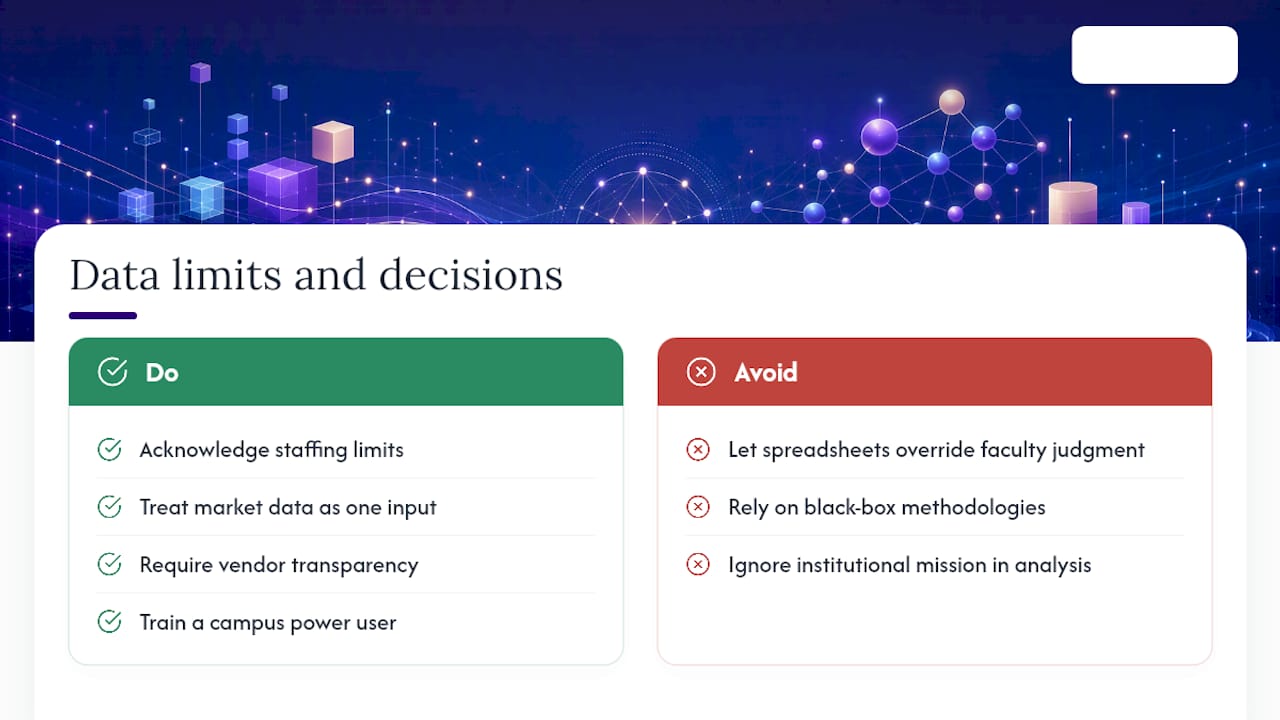
Budget and staffing constraints are the real ceiling on most institutions’ data ambitions, not lack of interest. A regional public university with limited research staffing may not be able to run as comprehensive analyses as larger research universities with dedicated market-intelligence offices, and acknowledging these differences is important for realistic expectations on program execution.
Market data is one input, never the whole decision. The temptation to let a spreadsheet override faculty judgment is real, especially when a governance meeting is running long and a clean number feels like relief. Resist it. Push vendors hard on transparency before you build a report around their numbers, because a black-box methodology you can’t explain to a curriculum committee is a liability, not an asset. And train at least one power user on campus who understands both the data and the institution’s mission well enough to catch when the two are pulling in different directions.
— Danny
How Bizminer Can Help With Academic Market Research
Bizminer gives academic teams the same granular, court-tested industry data that accountants and business advisors rely on, sized for a curriculum committee’s actual question rather than a boardroom pitch deck. Instead of stitching together national averages from a general statistics site, you get benchmarks scoped to your program’s regional market and industry code, with API access for teams that need reproducible exports across budget cycles.

If your department is evaluating a new program or defending an existing one at review time, start with Bizminer’s industry search tool to pull a benchmark for your target industry and geography, or request academic access through the academic institutions page to see what campus-wide licensing looks like for your institution.
Sources
- Integrated Postsecondary Education Data System (IPEDS) — About IPEDS
- Academic use of corporate Big Data: challenges and opportunities — PMC article
FAQ
What Is the Best Starting Dataset for Market Data for Academia?
IPEDS is the standard starting point for enrollment and completions trends, paired with BLS/OES for labor-market demand and job-postings data for current skills detail.
Is Commercial Market Data Necessary for Academic Program Decisions?
Not always. Commercial datasets like Bizminer’s industry benchmarks add value mainly when public data lacks the geographic or company-level granularity a specific decision needs.
What Should a Library Check Before Signing a Data Vendor Contract?
Check publication rights, user caps, time-of-year access limits, and derivative-data rules, and involve library acquisitions and legal counsel before signing.
How Do Institutions Combine Job-Postings Data With Public Datasets?
Institutions typically use IPEDS and BLS/OES for baseline demand and growth trends, then layer job-postings data on top to capture current, specific skill requirements employers are listing.
Can Bizminer Data Be Used in Published Academic Research?
Bizminer’s industry and financial data is accepted in U.S. Tax Court and used by government agencies, and its API supports the kind of reproducible export academic publication and governance review typically require.