Benchmarking against industry data shows you the one or two gaps most likely to limit growth, using APQC’s four-phase method and BLS data as reliable anchors, with Bizminer as one auditable data option. The immediate next step is to pick one defensible KPI and confirm it is measured the same way across your peer group before you draw any conclusions from it.
TL;DR:
- Use same industry and size peers for financial ratios; cross industry comparisons suit portable operational measures such as cycle time or defect rates.
- Free BLS and Census data may lack narrow industry and revenue bands; assess commercial sources for coverage, sample size, recency, and traceable methods.
- Document each metric’s definitions and boundaries, then compare matched industry, size, and reporting periods using per employee or percentile figures rather than raw averages.
- Treat single year anomalies as tentative; confirm gaps across three to five years, then assign each structural finding an owner and recheck date.
Table of Contents
- What industry benchmarking is and when to use it
- Types of benchmarking and which fits your goal
- Where to find reliable benchmark data
- Step-by-step benchmarking process (plan, collect, analyze, apply)
- Defining metrics, scope, and normalization
- Interpreting gaps and converting benchmarks into improvement plans
- Why auditable, granular benchmarks matter
- How Bizminer supports a defensible benchmarking project
- FAQ
- Sources
What industry benchmarking is and when to use it
Industry benchmarking compares your company’s metrics against peers in the same sector to see where you stand and whether the gap is widening or closing. Done well, it answers relative questions: are you spending more on labor than similar firms, is your margin trailing the pack, is a cost line creeping up faster than it should.
It cannot answer everything. A single year of data rarely proves causation, and detailed industry breakdowns carry real statistical noise. The Bureau of Labor Statistics notes that measures like output per hour and unit labor costs become more volatile and more prone to measurement error as you drill into narrower industry segments, so a one-year swing in a detailed category deserves skepticism rather than a strategy shift.
Benchmarking supports decisions such as:
- Setting prices in line with, or deliberately apart from, your competitive set
- Right-sizing staffing against labor cost ratios typical for your sector
- Justifying or delaying a process investment based on where you sit relative to peers
Used this way, benchmarking becomes a filter for decisions you were already weighing, not a verdict delivered from outside.
Types of benchmarking and which fits your goal
Four approaches cover most business needs, and picking the wrong one is the fastest way to generate a misleading comparison.
- Competitive benchmarking measures you against direct rivals in your market, best for pricing, win rates, and market share questions.
- Functional benchmarking compares a specific process (billing, fulfillment, customer onboarding) against companies that excel at it, even outside your industry.
- Internal benchmarking tracks your own locations, teams, or time periods against each other, useful when external data is thin or inconsistent.
- Generic benchmarking looks at broad best practices across industries, helpful for process redesign but weak for financial targets.
Cross-industry comparisons go wrong fastest with financial ratios: a software company’s margin structure tells you nothing about a restaurant’s. Finance KPIs call for same-industry, same-size peer data; operational KPIs like cycle time or defect rate travel better across sectors.
Where to find reliable benchmark data
Public sources are the natural starting point. The BLS publishes productivity and cost data built from BEA and Census inputs, the Census Bureau runs the Annual Survey of Manufactures and related establishment surveys, and both are free. Their limitation is granularity: once you need a narrow NAICS code crossed with a specific revenue band, public tables often stop short.
Commercial datasets fill that gap, typically offering tighter industry codes, documented sample sizes, and a regular refresh schedule. Before trusting one, check business tax compliance essentials to better benchmark cost or tax-related KPIs.
- Coverage: does it include your exact NAICS code and firm-size band
- Sample size: is the underlying count large enough to be stable, not a handful of filings
- Recency: when was the data last refreshed
- Source documentation: can you trace a figure back to its origin if a client or auditor asks
Primary data collection, through surveys of a defined peer group or a benchmarking partnership, makes sense when no existing dataset matches your scope closely enough.
Pro Tip: Before paying for any dataset, ask for a sample report and check whether its NAICS depth matches the segment you actually operate in, not just the broad industry category.
Step-by-step benchmarking process (plan, collect, analyze, apply)
APQC frames benchmarking as four phases, and the discipline of following them in order is what keeps a project defensible.
- Plan: write down the business question you’re answering, define the peer group, and lock the scope before collecting anything. This is also where you document the operational definition of each metric, using a framework like APQC’s Process Classification Framework to make sure “revenue per employee” or “cost of sales” means the same thing for you and your peers.
- Collect: start with secondary sources (public data, commercial reports) before committing to primary research. If partners or survey respondents are involved, write screening rules in advance so you don’t backfill criteria to fit convenient data, and run basic quality checks (does the number make sense against last year, does the source cite its sample).
- Analyze: normalize figures so firm size doesn’t distort the picture. Common normalizations include per-FTE, per-location, and percentile ranking rather than simple averages. Segment peers tightly, and look at multiple periods, three to five years where possible, rather than reacting to one snapshot.
- Apply: turn the gap into a root-cause question, not just a number to report. Rank findings with a prioritization matrix, assign an owner to each workstream, and set a monitoring cadence so the comparison gets revisited rather than filed away.
A few habits carry across all four phases:
- Document every metric definition in writing so someone else can reproduce the comparison later
- Revisit scope whenever a new peer or data source is added, since definitions drift
- Treat any single-year anomaly as a flag to investigate, not a conclusion to act on immediately
Teams that skip the planning phase tend to collect data first and argue about what it means afterward. Reversing that order, question and scope before data, is the difference between a benchmarking exercise and a benchmarking project.
Defining metrics, scope, and normalization
A benchmark is only as good as its operational definition. Before comparing anything, write down:
- The exact numerator and denominator (is “revenue per employee” using full-time headcount or total payroll hours)
- Inclusions and exclusions (does cost of sales include freight, does revenue include returns)
- The measurement point (point-in-time snapshot versus period average)
- The reporting period and whether it’s fiscal or calendar
- An accountable owner for the metric going forward
APQC’s scoping guidance sets out exactly this kind of checklist, pairing it with the Process Classification Framework so two organizations comparing “the same” metric are actually measuring the same work.
A benchmark is more defensible once converted to percentiles or normalized per-FTE and per-revenue figures rather than left as raw averages, since raw averages skew toward whichever firms in the sample happen to be largest.
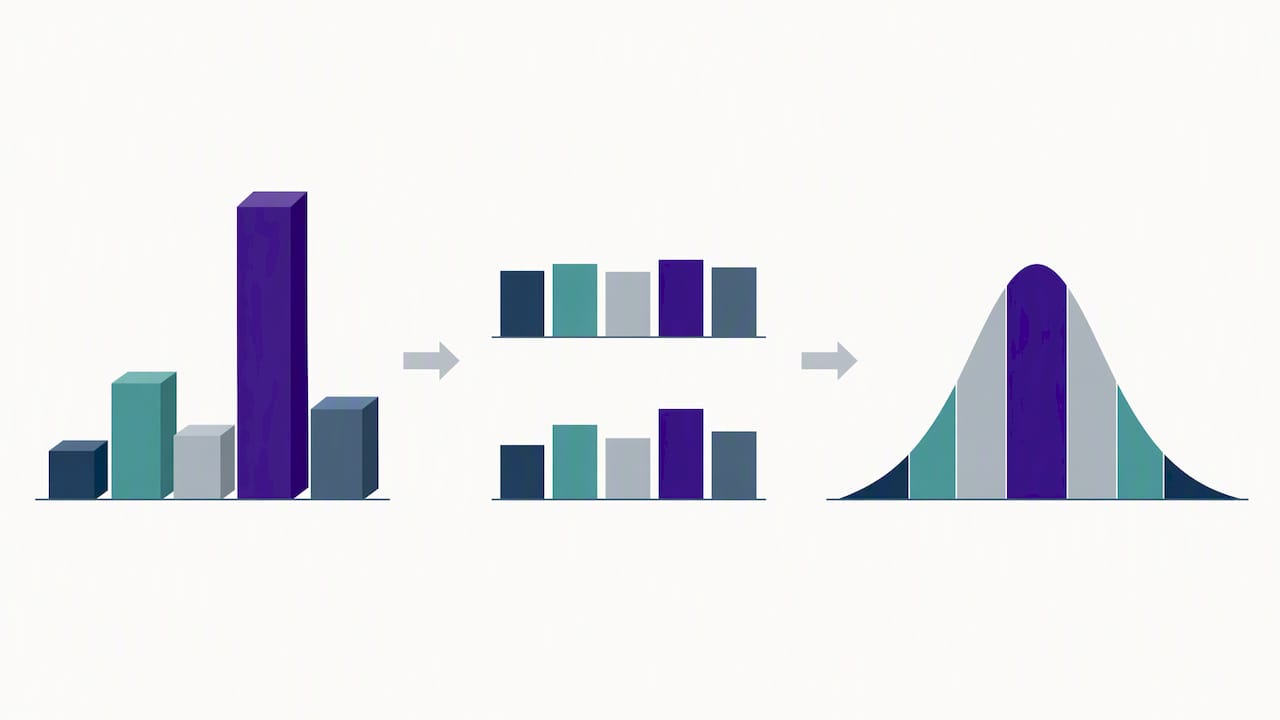
Before declaring a gap real, confirm the boundaries line up: same industry code, comparable size band, same fiscal period. A gap that disappears once you normalize correctly was never a gap, it was a scoping error.
Interpreting gaps and converting benchmarks into improvement plans
Not every gap is worth acting on, and not every gap is real. A dip that shows up in one quarter is usually noise; a Forbes commentary on BLS data makes the case for leaning on three to five years of trend data rather than a single-year reading, flagging any one-year-only finding as tentative until confirmed.
Once you’re confident a gap is structural, prioritize using three questions:
- Impact: how much would closing this gap move revenue or cost
- Effort: what would it take in time, budget, and organizational buy-in
- Defensibility: is the underlying data solid enough to support the decision if challenged
Quick wins tend to be process fixes with low effort and clear data support, like trimming a cost ratio that’s visibly out of line with peers. Each initiative needs a named owner, a specific metric to track, and a recheck date, otherwise the benchmark becomes a one-time report instead of a management habit.
Why auditable, granular benchmarks matter
Auditors, lenders, and attorneys don’t just want a number, they want to know where it came from and whether it would hold up under question. That’s why sample size, source documentation, and industry-code precision matter as much as the figure itself. Some data providers offer datasets covering many distinct markets, and datasets used in legal or government contexts provide traceability a benchmark needs when it’s backing a loan decision or a valuation claim rather than just an internal memo.
— Danny
How Bizminer supports a defensible benchmarking project
If you’ve worked through the steps above and want data granular enough to stand behind, our Industry Financial Performance reports map directly onto the collect and analyze phases, giving you ratio benchmarks scoped to specific NAICS codes and size bands instead of a broad industry average. Our Market & Industry Research reports cover the same ground for market-level sizing and trend questions, and our Market Data API lets teams pull figures directly into internal models for ongoing monitoring rather than re-running a report each quarter.
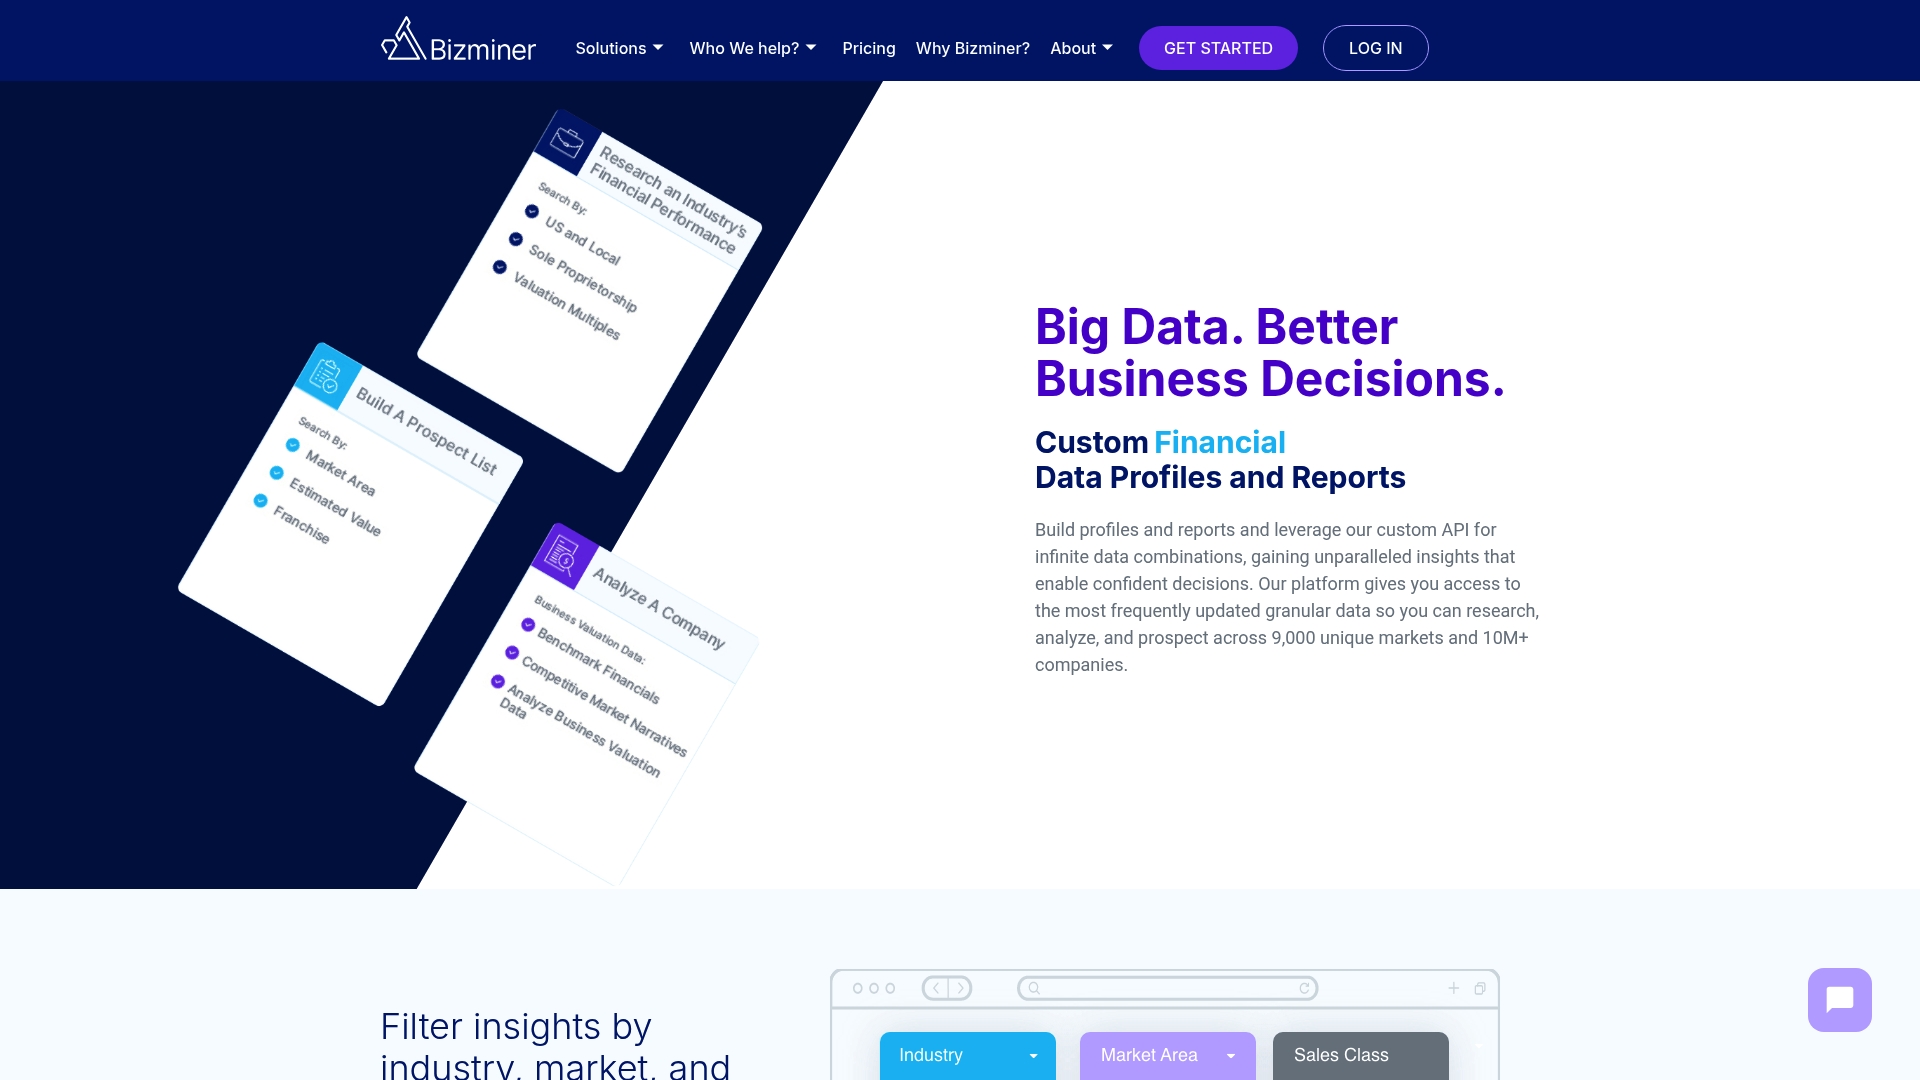
Because our reports are built from granular, customizable datasets, you can match scope precisely, same NAICS depth, same size band, same metric definitions, without the scoping guesswork that undermines a lot of informal comparisons. If you want to see the level of detail before committing, request a sample industry report and check it against the metrics you’re already tracking.
FAQ
What are the seven types of benchmarking?
Common frameworks name competitive, functional, internal, generic, strategic, process, and performance benchmarking as the seven types, though terminology varies by source. In practice, most businesses rely on four: competitive, functional, internal, and generic, each suited to a different kind of question.
Can you give examples of industry benchmarks?
Typical examples include revenue per employee, gross margin by NAICS code, labor cost as a percentage of revenue, and inventory turnover. Our revenue per employee benchmarks page shows how these ranges vary by industry and firm size.
How do I benchmark against competitors?
Start by defining the exact metric and peer group you want to compare, then collect data from public sources like the BLS or a commercial dataset with matching NAICS depth. Normalize the figures (per-FTE or percentile rather than raw average) before concluding a gap exists.
What is industry benchmarking?
Industry benchmarking is the practice of comparing a company’s performance metrics against peers in the same sector to identify relative strengths and gaps. It relies on consistent metric definitions and comparable peer groups to produce a result worth acting on.
How often should I update my benchmarks?
Most practitioners recheck core financial benchmarks annually and operational metrics quarterly, though the right cadence depends on how fast your sector moves. Reviewing three to five years of trend data, rather than a single period, helps separate a real shift from normal year-to-year noise.