Start with an industry-specific executive benchmark report. It’s the single most useful benchmarking report example because it packs peer comparisons, KPI charts, and an action plan onto formats most stakeholders will actually read. Once you’ve studied that format, layer in two more samples for range.
- Executive summary template: a one-page dashboard built for boards and leadership.
- Process benchmarking report: maps a specific workflow against peer performance.
- KPI dashboard sample: trend lines and quartile charts for ongoing tracking.
Every credible sample follows a standardized 5-step framework: identify the metric, select peers, collect data, analyze gaps, and implement change. Bizminer publishes industry-specific sample reports you can customize instead of building one from scratch.
Key Takeaways
A benchmarking report only creates value when its findings become owner-assigned actions with deadlines, not when the data collection itself is finished.
| Point | Details |
|---|---|
| Start with the executive sample | Model your first draft on an executive benchmark report before attempting a full operational deep-dive. |
| Follow the 5-step cycle | Plan, select peers, collect data, analyze gaps, and implement and monitor, then reassess iteratively. |
| Standardize before comparing | Validate data and align metric definitions to avoid invalid, apples-to-oranges comparisons. |
| Assign owners and deadlines | Every recommendation needs a named owner, a target, and a deadline or it won’t get acted on. |
| Consider cross-industry peers | Functional benchmarking against unrelated industries often produces bigger fixes than competitor comparisons. |
| Use Bizminer for peer data | Bizminer supplies customizable, industry-specific sample benchmark reports across 9,000+ markets to build from. |
Table of Contents
- What Is a Benchmarking Report, and Why Do Teams Build One?
- What Types of Benchmarking Reports Should You Model?
- What Sections Belong in a Benchmarking Report Template?
- What Do Real Sample Benchmarking Reports Look Like?
- How Do You Actually Create a Benchmarking Report?
- How Do You Turn Benchmark Results Into Action?
- What Does a Real Benchmarking Success Story Look Like?
- What Should You Watch Out for When Using These Samples?
- How Bizminer Supports Your Benchmarking Project
- Where Else Can You Find Sample Benchmarking Reports?
- Frequently Asked Questions
- Sources
What Is a Benchmarking Report, and Why Do Teams Build One?
A benchmarking report compares your defined metrics against peer organizations or industry standards, then recommends specific actions to close the gap. That’s the whole job. It’s not a data dump. It’s a decision document.
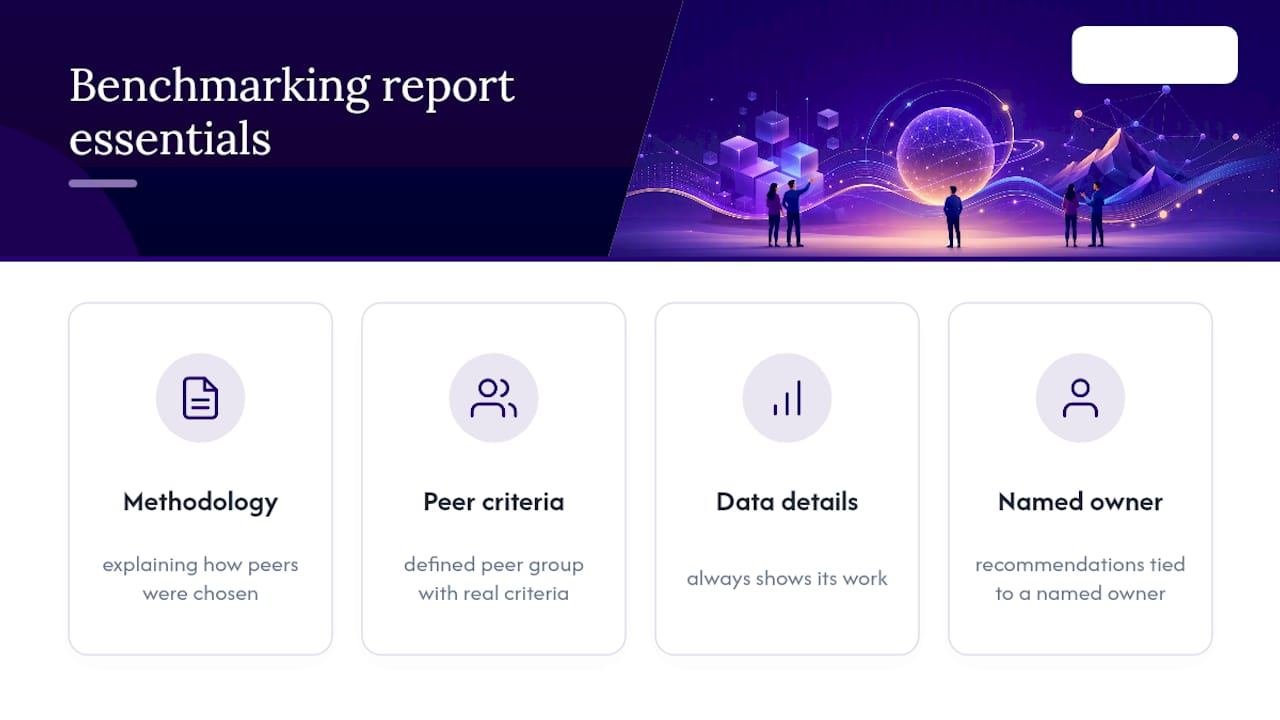
Teams commission these reports for four recurring reasons: setting strategy targets, controlling costs against industry norms, fixing broken processes, and giving boards a credible external reference point instead of internal opinion. A good sample report always shows its work: a clear methodology section explaining how peers were chosen, a defined peer group with real criteria, and recommendations tied to a named owner. Reports missing any of those three elements tend to get filed away and forgotten rather than acted on.
What Types of Benchmarking Reports Should You Model?
The report type should follow the business question, not the other way around. Each type points to a different sample structure.
- Internal benchmarking compares performance across your own branches, teams, or time periods. Samples emphasize consistent KPI tracking over time.
- Competitive benchmarking stacks your numbers against direct rivals. Samples focus heavily on peer selection criteria and data sourcing, since that’s where disputes happen.
- Functional benchmarking looks at a specific process (billing, onboarding, claims) against anyone doing it well, regardless of industry. Samples lean on process maps and root-cause visuals.
- Strategic benchmarking compares business models and long-term positioning. Samples favor narrative and trend charts over granular tables.
- Best-practice benchmarking documents specific practices worth copying. Samples read more like case studies than spreadsheets.
Cross-industry samples surface more original ideas; direct-competitor samples are easier to defend to a skeptical board.
What Sections Belong in a Benchmarking Report Template?
A copyable benchmarking report format includes nine parts: executive summary, methodology, data scope and definitions, KPI comparison tables, visual dashboards, gap analysis, recommendations, owner-assigned actions, and an appendix. Skip the methodology section and the whole report loses credibility the moment someone questions a number.
Six visuals do most of the heavy lifting in professional samples:
- Quartile box-and-whisker charts show where you sit relative to top, median, and bottom performers.
- Band charts track a metric’s range over time against a peer band.
- Peer comparison tables lay out raw figures side by side for quick scanning.
- Waterfall charts break down how a gap accumulated across contributing factors.
- KPI trend lines show direction, not just a snapshot.
- Heat maps flag which metrics need attention fastest across multiple business units.
Pro Tip: Every recommendation needs an owner and a deadline written directly next to it. A report that says “improve collections” changes nothing. A report that says “Sarah, controller, reduces DSO to 45 days by Q2” gets tracked in the next meeting.
Note your peer criteria, sample size, data vintage, and validation steps in an appendix. Anyone questioning your numbers should find the answer there, not have to ask you directly.
What Do Real Sample Benchmarking Reports Look Like?
Two template types cover most use cases. The executive benchmark report fits on one page: a dashboard plus four to six KPI charts (often Days Sales Outstanding, revenue per employee, or cash conversion cycle) and a short action plan. The operational process benchmark goes deeper on one workflow: a process map, a time-gap table, root-cause bullets, and a 90-day improvement plan.
Before you adapt either template, edit five things first:
- Metric definitions (make sure “resolution time” means the same thing everywhere)
- Peer group composition
- Data vintage (how current is the comparison data)
- KPI units (percentages vs. raw counts vs. ratios)
- Owner assignments for every recommended action
Bizminer’s industry-specific report templates come pre-populated with peer financial ratios across more than 9,000 markets, so the editing list shrinks to peer criteria and owner names rather than starting from a blank page.
How Do You Actually Create a Benchmarking Report?
Professional reports follow a standardized 5-step cycle: plan, select peers, collect data, analyze gaps, and implement and monitor. Most add a sixth stage, iterative reassessment, because a benchmark taken once goes stale fast.
- Plan. Define the metric precisely. Write out a metric definition template so “customer churn” means one thing across every department.
- Select peers. Choose a peer group with real criteria (size, region, industry code). Decide upfront whether you want direct competitors or cross-industry comparisons.
- Collect data. Use a standard survey template internally and pull external data from a consistent source. Run a validation check on outliers before moving on.
- Analyze gaps. Run quartile analysis to see where you land versus median and top performers. Look for root causes, not just the size of the gap.
- Implement and monitor. Assign owners, set deadlines, and schedule the next reassessment.
Before comparing anything, standardize your units and measurement windows. Mismatched definitions invalidate the whole comparison.
How Do You Turn Benchmark Results Into Action?
Convert every gap into a prioritized initiative using impact versus effort, then assign an owner. A gap with high impact and low effort to fix goes first, always.

A workable action item reads like this: “Owner: Regional Ops Manager. Target: reduce processing time to top-quartile (7 days). Deadline: end of Q3. Success measure: weekly processing report.” Quartile placement should set your target, not the raw average. Aim for top-quartile performance on your highest-impact metric, not median performance across everything. And resist reacting to a single bad metric without checking for a root cause first. One outlier month rarely means what it looks like.
What Does a Real Benchmarking Success Story Look Like?
An insurance provider significantly reduced claims processing time by benchmarking against a process from a different industry.
The team ran a functional benchmark against credit card complaint handling, a process that shares almost nothing on the surface with insurance claims but solves a similar problem: fast intake and validation of customer-submitted data. The finding: their process lacked digital input validation, which created downstream errors and rework.
| Metric | Before | After |
|---|---|---|
| Average processing time | 12 days | ~7.5 days |
| Benchmarking approach | None (internal only) | Cross-industry functional benchmark |
The insurer didn’t fix its claims process by studying other insurers. It found the answer by studying how an unrelated industry validated data at intake, then adapted that fix to its own workflow.
What Should You Watch Out for When Using These Samples?
Standardize your metric definitions before you touch a comparison table, and run a validation pass on the data. Skip that step and you’re comparing apples to oranges without knowing it.
Two traps show up constantly: teams that spend months perfecting the analysis and never ship a report, and teams that ship a polished report with no owner attached to a single recommendation. Neither produces change.
Treat every sample in this article as a conversation starter with your team, not a finished deliverable to hand over and walk away from.
How Bizminer Supports Your Benchmarking Project
Bizminer gives you the peer data these samples are missing: granular financial ratios across more than 9,000 industry markets, ready to drop into whichever template fits your project.

- Industry coverage spanning over 9,000 unique markets segmented by geography and company size
- Granular financial ratios (DSO, margins, revenue per employee) sourced from data accepted in U.S. Tax Court
- API access and one-off custom reports for advisors who need a tailored deliverable
- Built for accountants, business advisors, and analysts producing client-facing work, not casual browsing
If you need a peer group and a set of ratios you can trust before your next client meeting, start with Bizminer’s market and industry research tool and pull a sample for your specific NAICS code today.
Where Else Can You Find Sample Benchmarking Reports?
- CASE Insights offers downloadable summary benchmarking reports for education advancement surveys.
- ASQ’s benchmarking resource hub provides case studies and sample PDFs across manufacturing, healthcare, and higher education.
- Venngage’s benchmark report guide covers formatting and validation practices in more detail.
Frequently Asked Questions
What is a benchmarking report used for?
It compares your metrics against peer organizations or standards, then recommends specific, owner-assigned actions to close identified gaps.
Where can I download free benchmarking report templates?
Industry associations like ASQ and CASE Insights publish free samples, while Bizminer offers industry-specific templates built around real financial ratio data.
What’s the difference between competitive and functional benchmarking?
Competitive benchmarking compares you to direct rivals. Functional benchmarking compares one process to top performers in any industry, which often produces more original fixes.
How often should a benchmarking report be updated?
Most professional cycles include reassessment every 12 to 18 months, since data vintage and market conditions shift and stale peer comparisons lose their value.
What makes a benchmarking report format credible?
A clear methodology section, a defined peer group with real selection criteria, and recommendations tied to a named owner and deadline.
Sources
- Benchmarking process | TimeDoctor
- Benchmarking: Definition, Types, Process & Practical Examples | SI Labs
- How to create a benchmark report | Venngage