
The best industry risk data is benchmarked financial data indexed to NAICS codes, segmented by revenue size, tracked across multiple years with point-in-time history, and reported as distributions rather than single averages. For credit and valuation work, that means demanding median and quartile figures instead of one blended number. Bizminer meets these professional standards, and its data has been accepted in U.S. Tax Court and used by government agencies.
TL;DR:
- Industry risk data must be segmented by NAICS codes and revenue size to accurately reflect each company’s specific context.
- Multi-year, point-in-time history with survivorship bias controls offers a more reliable view than static averages for trend analysis.
- Benchmarking ratios should include distribution metrics like quartiles to reveal a company’s relative position within peer groups.
- Providers should disclose their methodology, sample size, and update frequency to ensure data quality and relevance.
- Combining industry benchmarks with macroeconomic indicators is essential to accurately assess sector-specific risks amid changing market conditions.
Table of Contents
- What to Look for in the Best Industry Risk Data
- Core Ratio Categories and How Benchmarks Frame Risk
- How to Apply Benchmarks to Creditworthiness and Valuation
- Data Sources, Standardization Practices, and Quality Checks
- Provider Selection Checklist: Questions to Ask Before You Buy
- Risk Indicators That Go Beyond the Balance Sheet
- How Industry Risk Data Gets Collected and Refreshed
- Weaving Macroeconomic and Market Factors Into Industry Benchmarks
- Keeping Industry Risk Data Current as Conditions Change
- Proprietary Versus Public Sources of Industry Risk Data
- Turning Benchmarks Into Advisory Revenue
- Get Industry Benchmarks Built for Credit and Valuation Work
- Sources
What to Look for in the Best Industry Risk Data
Not all benchmark datasets deserve a seat at your credit committee table. Before you commit budget or trust to a provider, check whether the data actually holds up under scrutiny from an examiner, an appraiser, or opposing counsel.
Here’s the checklist that separates usable data from decorative data:
- NAICS or SIC mapping with revenue-size bands. A construction firm with $2 million in revenue behaves nothing like one with $50 million. Insist on explicit size filters, not a single blended “industry average.”
- Multi-year, point-in-time history. You need to see how a ratio looked in the year it was reported, not a retroactively smoothed figure, and you need survivorship-bias controls so failed companies aren’t quietly dropped from the sample.
- Distribution outputs, not just averages. Medians, quartiles, and deciles reveal where a specific borrower or target company actually sits among peers.
- Clear ratio definitions. If a vendor doesn’t tell you exactly how it calculates debt-to-worth or EBITDA margin, you can’t defend the number in a valuation report.
- Audit trail and export access. You need documented sourcing, a stated update cadence, and the ability to pull data via API or export for workpapers.
Pro Tip: Ask any vendor for their methodology behind financial benchmarking before you buy. If they can’t explain how they handle survivorship bias or size segmentation in plain language, that’s a red flag worth taking seriously.
Core Ratio Categories and How Benchmarks Frame Risk
Every credit or valuation judgment rests on four ratio families, and treating them in isolation is the fastest way to misread a company.
- Liquidity — current ratio, quick ratio. Can the company cover short-term obligations?
- Leverage — debt-to-worth, debt-to-equity. How much of the balance sheet is financed by debt versus owner capital?
- Coverage — DSCR, interest coverage. Can operating cash flow service the debt load?
- Profitability — EBITDA margin, ROA, ROE. Is the business actually generating returns worth lending against or valuing highly?
Lenders often cite thresholds like a 1.25x DSCR floor or a current ratio above 1.5, but those numbers only mean something in context.
This is where the averaging fallacy trips up otherwise careful analysts. A single industry average hides the spread. A company can appear average by broad measures but may rank weak when seen within the full distribution and quartile breakdown. Distribution-aware reporting using quintiles or quartiles catches that nuance.
Trend analysis matters just as much as the snapshot. A current ratio drifting from 1.8 to 1.1 over three years signals stress even when the final number still sits near the industry median. Pull two to three years of benchmarks alongside the company’s own history before drawing conclusions.
How to Apply Benchmarks to Creditworthiness and Valuation
Turning raw benchmark data into a defensible credit decision or valuation adjustment follows a fairly consistent workflow.
- Standardize the financials. Spread the company’s statements into consistent, GAAP-mapped line items so they’re comparable to the benchmark’s categories.
- Assign the NAICS code and revenue band. Pull the distribution metrics for that exact peer group, not a broader industry umbrella.
- Read the signals together. Coverage, leverage, profitability, and trend rarely tell the same story in isolation; the picture emerges from combining them.
- Translate placement into action. A borrower in the bottom quartile for leverage but top quartile for coverage might still qualify, just with tighter covenants or repricing. In a valuation context, weak peer placement often supports a higher risk premium in the discount rate.
Here’s a compact example. Against the full industry sample that looks solid, combine that with a debt-to-worth ratio above the 75th percentile for its peer group, and the lending decision shifts from “approve as-is” to “approve with a maintenance covenant.”
Pro Tip: Keep a one-page benchmark snapshot for each NAICS code you underwrite regularly. It turns a five-minute data pull into a ten-second sanity check during committee review.
Data Sources, Standardization Practices, and Quality Checks
Where the numbers come from matters as much as what they say. Primary sources include SEC filings, tax return data, and government statistical programs. Secondary or commercial sources aggregate and normalize that raw material into usable benchmarks, and the quality of that normalization is where providers separate from each other.
Standardization means mapping as-reported figures into a consistent template so a restated balance sheet from one company lines up against another’s as-filed statement. Without that step, you’re comparing apples to whatever the filer felt like calling an asset that year. Survivorship-bias controls matter here too. Datasets that quietly drop companies once they fail or stop reporting will always look healthier than the real population of businesses in that industry.
Before trusting a dataset, run these checks:
- How large is the sample within your exact NAICS band and revenue tier?
- How far back does the time series run, and how often is it refreshed?
- Can you trace a specific ratio back to its underlying source?
- Does the provider disclose its standardization methodology, or just hand you a number?
Red flags include missing size segmentation, vague or absent methodology notes, and no export or API path for your workpapers.
Provider Selection Checklist: Questions to Ask Before You Buy
Evaluating a benchmark vendor works best as a structured request, not a sales call you passively sit through.
- Request a sample report for the exact NAICS code and revenue band you use most often, not a generic demo.
- Ask for point-in-time historical downloads and a plain-language explanation of survivorship methodology.
- Confirm ratio definitions in writing, along with the standardization template applied to raw filings.
- Check licensing terms for API access, export limits, and enterprise seats, plus turnaround time for custom reports.
- Ask for references from accountants or lenders who have used the data in credit committee packages or tax proceedings.
A vendor that hesitates on any of these five is telling you something. Financial benchmarking software built for professional use should answer every one of them without friction.
Risk Indicators That Go Beyond the Balance Sheet
Ratios tell you a lot, but industry risk rarely stops at the financial statement. A trucking company lives and dies by fuel price volatility and driver turnover. A restaurant group tracks same-store sales growth and labor cost as a percentage of revenue, metrics that barely register in manufacturing. Retail benchmarks lean on inventory turnover and square-footage productivity, while healthcare practices watch payer mix and days in accounts receivable, since reimbursement timing can distort a coverage ratio that looks fine on paper.

Construction and real estate carry backlog and pipeline metrics that predict revenue two years out, something a trailing twelve-month ratio can’t capture. Technology and subscription businesses run on churn rate and customer acquisition cost, figures that explain profitability trends long before they show up in an EBITDA margin. The point isn’t that ratios are wrong. It’s that a lender or advisor who only reads liquidity, leverage, coverage, and profitability misses the operational context that explains why those ratios move. The strongest industry risk assessments layer sector-specific operating metrics on top of the standard four ratio families, because a declining current ratio means something different in a seasonal business than in a steady one.
How Industry Risk Data Gets Collected and Refreshed
Most benchmark datasets draw from a mix of tax return aggregation, financial statement submissions from accounting firms and lenders, and government economic census programs. Each method carries a different lag. Tax-based data tends to arrive with the longest delay, sometimes a year or more, because filing and processing take time. Statement-based aggregation from professional networks can refresh more often, sometimes quarterly, depending on submission volume in a given industry segment.
Update frequency varies by how thin or thick the underlying sample is. A widely populated segment like general retail or restaurants might see meaningful quarterly movement. A narrow, specialized NAICS code with few reporting firms might only justify an annual refresh without introducing noise. That’s worth asking any provider directly: how many data points feed a given segment, and how often does the sample turn over? A dataset that claims quarterly updates across every one of 9,000-plus industry segments is either drawing on a genuinely enormous reporting network or padding thin segments with stale carryover numbers. Ask which one it is.
Weaving Macroeconomic and Market Factors Into Industry Benchmarks
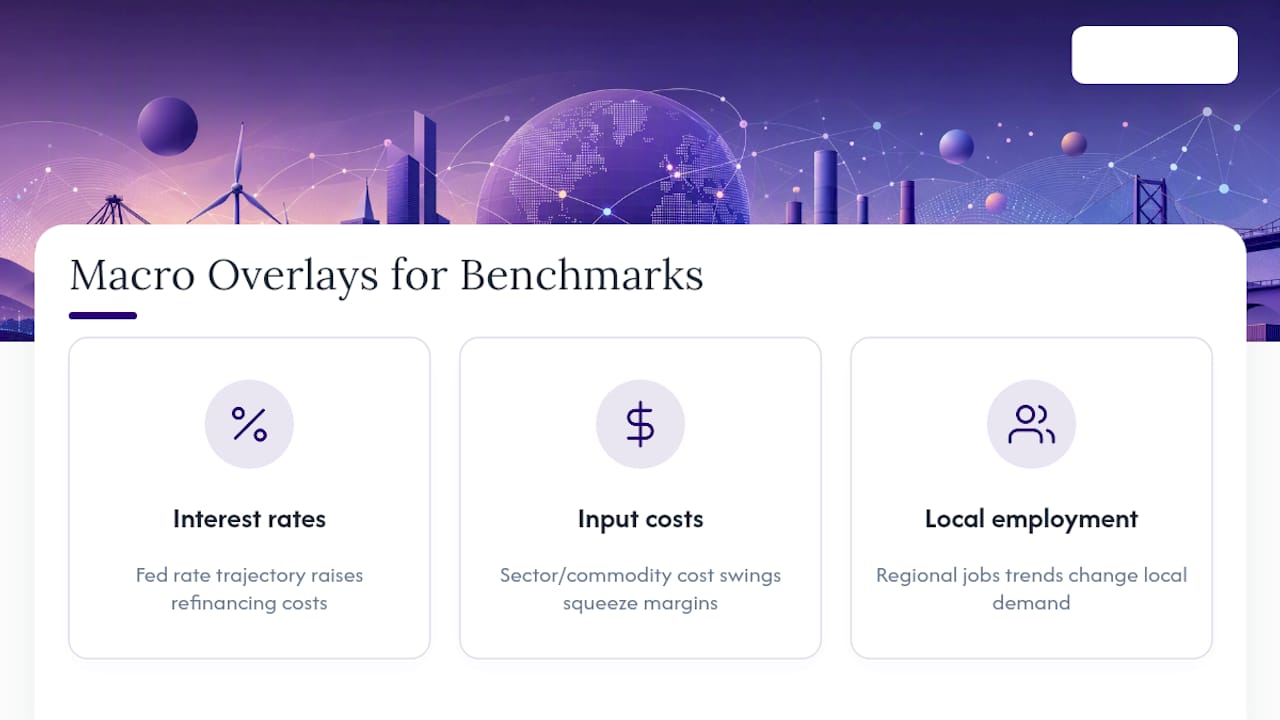
Industry-level ratios tell you how a sector typically performs, but they say nothing about the interest rate environment, commodity swings, or credit cycle a company is operating inside right now. A leverage ratio that looked conservative in a low-rate period can turn dangerous once refinancing costs jump, even if the balance sheet hasn’t changed at all.
Sophisticated credit and valuation work overlays industry benchmarks with a handful of macro signals: the current Federal Reserve rate trajectory, sector-specific input cost trends, and regional employment data when the business serves a local market. A DSCR benchmark built during an expansion cycle needs a mental adjustment during a contraction, because coverage ratios across an entire industry tend to compress together when borrowing costs rise. The benchmark stays useful as a peer comparison. It just needs a macro lens on top to avoid treating a cyclical dip as company-specific weakness. This is also where trend analysis earns its keep again: comparing a company’s ratio trajectory against the industry’s trajectory over the same period isolates whether deterioration is company-specific or sector-wide.
Keeping Industry Risk Data Current as Conditions Change
Stale benchmarks are worse than no benchmarks, because they carry false confidence. An industry that looked stable eighteen months ago can shift fast after a supply shock, a regulatory change, or a demand collapse, and a dataset that hasn’t caught up will steer a credit decision in the wrong direction.
Practitioners should treat benchmark refresh cadence as part of their own quality control, not something to assume happens automatically. That means checking the “as of” date on every report before citing it in a credit memo, cross-referencing a suspicious benchmark against a second data point when a client’s numbers look wildly out of step with the peer group, and flagging to a vendor when a segment’s data feels behind current conditions. Providers that maintain dedicated industry pages with visible update timestamps make this check trivial. Providers that don’t should prompt a direct question before you rely on their numbers for anything with legal or financial consequence.
Proprietary Versus Public Sources of Industry Risk Data
Public sources, government economic census data, Bureau of Labor Statistics releases, and SEC filings for public companies, are free and carry government-level credibility. Their limitation is granularity. Public data rarely breaks down to the revenue-size band or narrow NAICS segment a credit analyst actually needs, and update lag can run well over a year.
Proprietary datasets fill that gap by aggregating private company financials into standardized, segmented benchmarks that public sources simply don’t produce. The tradeoff is cost and the need to vet methodology, since not every commercial provider discloses how it handles standardization or survivorship bias. For accountants and lenders working with private companies, which make up the overwhelming majority of credit and valuation engagements, a well-documented proprietary dataset with clear sourcing usually beats trying to stretch public statistics past their intended granularity. The right approach often blends both: public data for macro context, proprietary benchmarks for the peer-level detail that actually drives the decision.
Turning Benchmarks Into Advisory Revenue
Granular benchmarks do more than validate a credit decision. Handing a client a percentile snapshot of their industry peer group during an advisory meeting tends to shift the conversation from compliance to strategy, and that shift is where fee revenue lives. Bizminer’s coverage across 9,000-plus industry segments, paired with data accepted in U.S. Tax Court, gives that conversation real weight instead of a vague “your margins look okay” comment. Bring one benchmark chart to every quarterly review; it opens more doors than any pitch deck.
— Danny
Get Industry Benchmarks Built for Credit and Valuation Work
Everything covered above, NAICS-indexed segmentation, revenue-size bands, multi-year point-in-time history, and distribution metrics instead of flat averages, is what Bizminer builds into every report as part of its robust financial consulting services. Coverage spans more than 9,000 industry segments, and the underlying data has been accepted in U.S. Tax Court and used by government agencies, which matters when a benchmark needs to hold up outside your own office.

You can access this data through a subscription license, a one-off report purchase, or a direct API feed if you need to pull segmented benchmarks into your own models. For a credit team or advisory practice weighing benchmark accuracy against budget, requesting a sample report through Bizminer’s NAICS industry search tool is the fastest way to see the size-band filtering and distribution outputs firsthand before committing to a plan.
Sources
- Corporate Finance Institute — Financial ratios
- LenderAnalyzer — Financial ratios for credit analysis