Industry credit risk is the chance that a group of related borrowers or exposures suffers correlated losses in the same economic shock, rather than isolated, unrelated defaults. Lenders need to map concentrations, not just rate individual loans, and track supervisory benchmarks like Shared National Credit (SNC) non-pass rates alongside granular market data to catch portfolio-level stress before it compounds.
TL;DR:
- The 2025 Shared National Credit review found commitments rated below pass fell to 8.6% from 9.1%, while leveraged loans represented 81% of that total.
- Segment loans by industry code, collateral, sponsor, geography, and vintage; broad industry labels can conceal fragile business models within otherwise stable sectors.
- A sector’s rising noncurrent rate and weakening debt service coverage together signal trouble; vintage roll rates can reveal deterioration before headline figures do.
- Set concentration limits against risk appetite and stress capital needs, adjust terms or exposure as indicators worsen, and validate models according to their decision impact.
Table of Contents
- What industry credit risk means and why it matters to lenders
- How industry-level credit risk is measured
- Common drivers and patterns of industry credit risk
- Assessing industry credit risk in practice: a stepwise framework
- Managing and mitigating industry credit risk
- Recent data and supervisory signals through 2026
- Applying granular market data and benchmarks in credit analysis
- Practical priorities for credit teams right now
- FAQ
- Sources
What industry credit risk means and why it matters to lenders
Borrower-specific credit risk asks whether one company can repay its debt. Industry credit risk asks a different question: when a sector hits a downturn, how many borrowers in the portfolio go bad at once? A loan book can contain hundreds of individually well-underwritten credits that still fail together because they share the same economic driver.
That correlation is exactly why supervisors pay close attention to industry pools rather than single loans. The Comptroller’s Handbook on concentrations of credit explains that concentrated exposures can behave similarly under stress even when each loan was sound on its own, and identifies concentrations as a recurring cause of past bank failures.
For portfolio managers, the practical takeaway splits into a few distinct risks:
- A single sector downturn can impair many loans simultaneously, not just one borrower.
- Collateral values tied to the same industry can fall together, reducing recovery rates across the pool.
- Risk that looks diversified by borrower count can still be concentrated by cash-flow driver or supply chain.
How industry-level credit risk is measured
Credit teams lean on a handful of metrics to size up industry exposure rather than guessing at sector health. Non-pass rates, which combine special mention and classified loans, are the closest thing to a standardized industry scorecard.
The 2025 Shared National Credit review found non-pass loans fell to 8.6% of total commitments, down from 9.1% the prior year, across a $6.9 trillion portfolio covering 6,857 borrowers. Leveraged loans accounted for 81% of that non-pass total, a reminder that aggregate improvement can still mask concentrated weakness in specific loan structures.
Beyond non-pass rates, credit professionals typically track:
- Noncurrent rates and net charge-offs by sector to spot deteriorating repayment trends early.
- Loss-severity assumptions and probability-of-default estimates layered onto exposure size.
- Concentration metrics such as exposure share by industry or a Herfindahl-Hirschman Index calculation.
- Underwriting indicators including exception rates, loan-to-value ratios, and the distribution of debt-service-coverage ratios across the book.
None of these numbers means much in isolation. A rising noncurrent rate paired with thinning DSCR coverage in the same sector is a stronger warning than either signal alone.
Common drivers and patterns of industry credit risk
Certain structural features make an industry, or a slice of it, more prone to correlated losses. Commercial real estate sub-sectors, leveraged lending, and portfolios with concentrated tenant or supplier relationships show up repeatedly in supervisory findings as higher-risk patterns.
Leverage itself is a multiplier. The OCC’s leveraged lending guidance points to heightened factors like reliance on enterprise value for repayment, refinance risk, and complex debt structures that amplify losses when conditions tighten.
A few patterns deserve particular attention:
- Multifamily and office commercial real estate can face refinancing exposure when rates or vacancy rates move against borrowers.
- Leveraged loans rely on enterprise value and refinancing access rather than steady operating cash flow, which makes them sensitive to credit market shifts.
- Subgroups within a broad industry classification can carry far more risk than the headline category suggests, since a single NAICS code can bundle stable and fragile business models together.
That last point matters most in practice: treating an entire industry as uniformly risky, or uniformly safe, misses the sub-segments actually driving losses.
Assessing industry credit risk in practice: a stepwise framework
A workable assessment process moves from segmentation through ongoing validation, not a one-time rating exercise.
- Segment the portfolio into common pools by NAICS code, collateral type, sponsor relationship, geography, and loan vintage.
- Apply risk ratings consistently across each pool, supported by the OCC’s risk rating framework for commercial credit.
- Build and monitor watch lists, using vintage and roll-rate analysis to flag pools migrating toward delinquency before it shows up in headline numbers.
- Track early-warning indicators such as covenant exceptions, declining DSCR trends, and collateral value drift within each segment.
- Validate underlying models, maintaining a model inventory and documented performance tracking rather than treating vendor models as black boxes.
That last step carries real weight. The OCC’s Model Risk Management guidance warns that model risk grows with complexity and materiality, and expects governance calibrated to how much a given model drives decisions.
Pro Tip: Run roll-rate analysis by loan vintage, not just by current balance: a pool can look stable in aggregate while its newest vintage quietly deteriorates.
Managing and mitigating industry credit risk
Once a pool’s risk profile is clear, mitigation comes down to limits, pricing discipline, and operational follow-through.
- Set explicit concentration limits tied to risk appetite and stress-capital planning, not just a general diversification goal.
- Tighten underwriting standards, re-price for risk, or reduce exposure in pools showing early deterioration.
- Require stronger covenants and more frequent reporting from borrowers in higher-risk segments.
- Schedule periodic loan reviews and collateral reappraisals so valuations reflect current conditions, not origination-date assumptions.
The FDIC’s loan portfolio review guidance emphasizes segmenting by risk characteristics and tracking trends in past-due and classified loans to support allowance methodology, not just satisfy an exam checklist.
Pro Tip: Build contingency plans for your largest concentrations before stress hits: deciding exit or workout criteria in advance is faster than negotiating them mid-downturn.
Recent data and supervisory signals through 2026
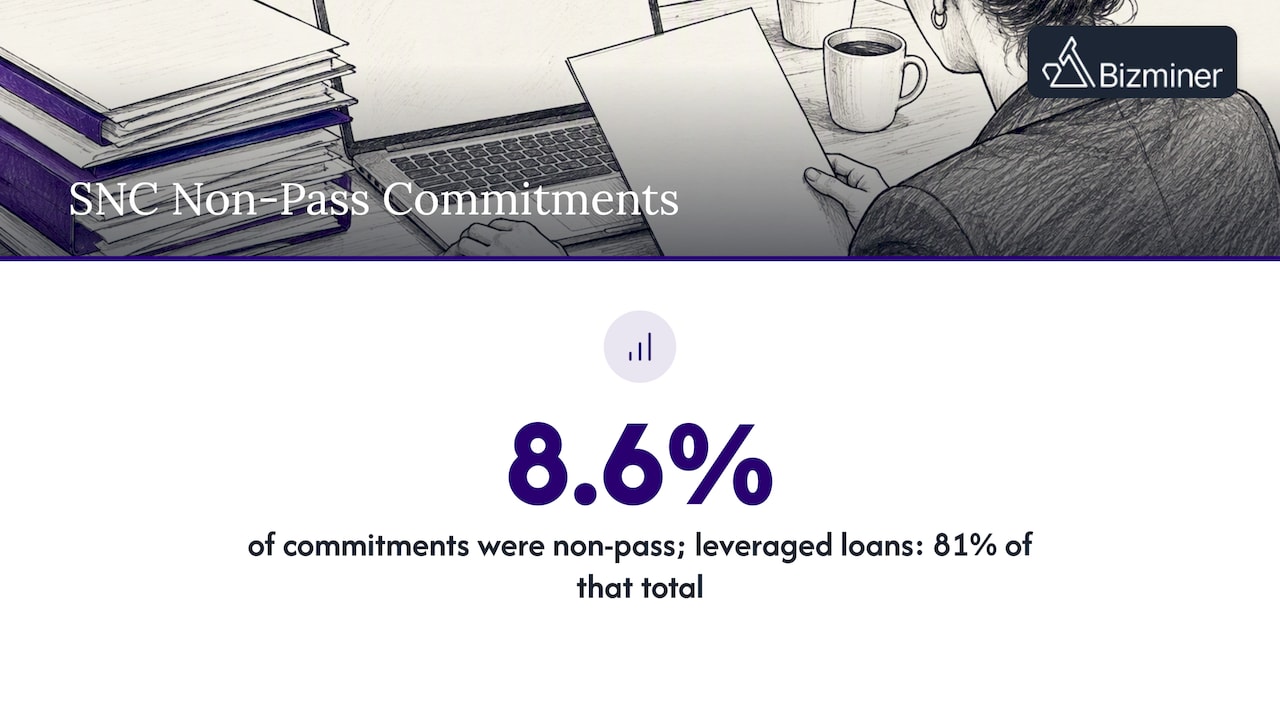
SNC non-pass commitments dropped to 8.6% in the 2025 review, with leveraged loans comprising 81% of that total, a concentration that should temper any read of the headline improvement as broad-based.
Federal Reserve reporting through 2025 and into 2026 indicates banks largely remained well capitalized, though delinquency rates ticked up and private credit interconnectedness warrants closer monitoring. Multifamily commercial real estate weakening and tighter commercial and industrial underwriting round out the current supervisory picture, reinforcing that concentration monitoring and model governance remain the two areas examiners return to most often.
Applying granular market data and benchmarks in credit analysis
Industry-level averages hide the sub-segment detail that actually drives losses, which is why granular, NAICS-level segmentation with transparent sample sizes matters for stress testing and underwriting alike.
- Detailed segmentation helps pinpoint tenant concentrations and margin compression within a broader industry category.
- Historical time series by segment support building credible stress scenarios instead of relying on headline industry trends.
- Audit-ready sourcing matters when a credit decision needs to hold up to supervisory review.
We build industry financial benchmarks to help credit teams analyze industry data, with data accepted in U.S. Tax Court for defensibility.
Practical priorities for credit teams right now
If I had to pick where credit teams should spend the next budget cycle, it would be concentration mapping and model validation, in that order. Too many portfolios get segmented by headline industry alone, missing the sub-group that actually carries the risk. Pair that with tighter governance over vendor model assumptions and forward-looking stress scenarios, and most of the blind spots in a typical loan book start to close.
— Danny
FAQ
Will FRM be replaced by AI?
AI tools are increasingly used to support credit and risk analysis, but the OCC’s guidance on responsible AI frames these tools as aids that expand access to credit and support decisions, not replacements for governed risk judgment. Model governance, validation, and human oversight remain central to how regulators expect risk management to function.
What are the 7 types of risks?
Risk frameworks vary by institution and regulator, so there is no single universal list of seven risk types. Common categories referenced in banking supervision include credit risk, concentration risk, market risk, liquidity risk, operational risk, model risk, and strategic risk.
What are the 3 C’s to measure borrower risk?
A widely used shorthand for borrower evaluation covers character, capacity, and collateral, reflecting a borrower’s track record, ability to repay from cash flow, and the assets backing the loan. Some versions add a fourth or fifth “C,” such as capital or conditions, depending on the lender’s framework.
How often should industry concentration limits be reviewed?
Concentration limits should be reviewed regularly and tied to current risk appetite and stress-capital planning, per OCC concentration guidance. Faster-moving sectors or pools already on a watch list typically warrant more frequent review.
What is a non-pass rate in credit risk?
A non-pass rate combines special mention and classified loans as a share of total commitments, serving as a portfolio-level indicator of credit quality. In the 2025 Shared National Credit report, the non-pass rate stood at 8.6% of total commitments.