City industry benchmarks are industry financial measures segmented by city: employment, payroll, revenue per employer, wage percentiles and revenue per employee for a defined set of businesses. Your first move is to lock the exact NAICS codes you need, then pick the primary public dataset (Census Business Builder or QCEW) or commission a professional city-level report when public cells come back suppressed.
TL;DR:
- Use specific 4 or 6 digit NAICS codes, select establishment data for local competition or firm data for valuation, and define the market geography.
- Use OEWS wage percentiles and QCEW employment and wage data; pair them with business counts, payroll, and receipts from Census business datasets.
- Economic Census data refreshes about every five years, while County Business Patterns and Nonemployer Statistics update annually, so record each vintage.
- When city industry cells are suppressed, widen the geography, conservatively estimate from a broader area and flag it, or purchase granular data.
- Purchase a professional report when suppression, tight deadlines, audit trail requirements, or NAICS clustering across many markets make public datasets insufficient.
Table of Contents
- Which metrics belong in a city industry benchmark?
- Where do the authoritative city-level numbers come from?
- How do you build defensible city-level benchmarks, step by step?
- What do you do when city data is missing?
- How do accountants and advisors use these benchmarks with clients?
- Why a defensible process beats a bigger dataset
- When should you buy a professional city-level report?
- FAQ
- Sources
- Key datasets and Bizminer pages to consult next
Which metrics belong in a city industry benchmark?
A usable city benchmark rests on a short list of measures, each tied to a task you already perform for clients:
- Establishments: local competitive saturation, a key input for market-entry and site advice.
- Employment and payroll: the base for expense forecasts and labor cost ratios.
- Revenue per employer: a sanity check on a client’s top line against local peers.
- Revenue per employee: a productivity yardstick that adjusts valuation comparisons for company size. Our revenue per employee benchmarks page shows ranges by industry.
- Wage percentiles (10th to 90th): OEWS publishes these for metropolitan areas, so you can model payroll as a range instead of a single average.
- Location quotients: how concentrated an industry is in the city relative to a wider benchmark, which flags whether a client operates in a crowded or thin market.
Valuation work leans on revenue per employee and establishment counts to justify multiples. Budgeting leans on wage percentiles. Underwriting leans on payroll and revenue per employer to test repayment capacity. If you want to turn average wage figures into something you can defend, our guide on BLS average wages by industry walks through it.
Where do the authoritative city-level numbers come from?
Several public programs cover the ground, and each refreshes on its own schedule:
- Census Business Builder (CBB): place-level industry reports for cities and towns, covering business counts, revenue per employer, payroll and employees. Economic Census data refreshes about every five years, while County Business Patterns and Nonemployer Statistics update annually.
- QCEW: establishment-level employment, wages and counts with quarterly wage levels, and a benchmark for other BLS programs.
- OEWS: occupational wage percentiles across metropolitan areas and many other geographies.
- Economic Census: the official five-year measure of U.S. businesses, with establishment-level employment, payroll and revenue.
- ABS and SUSB: firm and establishment counts, employment, payroll and receipts for metropolitan areas and counties. These can lag, so record the data vintage every time.
Granularity in CBB is subject to disclosure avoidance protocols, so expect some city-by-industry cells to be withheld.
Know which level you are reading. Establishment data describes a physical location, while firm data describes a legal entity. Use establishment counts for local competition and firm-level data for valuation benchmarking, as BLS guidance on establishment concepts explains.
How do you build defensible city-level benchmarks, step by step?
Follow this sequence and keep notes as you go:
- Define the NAICS codes and the unit. Use specific 4- or 6-digit NAICS codes, not broad sectors. Choose establishment measures for local operations and firm measures for ownership and valuation questions.
- Build a custom region. Economic activity crosses municipal lines, so aggregate adjacent places, ZIP codes or tracts into the market your client really serves. The Census data gem on custom industry groups and regions shows the clicks.
- Pull labor data. Take employment and wage percentiles from OEWS and QCEW.
- Pull business data. Take establishments, payroll and receipts from CBP, the Economic Census or SUSB where available.
- Log the metadata. Record data dates, suppression flags and sample sizes. If a city cell is suppressed, widen the custom region or substitute proprietary data.
Pro Tip: Keep a one-page defensibility sheet per engagement listing the NAICS codes used, the geography definition, each source table with its date, and any substitution or imputation rule.
For ZIP-level extraction, our walkthrough on business counts by ZIP covers the Census API route.
What do you do when city data is missing?
City-by-industry cells are where public data thins out. CBB suppresses granular cells to protect privacy, and the Economic Census applies its own disclosure avoidance even when it supplies place-level business counts. Practitioners often blend public series with private data to get benchmarks they can actually use.
You have three honest options:
- Aggregate geography: widen to a custom region of neighboring places until the cell is published.
- Impute conservatively: estimate from a broader area and flag every imputed figure so a reviewer can see it.
- Buy granular data: license a professional report or API feed when the engagement cannot tolerate gaps.
When you evaluate a vendor, check these points:
- How many markets it covers.
- How finely it breaks down NAICS codes.
- Whether you can export an audit trail.
- Whether it documents its source lists.
Pro Tip: Treat suppression as a finding, not a failure. Note which cells were withheld and why, so the substitution you choose is visible in the workpapers.
If your client is preparing for a lender, a guide on funding with fair credit shows how benchmark evidence fits into a lender-ready profile. For metropolitan roll-ups, see our notes on MSA benchmarks.
How do accountants and advisors use these benchmarks with clients?
The same dataset serves several deliverables:
- Valuation: match NAICS and geography to build defensible comparables, then adjust with revenue per employee.
- Budgeting and forecasting: model labor costs from local wage percentiles and payroll trends.
- Loan underwriting: combine establishment counts, payroll and revenue per employee to test repayment capacity.
- Location analysis: compare custom regions rather than strict municipal boundaries, which gives a more realistic read on a site.
- Client benchmarking: show an owner how their payroll ratio and revenue per employee sit against local peers.
For wage-driven models, metro compensation tables split total compensation into wages and benefits, which helps when a client asks why labor cost rose faster than pay.
Why a defensible process beats a bigger dataset
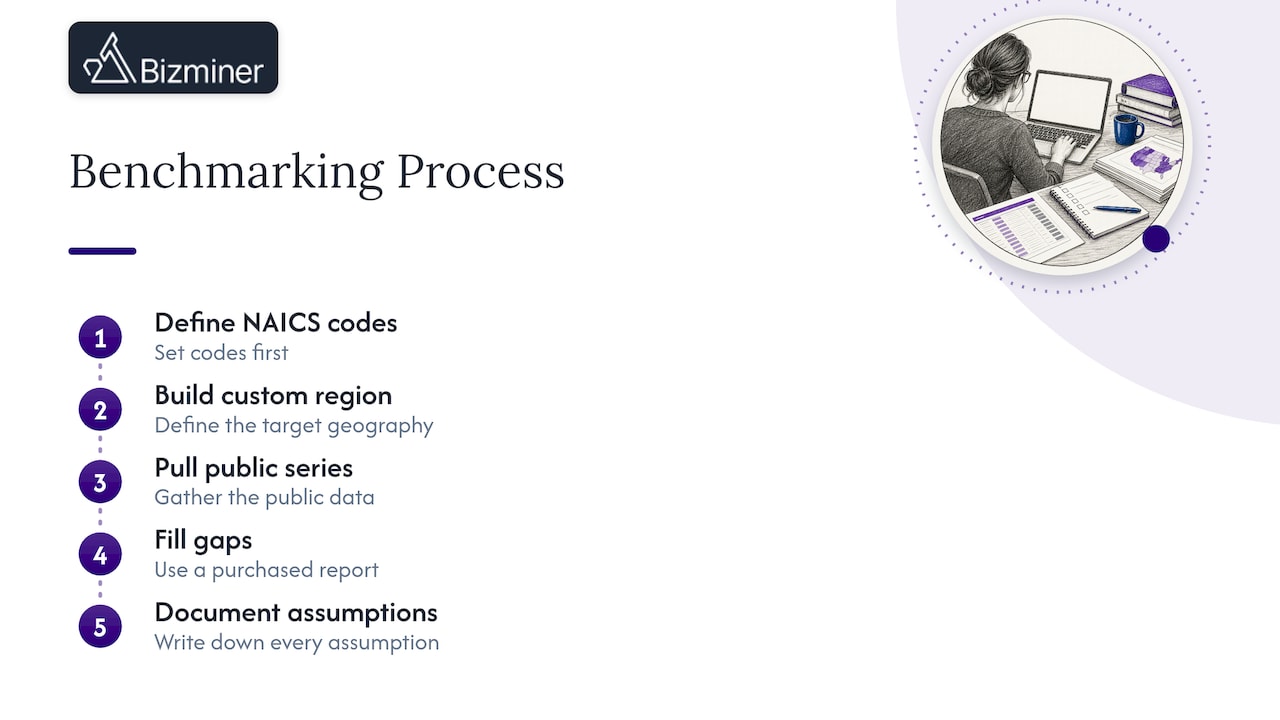
Here is how I run these engagements. I define the NAICS codes first, build a custom region second, pull the public series third, fill any gaps with a purchased report fourth, and write down every assumption last. Nothing about that order is clever, and that is the point. Reviewers rarely challenge a number that has a clear lineage. They challenge the one nobody can trace.
Bizminer offers market coverage. For audit-sensitive work, verify the data’s suitability and source lineage.
Pro Tip: Save every query, export file and substitution rationale in the same folder as the final workpaper.
— Danny
When should you buy a professional city-level report?
Buy when public cells stay suppressed at city-by-industry level, when a deadline is tight, when you need an exportable audit trail, or when you must cluster NAICS codes across many markets at once. In those cases we give you a direct, defensible route to the benchmark you need.

What we offer:
- Customizable industry financial reports built to NAICS depth, from our granular analysis reports.
- Reports that reflect data accepted in court and government contexts.
- A customizable API feed for pulling industry data by geography into your own tools.
- Market benchmarks added to custom financial reports.
Industry financial performance, market and company profile reports are each listed at $249 per report, and our financial, market, valuation and company reports are listed at $349 per report, on our pricing page. Order a custom report, request API access, or contact our sales team for a sample market profile.
FAQ
What are city industry benchmarks?
They are industry financial benchmarks broken out by city, covering measures such as employment, payroll and revenue per employee. Accountants use them to compare a client against local peers.
Why are some city industry figures missing?
Census tools apply disclosure avoidance, so granular industry-by-city cells are often suppressed to protect privacy. Widening to a custom region or adding a professional dataset closes most gaps.
How often does city-level business data refresh?
It depends on the series. Economic Census data updates about every five years, while County Business Patterns and Nonemployer Statistics update annually. Always record the vintage you used.
Should I use establishment or firm data?
Use establishment data for local operations and competition, and firm data for ownership and valuation. Confusing the two can distort a model.
Sources
- Frequently Asked Questions About Census Business Builder
- Bls
- Concepts : U.S. Bureau of Labor Statistics