Industry trend analysis is the continual practice of spotting and validating market and sector shifts so leaders can prioritize investments, mitigate risk, or reallocate resources before competitors do. It works when it’s tied to a specific decision, not curiosity. Analysts and executives who run it well use it to decide whether to enter a market, cut a product line, or shift budget, and they revisit it on a set schedule rather than once a year.
TL;DR:
- Tracking the direction, duration, and scale of trends helps distinguish between short-term spikes, cyclical patterns, and long-term structural shifts that require different responses.
- Using a four-factor scoring rubric—relevance, impact, timing, and uncertainty—enables teams to prioritize and act on signals before they fully materialize.
- Combining quantitative data like sales and search trends with qualitative signals such as hiring patterns and regulatory filings increases confidence in early trend detection.
- Clear decision thresholds and ownership, along with regular reviews and transparent communication, prevent analysis from becoming noise and ensure timely business actions.
- Granular benchmarks from sources like Bizminer facilitate validating directional signals with financial data specific to industry segments, supporting defensible decision-making.
Table of Contents
- What Is Industry Trend Analysis, and Who Actually Uses It?
- What Types of Industry Trends Should You Be Tracking?
- Which Frameworks Actually Work for Spotting Trends Early?
- Which Data Sources and Signals Actually Predict a Shift?
- How Do You Run an Industry Trend Analysis Step by Step?
- Where Does Trend Analysis Actually Change Business Decisions?
- What Mistakes Wreck an Industry Trend Analysis?
- How Bizminer Fits into a Defensible Trend Workflow
- How Do You Read Trend Analysis Results Without Overreacting?
- How Do You Communicate Trend Insights to Stakeholders Who Weren’t in the Room?
- Embedding Trend Analysis Into How Decisions Actually Get Made
- How Bizminer Helps Teams Turn Signals Into Defensible Numbers
- Sources
What Is Industry Trend Analysis, and Who Actually Uses It?
Industry trend analysis looks outward, at forces reshaping an entire sector: regulation, technology shifts, competitor movement, demand patterns. That’s different from internal performance analysis, which looks at your own sales figures, churn, or margins in isolation. The two feed each other, but confusing them is a common mistake. A company can be executing flawlessly on its own metrics while an entire industry moves out from under it.
The practice answers a narrow set of business questions:
- Should we enter or exit a market segment this year?
- Does our product mix need to shift to match where demand is heading?
- What should our demand forecast assume for the next two to four quarters?
- Where is capital, talent, or regulatory attention flowing, and does that change our risk exposure?
Trend analysis combines quantitative signals, like sales and search data, with qualitative ones, like hiring and filings, to catch a shift before it shows up in your own numbers. That combination matters because by the time a shift appears in your quarterly revenue, you’ve usually lost the head start.
Analysts and business advisors who need something firmer than a trend headline typically turn to industry-specific data providers. Bizminer’s industry research segments benchmarks by NAICS code, geography, and company size, which lets a directional trend get checked against actual financial performance in that exact category rather than a generic sector average.
What Types of Industry Trends Should You Be Tracking?
Not every trend deserves the same response, and classifying a signal correctly is half the analytical work. Three dimensions matter most.
Direction. A trend moves upward, downward, or horizontally. Upward trends signal growth, downward trends signal contraction, and horizontal trends signal a market holding steady over a long stretch. Horizontal isn’t neutral. It often means a category has matured, and the opportunity has shifted from growth to share capture.
Duration. A short-term spike, a seasonal pattern, or a long-term structural shift require entirely different responses:
- Short-term spikes (a viral product moment, a temporary supply shock) rarely justify a strategic pivot.
- Seasonal or cyclical patterns are predictable and should be built into forecasting models, not treated as news.
- Structural shifts (a technology replacing a category, a regulatory change that resets the rules) demand a real strategic response, often within one or two planning cycles.
Scale. Macro trends operate at the economy or policy level, the kind PESTEL frameworks are built to catch. Micro trends operate inside a category or customer segment, visible mainly to people close to that specific market.
Misclassifying a structural shift as a short-term blip is one of the more expensive analytical errors a team can make, because it delays the response until the window for cheap adaptation has closed.
Which Frameworks Actually Work for Spotting Trends Early?
PESTEL remains the most widely used starting point for macro scanning. It groups external forces into six categories: Social, Technological, Economic, Environmental, Political, and Legal. Running through each letter forces you to check blind spots that a purely sales-driven view misses. A legal change buried in a state regulatory filing rarely shows up in your CRM, but it can reshape your entire cost structure inside a year.
Horizon scanning goes a layer deeper. It’s the discipline of hunting for weak signals, early, ambiguous indicators, across sources that don’t normally talk to each other: conference agendas, obscure patent filings, hiring patterns in adjacent industries. Teams that write down their watchpoints in advance, rather than reacting to whatever crosses their desk, consistently spot shifts earlier than teams that wait for a headline.
Once signals are flowing in, you need a way to sort real threats from noise. A simple four-factor scoring rubric works for most teams:
- Relevance: does this touch our core business or an adjacent one?
- Potential impact: what’s the realistic upside or downside if this plays out?
- Timing: is this happening now, in 12 months, or in five years?
- Uncertainty: how confident are we in the signal itself?
Pro Tip: Score every trend on a 1 to 5 scale across all four factors before you debate it as a group. Teams that discuss impact before scoring almost always argue about the loudest trend in the room, not the highest-scoring one.
Governance ties it together: someone owns the scan, a defined group reviews scores on a set schedule, and watchpoints get revisited rather than filed away and forgotten.
Which Data Sources and Signals Actually Predict a Shift?
Quantitative and qualitative sources answer different questions, and the strongest trend analysis uses both.
On the quantitative side, watch:
- Internal sales trends against category benchmarks
- Search volume and query trends (Google Trends and similar tools)
- Financial benchmarks by industry and segment
- Patent filing volume in a technology category
- Regulatory filings, including SEC and 10-K disclosures for public competitors
On the qualitative side:
- Hiring patterns and job posting volume on platforms like LinkedIn
- Venture capital flows into a category or adjacent technology
- Regulatory proposals still in comment or draft stage
- Social listening for shifts in customer language and complaints
Triangulating across categories, regulatory activity plus hiring plus capital flow, raises confidence far more than any single source, no matter how strong that source looks on its own. A hiring spike alone might mean nothing. A hiring spike combined with a wave of new patent filings and a regulatory comment period in the same category is a much harder signal to ignore.
Automate what you can. Set alerts on EDGAR filings, Google Trends queries, and job board postings for your core watchpoints, so signals reach you instead of requiring a manual search every week. The goal isn’t more data. It’s fewer manual checks and faster confirmation when something real is moving.
How Do You Run an Industry Trend Analysis Step by Step?
A trend analysis that never connects to a decision is just an interesting report. Here’s a sequence that keeps it operational.
- Define the decision and the threshold. Before collecting anything, write down what result would actually make you act, whether it’s a 10% shift in category growth or a specific regulatory outcome. Skipping this step is the single most common reason analysis produces noise instead of direction.
- Set scope and KPIs. Pick the metrics that match the decision: total addressable market, compound annual growth rate, year-over-year change, share-of-voice, or cohort retention.
- Collect and clean data, then assign watchpoints. Pull from the quantitative and qualitative sources above, and name the specific indicators you’ll monitor going forward.
- Analyze. Run time-series decomposition to separate seasonal noise from real trend movement, segment the data by geography or customer type, and check cohort behavior over time.
- Score and prioritize. Apply the relevance, impact, timing, and uncertainty rubric, then sort trends into pilot, hedge, or full-commitment categories.
- Operationalize monitoring. Monthly tactical updates catch near-term shifts; quarterly strategic reviews revisit the bigger structural bets.
Pro Tip: *Assign a specific KPI threshold to each watchpoint before you start monitoring. “Watch construction permit filings” is vague.
This sequence works whether you’re evaluating a single market entry decision or running a portfolio-wide review across a dozen segments at once.
Where Does Trend Analysis Actually Change Business Decisions?
The value shows up differently depending on which function is using it.
- Strategy teams use trend analysis to decide whether to enter or exit a market, and how to weight capital across a product portfolio.
- Product teams use it to prioritize the roadmap, and just as often, to decide when to deprecate a feature or line that’s riding a downward trend rather than a temporary dip.
- Finance teams use category benchmarks to defend a forecast in front of a board or lender, replacing gut-feel projections with a comparable figure from the actual industry.
- Operations teams use directional signals to plan capacity ahead of demand shifts and to time channel changes, like moving budget from a declining retail channel to a growing digital one.
The common thread: trend analysis is only useful when it’s attached to a specific budget line, headcount decision, or go/no-go call, not a slide in a quarterly deck.
What Mistakes Wreck an Industry Trend Analysis?
Most failures trace back to a handful of habits, and all of them are avoidable.
- Starting with a vague question. “What’s trending in our industry?” produces a pile of interesting but unusable data. Start with the decision you need to make instead.
- Chasing vanity metrics. A spike in social mentions feels exciting but rarely predicts revenue. Anchor your KPIs to outcomes, not attention.
- Confirmation bias and single-source dependence. A trend confirmed by one source, especially one that supports what you already believed, isn’t confirmed at all. Require at least two independent categories of evidence.
- Cadence mismatch. Reviewing a fast-moving tech category once a year, or a slow-moving industrial category every week, wastes either the opportunity or the analyst’s time. Match your review rhythm to how quickly the sector actually moves.
How Bizminer Fits into a Defensible Trend Workflow
Directional signals tell you something is moving. They don’t tell you how much revenue, margin, or market share is actually at stake, and that’s where granular benchmarks earn their place in the process.
Bizminer provides industry financial benchmarks segmented by NAICS code, geography, and company size, along with customizable reports and API access to support data integration into various models. Granular NAICS-level benchmarks let an analyst take a directional trend, like rising input costs in a manufacturing subsegment, and translate it into an estimated earnings-at-risk figure specific to that category rather than a broad industry average.
Analysts typically plug this data in at three points in the workflow:
- Validation, checking whether a signal from search trends or hiring data actually shows up in category-level financial performance
- Scoring, using real margin or revenue data to firm up the “impact” score in a trend rubric rather than guessing
- Reporting, citing benchmark data that carries enough documentation to hold up with a lender, board, or, in some cases, in U.S. Tax Court
How Do You Read Trend Analysis Results Without Overreacting?
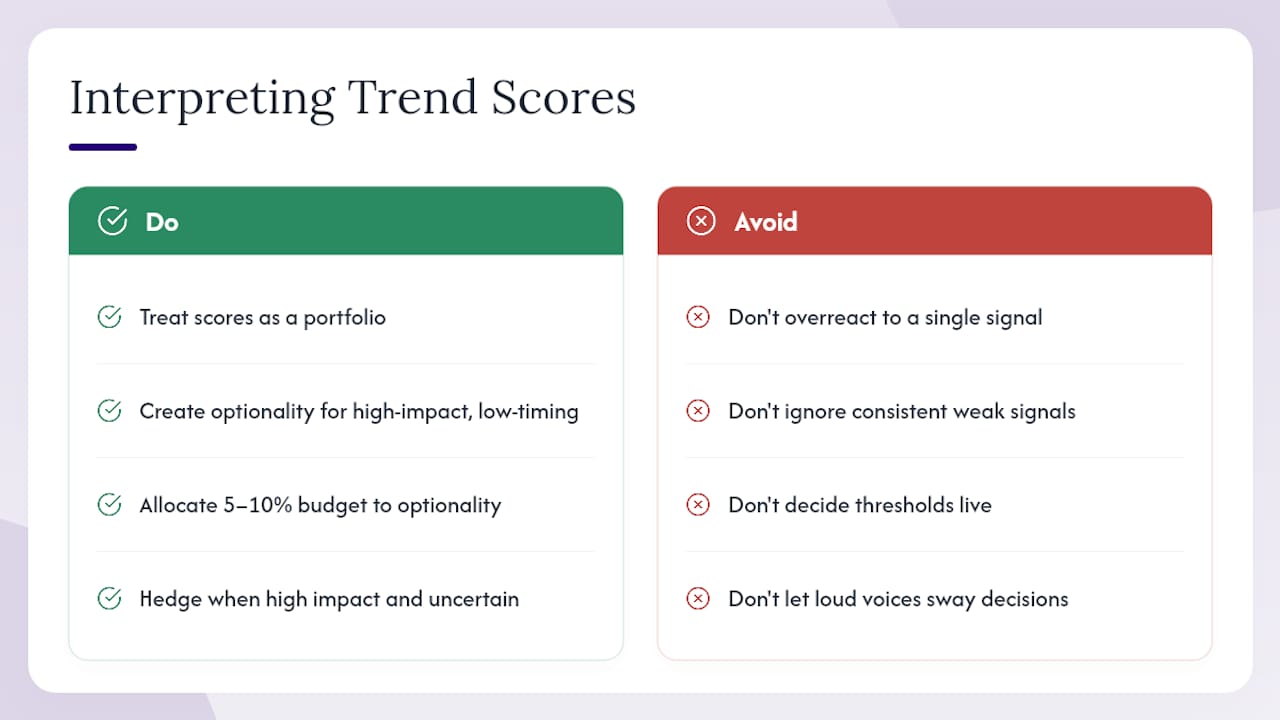
A trend score is a starting point for judgment, not a verdict that removes it. The interpretation step is where a lot of otherwise solid analysis goes wrong, usually in one of two directions: overreacting to a single strong signal, or ignoring a consistent pattern because no single data point looks dramatic on its own.
The better approach reads results as a portfolio, not a checklist. If three trends score high on impact but low on timing, that’s a signal to build optionality now (a pilot, a small budget allocation, a watch list) rather than commit fully. If a trend scores high on both impact and timing but carries high uncertainty, the right move is often a hedge: a reversible decision that limits downside while you gather more confirmation. Allocating a small share of your budget, often in the range of 5 to 10%, to these optionality bets preserves your ability to move fast without betting the business on an unconfirmed signal.
Context matters as much as the score itself. Weight every score against your actual exposure, not just its raw number.
Set a standing rule for what happens at each score tier before you’re staring at a live result: what triggers a pilot, what triggers a hedge, what triggers full commitment. Deciding those thresholds in the heat of a live signal is often influenced by the loudest person in the room, which can skew decisions.
How Do You Communicate Trend Insights to Stakeholders Who Weren’t in the Room?
A trend analysis that stays inside the analyst’s spreadsheet never changes a decision. Getting it in front of the people who allocate budget requires translating the finding into their language, not yours.
Executives and board members respond to financial framing, not raw trend scores.
Keep the presentation format proportional to the decision. A trend that supports a $5,000 tactical adjustment doesn’t need a twenty-slide deck. A trend that supports a market entry decision worth millions deserves a full write-up, including the raw signals, the scoring rationale, and a stated confidence level.
Always state uncertainty explicitly rather than burying it in a footnote. “We’re seeing early signs of X, with moderate confidence based on two independent sources” earns far more trust over time than a confident claim that later turns out to be wrong. Stakeholders remember overstated calls longer than they remember accurate but modest ones.
Finally, build a standing rhythm for updates rather than a one-time briefing. A short monthly note on active watchpoints, paired with a fuller quarterly review, keeps trend analysis visible as a working input to decisions instead of a report that gets read once and archived.
Embedding Trend Analysis Into How Decisions Actually Get Made
The teams that get real value from trend analysis treat it like a standing job, not a project. Someone owns the watchpoints. Someone reviews scores on a calendar, not when a crisis forces the question. That single change, assigning ownership and a cadence, does more for decision quality than any framework upgrade.
The other habit worth stealing: bias toward small, reversible bets while a trend is still uncertain. Full commitment before confirmation is how good analysis turns into an expensive mistake.
— Danny
How Bizminer Helps Teams Turn Signals Into Defensible Numbers
Bizminer is the practical next step once your team has a directional signal and needs a number that will hold up in a budget meeting, a loan application, or a board review. Rather than a generic industry overview, Bizminer builds benchmarks down to the NAICS code, so a trend affecting, say, electronic shopping retailers or industrial machinery manufacturers gets checked against financial data from that exact category and company size, not a broad sector average.

Accountants, business advisors, and financial institutions use this granularity to validate a signal before it becomes a client recommendation or a loan decision. Academic institutions use it for coursework that needs real, current industry data rather than textbook figures. Because the underlying data has been accepted in U.S. Tax Court, it carries a level of documentation that a general market blog post can’t match.
If your team has a trend flagged and needs the financial context to act on it, start with Bizminer’s market and industry research tools or request a custom report built around your exact segment and geography.
Sources
For deeper method detail, Qmarkets’ guide to trend analysis covers the quantitative and qualitative blend in more depth, and Finblog’s guide to spotting market trends offers a complementary practitioner view. Inside Bizminer, the market trend analysis guide and industry cluster analysis page walk through benchmarking in more technical detail.
- Trend Analysis: A Practical Guide to Methods & Strategy | Qmarkets
- Industry Trends Analysis: How Smart Teams Spot Shifts Before They Cost Them | Fluxel
- What Is Trend Analysis? Types & Best Practices | NetSuite