A data-driven company SWOT anchors every strength, weakness, opportunity, and threat to a verifiable metric instead of a hunch. The fastest way to start: pick 2 to 5 KPIs per quadrant, benchmark each against matched peers, and let the numbers assign the entry. Sources like SEC filings and platforms such as Bizminer supply the raw comparisons that make the exercise defensible.
TL;DR:
- Benchmark each SWOT claim against matched peers using current, verifiable data from sources like SEC filings, industry reports, and benchmarking platforms.
- Focus on 2 to 5 KPIs per quadrant, ensuring they are recent (within 12 to 18 months) and large enough in sample size to avoid skewed results.
- Validate strengths with VRIO questions to ensure they are valuable, rare, hard to imitate, and organizationally supported before building strategy around them.
- Use external signals such as hiring trends or regulatory filings to identify opportunities and threats before they appear in financial reports.
- Assign a dedicated owner to continuously update and review the SWOT based on fresh data, with at least quarterly refreshes for fast sectors to keep analysis relevant.
Table of Contents
- Why a Data-Driven SWOT Matters More Than the Traditional Version
- Which Data Sources and Signals to Collect
- Mapping Data to Each SWOT Quadrant
- Prioritize and Validate SWOT Findings With VRIO
- Common Pitfalls That Undermine a Data-Driven SWOT
- The Step-by-Step Workflow for a Data-Driven SWOT
- What the Data Actually Changes About Strategy Work
- How Bizminer Supports a Data-Backed SWOT
- Sources
- FAQ
Why a Data-Driven SWOT Matters More Than the Traditional Version
The classic SWOT session runs on whiteboard consensus. Someone says the company has “strong customer loyalty,” nobody challenges it, and the claim goes into the strengths box with zero evidence behind it. That’s how a mediocre retention rate ends up labeled a competitive advantage for three strategy cycles running.
Data breaks that pattern by forcing every claim to survive contact with a number. A retention rate around the typical industry range sounds fine until you learn the matched peer group averages higher. That “strength” just became a weakness, and the team never would have caught it without a benchmark to check it against.
Structured data does more than catch errors. It anchors SWOT findings and prevents subjective, intuition-only conclusions, which matters most when the stakes are high enough that a wrong call is expensive. A few scenarios make the data-first approach nearly mandatory:
- M&A screening. Buyers who skip financial benchmarking routinely overpay for “market leadership” that a peer comparison would have shown was average performance.
- Market entry decisions. Entering a new geography or segment based on gut feel about demand, instead of search trend data or industry reports, is how companies discover a market is saturated after they’ve already committed capital.
- Annual strategy resets. A board expects specifics, not adjectives. “We believe we’re well-positioned” doesn’t survive a serious budgeting conversation the way “our gross margin runs 4 points above the NAICS median” does.
The pattern in each case is the same: intuition sets a direction, and data either confirms it or stops you before you act on a false premise.
Which Data Sources and Signals to Collect
The raw material for a data-driven SWOT splits into two buckets: what the company already tracks internally, and what’s publicly or commercially available externally. Most teams already sit on more internal data than they use for strategy work.
Internal datasets worth pulling first:
- Financial KPIs: gross margin, operating margin, customer acquisition cost (CAC), churn rate, revenue per employee.
- Operational logs: fulfillment time, defect rates, support ticket volume and resolution speed.
- Product analytics: feature adoption, session frequency, conversion funnels.
- HR metrics: turnover rate, time-to-fill for open roles, engagement survey scores.
None of these mean much in isolation. That’s where external data earns its place.
External datasets that provide the comparison:
For public companies, SEC financial statement data sets offer standardized 10-K and 10-Q filings that support direct, time-series comparisons across competitors. These filings are free, audited, and about as close to ground truth as external data gets for any publicly traded rival.
For competitive signals below the SEC-filing threshold, analysts track price changes, product launches, and job postings. Competitive-intel practitioners note these signals often move faster than annual reports, which matters because a competitor’s hiring spree in a new product category tells you about their roadmap months before a press release confirms it.
Industry market reports and financial benchmarking platforms round out the picture. Bizminer’s industry financial benchmarks use size- and NAICS-matched comparators, which solves the single most common benchmarking mistake: comparing a $2 million regional business against national chains and drawing the wrong conclusion.
Freshness and sample size matter more than most teams assume. A benchmark pulled from data collected three years ago in a fast-moving sector is close to useless. Set a rule: if the underlying data is older than 12 to 18 months, flag it before you build a conclusion on top of it, and prefer sample sizes large enough that one outlier company doesn’t skew the median.
Mapping Data to Each SWOT Quadrant
Turning a spreadsheet into a SWOT entry means answering one question for every metric: compared to what, and by how much? Here’s how that plays out quadrant by quadrant.
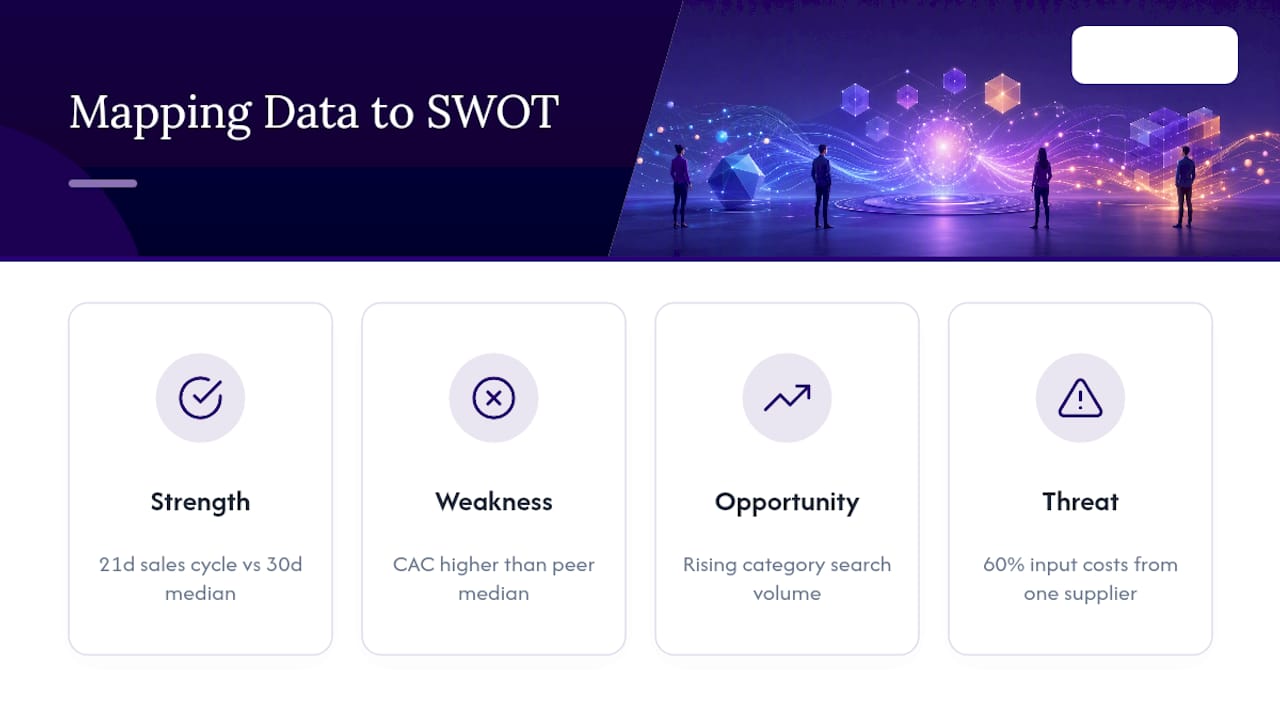
Strengths need a benchmark beat, not just a good number. A sales cycle of 21 days sounds fast, but it only qualifies as a strength once you know the industry median runs 30 days.
Weaknesses show up as a persistent gap against matched peers. If a company’s CAC runs much higher than the median for its NAICS code and revenue band, that’s not a rough quarter. That’s a structural weakness in the acquisition funnel, and it deserves more scrutiny than a single line in a SWOT deck.
Opportunities live in leading indicators, not lagging ones. Rising search volume for a product category, a competitor exiting a regional market, or a segment where existing players have thin coverage all point toward unclaimed demand before the revenue numbers confirm it. By the time the opportunity shows up in quarterly earnings, three competitors have already moved on it.
Threats show up as investment and concentration signals. A rival’s job postings for a new engineering team, a wave of new regulatory filings in your sector, or 60% of input costs tied to a single supplier are all threats that data surfaces well before they hit the income statement.
A short mini-case makes the pattern concrete. A regional accounting firm assumed its “boutique service” was a strength worth marketing hard. A benchmarking pull showed its realization rate (billed hours actually collected) sat below the peer median, while its average fee per client sat above it. The real strength wasn’t service, it was pricing power. That’s a materially different message to put in front of a board than the one the team walked in with.
Pro Tip: Require a citation for every SWOT entry before it goes on the slide. If nobody can point to the metric and its source, the item goes back to the “needs evidence” pile instead of the strategy deck.
Prioritize and Validate SWOT Findings With VRIO
A SWOT with 20 data-backed entries is still useless if leadership can’t tell which three actually matter. That’s the gap VRIO closes. SWOT and VRIO work as a pair: SWOT surfaces the candidate strengths, and VRIO tests which of them are worth building a strategy around.
Run every strength through four questions in sequence:
- Value. Does this capability let the company exploit an opportunity or neutralize a threat? If the “strength” doesn’t actually affect competitive position, it’s not strategically relevant, however true it is.
- Rarity. Do competitors lack this capability too? A fast sales cycle that every competitor in the sector also has isn’t a differentiator, it’s table stakes.
- Imitability. How hard and expensive would it be for a rival to copy this? A proprietary dataset or a decade-long customer relationship is hard to imitate. A discount pricing structure is not.
- Organization. Is the company actually structured to exploit this advantage, or does it sit there unused? A great dataset nobody analyzes doesn’t create value on its own.
A strength that clears all four tests is a genuine basis for strategy. One that fails “rarity” or “imitability” might still be worth defending operationally, but it shouldn’t anchor a five-year plan.
For opportunities and threats, a simpler rubric works: score each on impact (1 to 5) and likelihood (1 to 5), then multiply. Anything scoring 15 or above gets escalated to a real initiative with an owner and a timeline. Anything below 6 goes on a watch list and gets revisited next cycle, not acted on immediately.
Before any item leaves the workshop, run it through a short checklist: Does it have a cited source? Is the benchmark peer group matched by size and industry code? Has at least one stakeholder outside the team that found it reviewed the claim? Items that fail any of the three go back for more work, not into the final deck.
Common Pitfalls That Undermine a Data-Driven SWOT
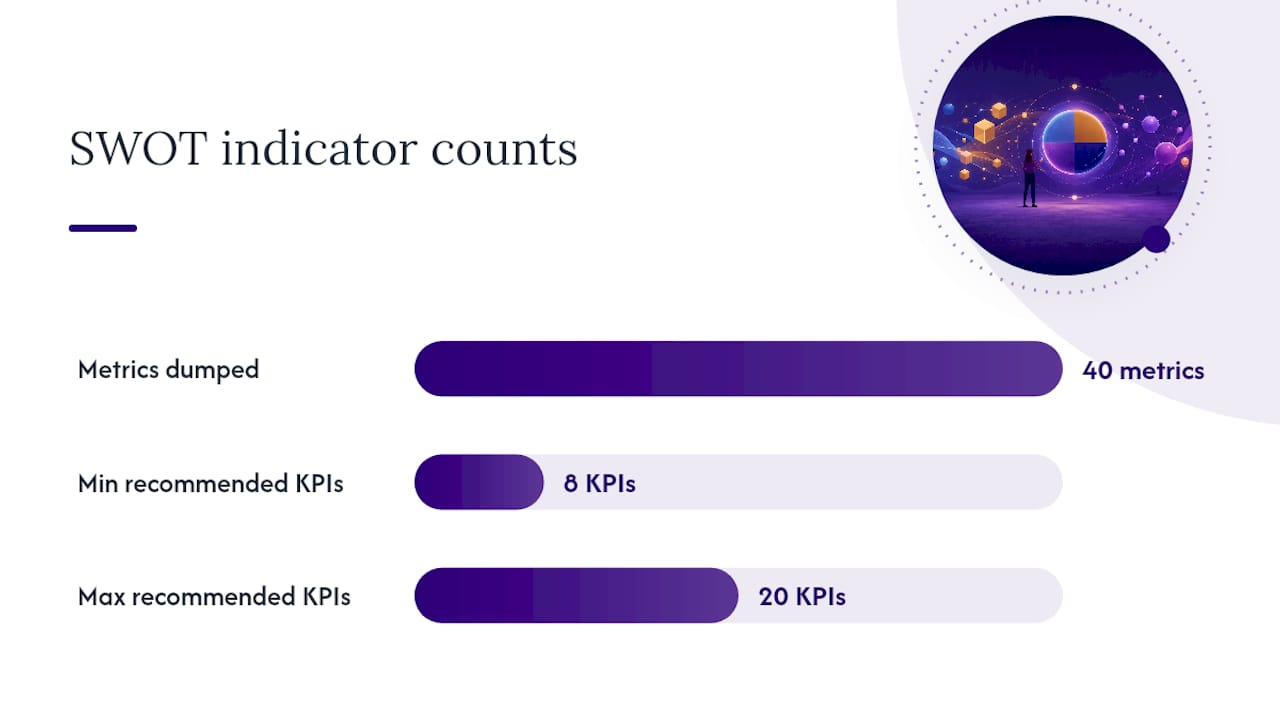
The most common failure mode isn’t a lack of data, it’s too much of it. Teams dump 40 metrics into a workshop and produce a SWOT nobody can act on, because a focused indicator set of 2 to 5 KPIs per quadrant prevents that paralysis and keeps the exercise usable.
A handful of other mistakes recur often enough to name directly:
- Mismatched benchmarks. Comparing a regional service business to a national enterprise chain on margin or CAC produces a conclusion that’s technically accurate and practically meaningless.
- Stale data treated as current. A benchmark from before a sector-wide disruption (a new regulation, a pricing war) can point the team in exactly the wrong direction.
- Confirmation bias with no source requirement. If a claim doesn’t need a citation to reach the SWOT, the team will unconsciously favor data that supports what leadership already believes.
- The wrong visual for the message. A pie chart for a trend, or raw numbers with no comparison line, buries the insight instead of highlighting it. Bar charts work for comparisons, line charts for trends over time, heat maps for geographic spread.
- No refresh owner. A SWOT built once and never revisited is a historical document by the next board meeting.
Pro Tip: Assign one named owner to the SWOT document itself, not just to the initiatives that come out of it. A living document with nobody responsible for updating it dies within two quarters.
Anonymize anything sensitive (specific client names, exact salary figures) before the SWOT circulates beyond the core team. That single habit prevents a strategy document from turning into an HR or legal problem later.
The Step-by-Step Workflow for a Data-Driven SWOT
Running this well doesn’t require a specialized analytics team. It requires a sequence, and most teams can move through it inside a single quarter.
- Prepare. Define the scope (whole company, one business unit, one product line), name the stakeholders who need to sign off on the findings, and agree on 2 to 5 KPIs per quadrant before anyone starts pulling numbers.
- Collect. Assign a data owner to each KPI. Internal metrics usually come from finance or product analytics; external ones come from SEC filings, industry reports, or a benchmarking platform like Bizminer’s company profiles.
- Analyze. Benchmark every internal number against a matched peer group, build one clear visual per finding, and assign each result to its quadrant based on whether the company beats, matches, or trails the comparison.
- Validate. Run every strength through VRIO, score opportunities and threats on impact times likelihood, and get at least one outside reviewer to challenge the findings before they’re finalized.
- Act and monitor. Convert the top-scoring items into initiatives with named owners and deadlines, then set a refresh cadence, quarterly for fast-moving sectors, biannual for slower ones, so the SWOT stays current instead of becoming a one-time exercise.
The workflow only works if step four actually happens. Skipping validation is how a data-driven SWOT quietly turns back into the same intuition-driven exercise it was supposed to replace.
What the Data Actually Changes About Strategy Work
Most of the advice on SWOT analysis treats data as a nice-to-have layer on top of a fundamentally qualitative exercise. That framing gets it backward. The data isn’t decoration on the SWOT, it’s the filter that decides whether an entry belongs on the page at all.
The part conventional advice underweights is validation. Plenty of guides will tell you to “use data” and stop there, as if pulling a metric automatically makes a conclusion correct. It doesn’t. A benchmark against the wrong peer group is worse than no benchmark, because it creates false confidence. That’s why pairing SWOT with VRIO matters more than the data collection step itself. Collection tells you what’s true. VRIO tells you what’s actually worth building a strategy around.
If there’s one thing worth prioritizing first, it’s the source discipline, not the analysis sophistication. A team with three well-sourced, correctly benchmarked metrics per quadrant will out-strategize a team with forty ungrounded ones every time. Start narrow, verify hard, and expand only once the process proves itself.
— Danny
How Bizminer Supports a Data-Backed SWOT
Bizminer provides tools for benchmarking, company profiling, and building the evidence base a SWOT needs before anyone commits budget to a strategy. It offers data segmented by industry, geography, and company size to support matched-peer comparisons.

For the “collect” and “analyze” steps in the workflow above, Bizminer offers a Company Profile report for $249 one-off and a full Company Report for $349 one-off, both built to slot straight into the benchmarking stage of a SWOT. Analysts building a competitive set for the threats quadrant can pull a Tier 1 Prospect List starting at $0.65 per record, and teams that need ongoing access can look at a Bizminer subscription for recurring benchmarking work. Bizminer’s data has been accepted in U.S. Tax Court and is used by government agencies, a level of scrutiny that matters when a SWOT finding is going to justify a real budget decision. Check current pricing and report options on the Bizminer pricing page to find the format that fits your next strategy cycle.
Sources
For primary datasets and frameworks referenced above: the SEC’s financial statement data sets for public-company filings, MindTools’ VRIO analysis guide for strength validation, and Visual Paradigm’s practical guide to SWOT data analysis for structuring the exercise. For readers exploring how automated signal detection fits into this process, this piece on AI-driven insights in business strategy is worth a look.
- SEC financial statement data sets
- Stop guessing market position: data-driven SWOT guide (Visualize AI)
FAQ
What Is McDonald’s SWOT Analysis?
A data-driven version would anchor strengths like global scale and brand recognition to metrics such as revenue per unit and same-store sales growth, weaknesses to labor cost trends, opportunities to digital ordering adoption rates, and threats to competitor menu pricing shifts, all benchmarked against matched quick-service peers rather than described qualitatively.
What Are 5 Examples of Strengths in SWOT Analysis?
Data-backed strengths typically include a sales cycle meaningfully shorter than the peer median, a gross margin above the industry benchmark, a churn rate below matched competitors, revenue per employee that outpaces the sector, and a customer acquisition cost well under the NAICS average.
How Is VRIO Different From SWOT?
SWOT identifies strengths, weaknesses, opportunities, and threats broadly, while VRIO takes the strengths SWOT surfaces and tests each one for value, rarity, imitability, and organizational support to determine which are actually worth building strategy around.
What Is Starbucks SWOT Analysis?
A data-driven approach would tie strengths like brand loyalty to repeat-purchase rates and average ticket size, weaknesses to store-level cost benchmarks, opportunities to emerging market search trend growth, and threats to competitor store expansion and coffee commodity price volatility, each checked against a matched industry benchmark instead of general impressions.
How Often Should a Company Refresh Its SWOT Analysis?
Most practitioner guides recommend a quarterly refresh for fast-moving industries and a biannual one for slower-moving sectors, treating the SWOT as a living document rather than a one-time exercise.