Get NAICS segmented, percentile based benchmarks from a granular data vendor or a credible industry association study, then immediately compare your target KPI to the cohort median while checking the sample size behind it. That single move separates a useful benchmark from a decorative one.
Your primary sources should include:
- NAICS-coded datasets that segment by industry code, revenue band, and geography
- Industry association studies published annually or semi-annually
- Specialized data vendors such as Bizminer that publish full percentile distributions rather than a single average
Once you have a number, don’t just eyeball it against your own. Confirm the cohort size, check whether the benchmark’s accounting definitions match yours, and only then decide whether the gap is real or an artifact of mismatched methodology.
Key Takeaways
Reliable KPI benchmarking depends on matching a transparent, appropriately sized peer group to your specific business question, then treating the result as a diagnostic starting point rather than a final verdict.
| Point | Details |
|---|---|
| Start with the business question | Pick 3 to 5 KPIs that directly answer it instead of defaulting to convenient metrics. |
| Check cohort size before trusting a number | Treat benchmarks built on small cohorts as directional, not precise. |
| Normalize before comparing | Convert to per-unit metrics (per store, per FTE) when peer groups mix business models. |
| Read distributions, not single numbers | Compare your KPI to the median and the 75th percentile, not just an average. |
| Use a sample-transparent data source | Bizminer’s NAICS-segmented reports disclose percentile ranges and sample size across 9,000+ markets. |
Table of Contents
- KPI Benchmarks by Industry: Which Metric Categories Matter Most
- How to Choose a Peer Group and Normalize the Data
- Reading Percentiles, Distributions, and Trends Correctly
- Data Quality Checks Before You Trust a Benchmark
- A Five-Step Workflow for Running a Benchmarking Analysis
- Common KPI Benchmarks Across Major Industries
- Where Industry KPI Benchmarks Fall Short
- How Often Benchmarks Get Updated, and Where to Find Reliable Ones
- Get Sample-Transparent Benchmarks Built for Your Exact Peer Group
- Sources
KPI Benchmarks by Industry: Which Metric Categories Matter Most
Every industry has its own vocabulary of ratios, but the underlying questions analysts ask are the same across sectors: are we profitable, are we efficient, are we retaining the right customers, and are we staffed correctly. Grouping KPIs by these questions makes cross-industry benchmarking far less confusing.
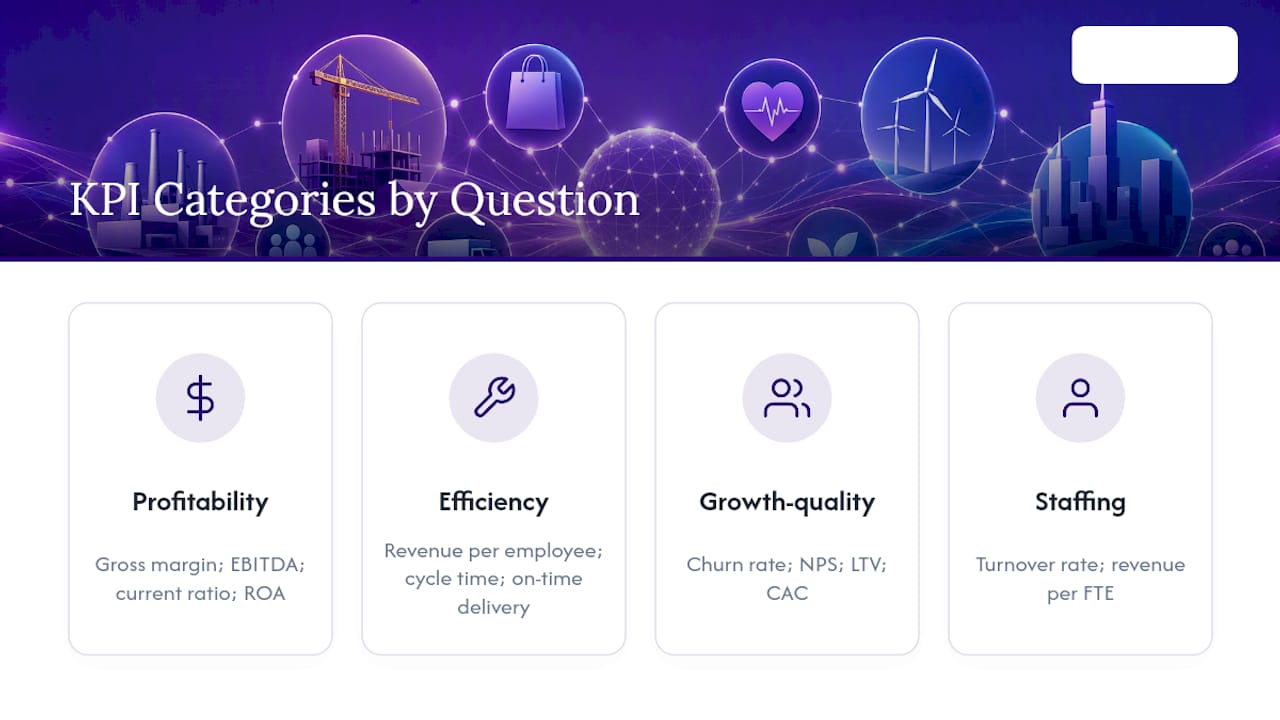
Financial metrics answer the profitability and solvency question. Gross margin tells you what’s left after direct costs; EBITDA margin strips out financing and accounting noise to show core operating performance; the current ratio flags short-term liquidity risk; return on assets (ROA) measures how efficiently the balance sheet generates profit. Industry-specific financial ratios work best in combination. A strong margin paired with a weak current ratio tells a very different story than strong margin plus strong liquidity.
Operational metrics answer the efficiency question: revenue per employee, cycle time, on-time delivery rate. These numbers vary enormously by business model, so they’re most useful compared within a tight peer group rather than against a broad industry average.
Customer metrics answer the growth-quality question: churn rate, Net Promoter Score (NPS), lifetime value (LTV), and customer acquisition cost (CAC). A business can grow revenue while quietly bleeding customers, and these metrics catch that.
HR metrics answer the staffing question: turnover rate and revenue per full-time equivalent (FTE) employee.
Picking which KPIs to benchmark starts with the business question, not the metric that happens to be handy. If the board wants to know whether the company can absorb a downturn, liquidity ratios matter more than growth metrics. If the question is whether a sales team is understaffed, revenue per FTE and cycle time carry the answer. You can check exact ratio definitions in the financial ratios glossary before comparing figures across sources.
How to Choose a Peer Group and Normalize the Data
Industry-level benchmarks work well when your business looks like the average company in that NAICS code. Once your revenue, headcount, or operating model drifts from that average, a tighter peer group beats a broad industry number every time.
- Start broad with NAICS or industry-level data to get a sense of the general range.
- Narrow to a peer group matched on revenue band, headcount, operating model (franchise vs. independent, e-commerce vs. brick and mortar), seasonality, and geography.
- Normalize for scale: convert absolute figures into per-unit metrics like revenue per store, cost per customer, or profit per FTE.
- Strip outliers that would skew a small cohort, and adjust for known accounting differences, such as capitalized vs. expensed R&D.
- Confirm the comparison is genuinely like-for-like before drawing any conclusion.
Financial benchmarking works best when you combine both approaches: an industry-wide view for context, and a peer group selected on the characteristics that actually drive your cost structure. A regional retailer with 12 locations doesn’t behave like a national chain with 1,200, even if both share the same four-digit NAICS code.
Pro Tip: When a cohort mixes business models, normalize by unit first, per store, per FTE, per customer, then benchmark the normalized figure. Comparing raw totals across mixed models almost always produces a misleading gap.
Reading Percentiles, Distributions, and Trends Correctly
A median tells you where the middle of the pack sits, nothing more. Treat every benchmarked metric as a distribution, not a single target number. Different percentile levels often require fundamentally different operating approaches rather than just “more effort” with the same strategy.
Here’s what that looks like in practice:
- If your revenue per employee sits at the 40th percentile, first check whether the gap comes from headcount, pricing, or product mix
- Build a KPI tree that decomposes the aggregate number into its drivers: revenue per employee breaks down into retention, average deal size, and labor productivity
- Layer your own historical trend line under the external percentile so you can tell a structural gap from a temporary blip
A five-point percentile gap that has persisted for eight consecutive quarters is a structural problem. The same gap that appeared once, during a seasonal trough, usually isn’t.
Benchmarking variance functions as a diagnostic signal, not an automatic verdict. Sitting below median isn’t inherently bad, and sitting above it isn’t automatically good. Both require a look at the drivers underneath before anyone acts on the number.
Data Quality Checks Before You Trust a Benchmark
A benchmark is only as good as the sample behind it, so always verify data origin and quality to ensure reliability.
Run these checks before acting on any figure:
- Confirm the cohort size, as small cohorts can lead to unreliable results.
- Prefer recent data, especially for fast-moving sectors where older averages may no longer be relevant.
- Use sources that disclose methodologies and how metrics are defined and outliers handled.
- Avoid pitfalls like incorrect peer sets, mismatched metric definitions, and generic averages not tailored to your specific analysis.
Benchmarking projects frequently fail for exactly these reasons, not because the underlying concept is flawed, but because the inputs weren’t scrutinized before the comparison started.
A Five-Step Workflow for Running a Benchmarking Analysis
This sequence works whether you’re benchmarking one KPI or building a full scorecard for leadership.
- Define the business question first, then pick three to five KPIs that actually answer it. Don’t start with whatever metric is easiest to pull.
- Choose your peer group and data source, and record the NAICS code and sample size you’re working from so anyone reviewing your analysis can check your work.
- Normalize the metrics: compute the median and 75th percentile for the cohort, and lay your own multi-period trend line alongside it.
- Diagnose the gap using a KPI tree, and estimate roughly what closing that gap would be worth in revenue or cost savings before you commit resources.
- Set banded targets, a realistic near-term goal and a stretch goal, and define how often you’ll revisit the numbers: monthly for operational KPIs, quarterly for financial ones.
This structure keeps the analysis honest. It’s easy to find a favorable-looking benchmark; it’s harder to build one that survives a second look from your CFO.
Common KPI Benchmarks Across Major Industries
Benchmark ranges shift meaningfully by sector, which is exactly why an industry-agnostic average is close to useless for target-setting.

Manufacturing analysts typically watch on-time delivery rate, capacity utilization, and gross margin, since thin margins mean small operational slips show up fast in profitability. Retail benchmarking centers on inventory turnover, same-store sales growth, and revenue per square foot, metrics that barely apply outside brick-and-mortar or e-commerce contexts. Healthcare organizations track days in accounts receivable, bed occupancy or patient throughput, and operating margin, shaped heavily by reimbursement cycles and regulatory reporting requirements. Finance and insurance firms benchmark loss ratios, return on equity, and expense ratios, categories with almost no equivalent in the other four sectors.
The point isn’t to memorize every ratio for every sector. It’s to recognize that the right KPI set for one industry can be nearly meaningless in another, which is exactly why NAICS-level segmentation matters more than a generic “industry average” pulled from a broad, undifferentiated database. A financial services benchmark set against a general “services” cohort will mislead more often than it helps.
Where Industry KPI Benchmarks Fall Short
Benchmarks are useful precisely because they’re external, and that same distance from your business is also their biggest limitation.
Published averages reflect a moment in time and a specific cohort definition that may not match your situation. A benchmark built from public company filings, for instance, skews toward larger, more mature businesses and won’t map cleanly onto a five-location regional operator. Accounting differences compound the problem: one company’s “operating expense” is another’s “cost of goods sold,” and a benchmark that doesn’t disclose its definitions can quietly compare apples to oranges.
Seasonality and business-model mix create further distortion. A benchmark that blends franchise and independent operators, or e-commerce and brick-and-mortar retailers, produces a median that describes neither group accurately. Small cohorts amplify this risk, since a handful of outlier companies can shift the median or the 75th percentile more than analysts expect.
None of this makes benchmarking useless, but it does mean a benchmark answers “where do we stand relative to a defined group under stated conditions,” not “what should we do.” Custom benchmarks built around your own strategic question and a deliberately chosen peer group consistently outperform generic industry averages for exactly this reason. Lenders evaluating a small business loan face the same challenge, weighing performance data against context rather than a single number, as outlined in this overview of performance based lending criteria.
How Often Benchmarks Get Updated, and Where to Find Reliable Ones
Update frequency varies by source and by how fast the underlying sector moves. Government and NAICS-based datasets typically refresh annually, tracking the natural cycle of tax filings and census data. Specialized vendors that aggregate private company financials, including Bizminer, often update more frequently, since they pull from a continuous stream of filings rather than a single annual survey.
Fast-moving sectors like technology and retail lose relevance quickly. A margin benchmark from three years ago in e-commerce, where fulfillment costs and ad spend efficiency shift year to year, tells you very little about today’s competitive environment. Slower-moving sectors, like utilities or certain manufacturing subsegments, can rely on benchmarks that are a year or two old without much distortion.
The most reliable sources share three traits: they disclose their sample size, they explain how they define each metric, and they update on a stated, predictable schedule rather than an occasional refresh. Industry associations, government NAICS datasets, and specialized data platforms that publish methodology notes all clear that bar. A source that hands you a single average number with no cohort size or update date attached is a source you should treat with real skepticism, regardless of how authoritative it looks.
Author perspective: practical rules of thumb
Benchmarks diagnose, they don’t prescribe. A gap versus median only tells you where to look, never what to do. Pair peer benchmarking with your own trend lines before committing real budget, and rough out the payoff of closing a gap before you prioritize the project. Skip that math, and you’ll chase averages instead of results.
— Danny
Get Sample-Transparent Benchmarks Built for Your Exact Peer Group
A generic industry average leaves you guessing about sample size and methodology. Bizminer solves that by covering more than 9,000 markets segmented by NAICS code, with full percentile distributions instead of a single number, so you can see the median, the top quartile, and the cohort size behind every figure.

Analysts and advisors can pull custom reports, connect through API access, or search a specific NAICS segment directly through the industry search tool, all with methodology notes attached so you can defend the numbers to a client or a partner. That transparency matters more than it sounds: Bizminer’s data has been accepted in U.S. Tax Court and is used by government agencies, a bar most off-the-shelf averages never have to clear. If you’re building a client-facing benchmarking model or setting internal targets, start with the market and industry research tool and pull a report for your exact NAICS segment today.
Sources
- The biggest benchmarking mistakes and pitfalls you must avoid
- Financial benchmarking
- How to use industry-specific financial ratios for more accurate company analysis in 2025
- Industry benchmarking as a growth lever