Combine Census ZIP Code Business Patterns for establishments and payroll, American Community Survey ZCTA tables or IRS SOI data for households and income, and a demand index like Esri’s Market Potential to translate those counts into spending. The reliable sequence is to define the market, pick the right geography, pull the metrics, calculate a range, and validate against at least one independent source before you trust the number.
TL;DR:
- Combining Census business, household, and income data with a demand index requires creating a range estimate, not a single point, for accuracy.
- Using mismatched geographies like ZIP codes and ZCTAs can distort results unless aggregated or crosswalked to a common boundary such as a county.
- Validation against larger geographies, presenting scenarios with assumptions, and documenting data vintage are essential to credible ZIP-level market estimates.
- For high-stakes or legal situations, commissioning audited reports from sources like Bizminer ensures reliability over rough DIY analysis.
- Card transaction data is useful as a directional indicator but should always be paired with demographic and income data for a defensible market sizing.
Table of Contents
- Step-by-step workflow from defining the market to a validated estimate
- Dataset reference: summary levels, fields, and access methods
- Geography pitfalls and how to correct them
- Tools and techniques for pulling and joining the data
- Limitations, validation checks, and communicating uncertainty
- When DIY market sizing is enough, and when it is not
- Bizminer: for analysts who need an audited, ZIP-ready report
- FAQ
- Sources
Step-by-step workflow from defining the market to a validated estimate
A ZIP-level estimate holds up only when the steps behind it are documented and repeatable.
- Define the market and NAICS codes. Decide exactly what counts as a sale: a product category, a service line, or a set of NAICS codes that represent competitors and substitutes.
- Choose the right geography for each dataset. Business data runs on 5-digit ZIP codes (summary level 861), while demographic tables run on ZCTAs (summary level 860); note which one you are pulling before you merge anything.
- Fetch the base inputs. Pull establishments, employment, and payroll from CBP/ZBP, households and population from ACS/ZCTA, and AGI and returns from IRS SOI, then add Esri MPI for demand.
- Convert counts to spend or addressable customers. Multiply households by a per-household spending rate, or apply the MPI as a multiplier against the national average to get a localized demand figure.
- Adjust for cross-boundary flows. Shoppers, patients, and clients rarely stay inside ZIP lines, so account for seasonal swings and the reality that demand often pools across several ZIPs rather than one.
- Validate with sanity checks. Compare your ZIP total against the county aggregate it rolls up into, present a low and high scenario instead of one number, and write down every assumption behind the math.
Pro Tip: Build your estimate as a range, not a point figure. A $2.1 million to $2.8 million market size survives scrutiny; a single number invites someone to pick it apart.
Dataset reference: summary levels, fields, and access methods
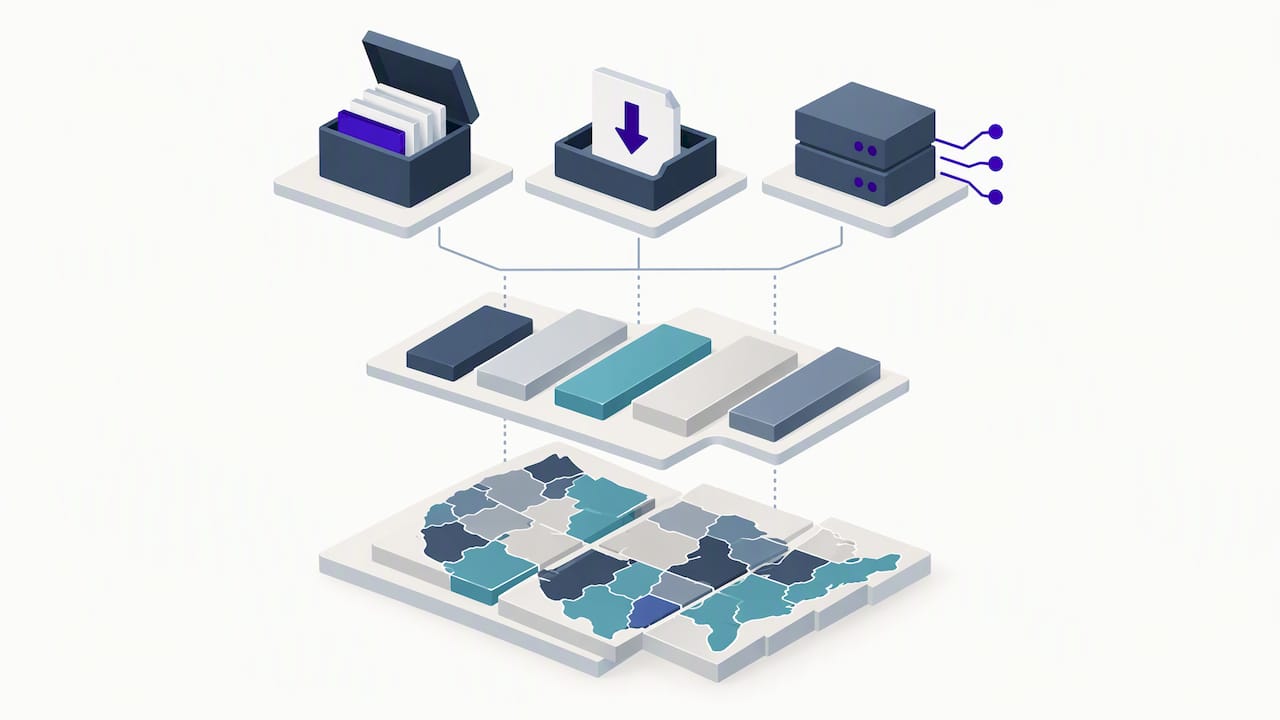
Knowing the exact field names and access points saves hours of guesswork once you sit down to pull data.
A few practical notes separate a clean pull from a confusing one:
- ZBP updates annually but on a lag, so this year’s figures typically reflect the prior year’s business activity.
- ACS 5-year estimates are the standard choice for small geographies like ZIP codes because 1-year estimates are too noisy at that scale.
- IRS SOI data trails by roughly two tax years, which matters when you are benchmarking against a live market.
- Esri’s MPI is a ranking and multiplier tool, not a raw sales number, so treat 100 as the midpoint and read everything else relative to it.
Geography pitfalls and how to correct them
The most common error in ZIP-level analysis is quietly mixing two different geographies and assuming they match. A USPS ZIP code is a mail-delivery route that can change shape without notice, while a ZCTA is a Census Bureau approximation of that ZIP built from stable statistical boundaries, as the Bureau explains in its guidance on finding ZIP-level data. Business data lives at summary level 861, demographic data at summary level 860, and pulling both without checking which is which produces totals that do not reconcile.
- Align mismatched summary levels by aggregating to the larger shared unit, such as a county, or by applying a published ZIP-to-ZCTA crosswalk.
- Flag special-purpose ZIPs, like PO boxes or single-organization codes for a large employer or government building, since they carry almost no residential population and will distort a household-based estimate.
- Build an aggregated trade area or consumption zone instead of relying on one ZIP, especially for retail or infrequent-purchase categories.
BEA research on consumption zones finds that spending routinely crosses ZIP and county lines, which is why a single postal boundary rarely reflects the real market for a product or service.
Tools and techniques for pulling and joining the data
You do not need an enterprise GIS budget to run this workflow, though the right tool speeds things up considerably.
- Pull raw data from data.census.gov, the CBP/ZBP API, IRS SOI CSV downloads, and Esri’s documentation for MPI access.
- Map and join the data in ArcGIS, QGIS, Python’s geopandas library, Tableau, or an Excel mapping add-in, depending on your team’s existing stack.
- Join everything on ZCTA or ZIP code, and keep a lineage sheet recording the source, retrieval date, and any transformation applied to each field.
- Use MPI as a per-household multiplier, and normalize totals on a per-capita basis whenever you compare one ZIP against another.
Pro Tip: Keep your joins in a single spreadsheet tab labeled by source and date. Six months from now, you will not remember which ACS vintage you used, and a client or auditor will ask.
Limitations, validation checks, and communicating uncertainty
Every dataset in this workflow has a blind spot, and naming it upfront makes your estimate more credible, not less. ACS figures carry sampling error that widens as the geography shrinks, IRS and Census data both lag by a year or more, and near-real-time card-transaction indicators from BEA are not necessarily representative of the full population they claim to describe.
- Triangulate across at least two independent sources and reconcile your ZIP total against the county it rolls into.
- Present a low and high scenario rather than a single figure, with assumptions written out next to each number.
- Disclose data vintage and known gaps directly in the deliverable instead of burying them in a footnote.
- Escalate to an audited, third-party report when the sample size is thin, or when the estimate needs to hold up in a lending decision, a tax filing, or a legal proceeding.
When DIY market sizing is enough, and when it is not
Analysts and lenders lean on ZIP-level sizing constantly, whether it is a bank assessing a branch’s trade area or an advisor scoping a client’s expansion. The public workflow above gets you most of the way there, and for internal planning it is often sufficient.
The gap shows up when the number has to survive outside scrutiny: an IRS audit, a tax court filing, or buy-side diligence on an acquisition. Bizminer builds its market and industry reports from larger, sourced samples specifically because those situations do not tolerate a rough estimate with undocumented assumptions.
— Danny
Bizminer: for analysts who need an audited, ZIP-ready report
When the DIY workflow runs into thin samples or a deadline that will not wait for a six-dataset triangulation, a custom report built on Bizminer’s sourced, larger-sample data gets you a defensible number without the assembly work.

- Industry Market and Industry Financial Performance reports deliver benchmarks already segmented by NAICS and geography.
- Market Report and Company Report go deeper for diligence or valuation work.
- Tier 1, Tier 2, and Tier 3 Prospect Lists turn a market-size finding into an outreach list.
Choose Bizminer over the full DIY build when the output needs to be audit-ready or when the clock matters more than the exercise. Browse the full pricing and report catalog to find the right fit.
FAQ
What is the best way to estimate market size by ZIP code?
Combine Census ZBP/CBP establishment and payroll data with ACS or IRS SOI household and income figures, then apply a demand index like Esri’s MPI to convert those counts into an addressable market. Validate the result against a larger geography, such as the county, before treating it as final.
What is the difference between a ZIP code and a ZCTA?
A ZIP code is a USPS mail-delivery route that can shift boundaries without notice, while a ZCTA is a Census Bureau statistical approximation of that ZIP built for consistent reporting, as described in the Bureau’s ZIP-level data guidance. Business data uses summary level 861 for 5-digit ZIP codes, while most demographic tables use summary level 860 for ZCTAs.
Why do ZIP-level market estimates need adjustment for consumption zones?
Spending routinely crosses ZIP and county lines, so a single postal boundary can understate or overstate the real market for a product. BEA’s consumption zone research recommends aggregating adjacent ZIPs into a trade area for industries where customers travel to shop.
When should I buy a custom report instead of building the estimate myself?
Commission an audited report when the ZIP sample is too thin for a reliable public-data estimate, or when the number needs to hold up in a lending decision, tax filing, or legal proceeding. Reports like Bizminer’s Market Report or Company Report, priced at $349 per report through its pricing page, are built for exactly those situations.
Can I use card-transaction data alone to size a ZIP-level market?
No, card-transaction data should be used as a directional signal rather than a standalone estimate, since BEA’s near-real-time spending research notes these series are not necessarily representative of the full population. Pair it with Census, ACS, or IRS data for a defensible figure.