For establishment counts and sales by location, use the Economic Census. For current employment and wages, use the QCEW. For regional economic output, use BEA’s GDP by state and county series. The rule: match the dataset to the decision metric, not the other way around.
TL;DR:
- Matching data sources to the decision metric is essential; use Economic Census for revenue or establishment counts, QCEW for employment and wages, and BEA GDP for regional economic contribution.
- Data at finer geographic levels often comes with less industry detail, and suppressed cells indicate protected data that should be treated as estimates rather than zeros.
- QCEW provides near real-time county employment data with quarterly updates, while the Economic Census offers structural benchmarks every five years.
- Comparing counts from different NAICS vintages or mixing suppression indicators without documentation leads to inaccuracies and must be carefully managed.
- Paid, pre-processed reports can save time and ensure accuracy when building large or repeated analyses, especially under tight deadlines.
Table of Contents
- Datasets at a glance: what Census, QCEW, and BEA provide
- How to choose the right dataset for your question
- Programmatic retrieval and practical workflow
- Geographic levels, NAICS detail, and comparability issues
- Interpreting missing or suppressed cells and quality checks
- Practical tradeoffs and when paid data makes sense
- How Bizminer helps: custom reports, NAICS search, and API access
- Primary federal sources and documentation
- Sources
- FAQ
Datasets at a glance: what Census, QCEW, and BEA provide
Each federal source answers a different business question, and confusing them is the most common mistake in geographic market analysis.
The Economic Census counts firms, establishments, employees, payroll, and sales or value of shipments for employer businesses, built on 2022 NAICS codes. It runs on a five-year cycle, so it works best as a structural benchmark rather than a current snapshot. Coverage and NAICS detail vary by sector, and data is published for the nation, states, and selected smaller geographies.
QCEW, published by BLS, tracks establishment counts, employment, and wages by county, metro area, state, and nation. It covers workers under state unemployment insurance laws and federal employee programs, and because it releases quarterly and annually, it is the better choice when a client needs something closer to real time.
BEA’s GDP by state and county series measures value added, meaning the dollar contribution an industry makes to output in a place. This is conceptually distinct from establishment counts or sales figures, since two regions with identical revenue can have very different value-added profiles depending on cost structure.
A simple way to match the source to the task:
- Market sizing by revenue or establishment count: Economic Census.
- Wage benchmarking or labor market monitoring: QCEW.
- Regional economic scale or industry contribution to a local economy: BEA GDP by state or county.
Mixing these up, say, citing Economic Census employment figures as a substitute for current QCEW wage data, produces numbers that are technically sourced but practically wrong for the question being asked.
How to choose the right dataset for your question
Before pulling any numbers, decide what you are actually trying to measure. A clear process prevents wasted queries and mismatched comparisons later.
- Define the decision metric first: are you sizing a market by revenue, assessing workforce size, or measuring economic contribution?
- Pick the NAICS vintage and geographic granularity you need before you query anything, since switching mid-analysis forces a rebuild.
- Check each dataset’s update frequency against your deadline. QCEW moves quarterly; the Economic Census moves every five years.
- Assess disclosure risk for your target NAICS code and geography. Narrow industries in small counties are more likely to be suppressed.
- When a dataset can’t deliver the detail you need, fall back to a higher-level aggregate or a complementary source rather than forcing a bad fit.
Common red flags worth catching early: comparing counts drawn from different NAICS vintages (2017 versus 2022 definitions are not always equivalent), treating suppressed cells as zeros, and comparing establishment counts directly against GDP figures as if they measured the same thing. Each of these mistakes is invisible in a spreadsheet until a client or reviewer asks where a number came from.
Programmatic retrieval and practical workflow
A repeatable workflow saves time whether you are building one report or feeding a recurring client pipeline.
- Pick your NAICS code and vintage, then confirm it exists in the dataset’s covered years.
The Economic Census API documentation lists supported variables and geographies with example query patterns for pulling NAICS-specific counts programmatically. - Choose your area identifier, typically a FIPS code, and your aggregation level (county, MSA, state).
- Query the API or download the CSV. QCEW’s downloadable files include quarterly and annual workbooks going back to 1990, with structured fields like area_fips, industry_code, and disclosure_code.
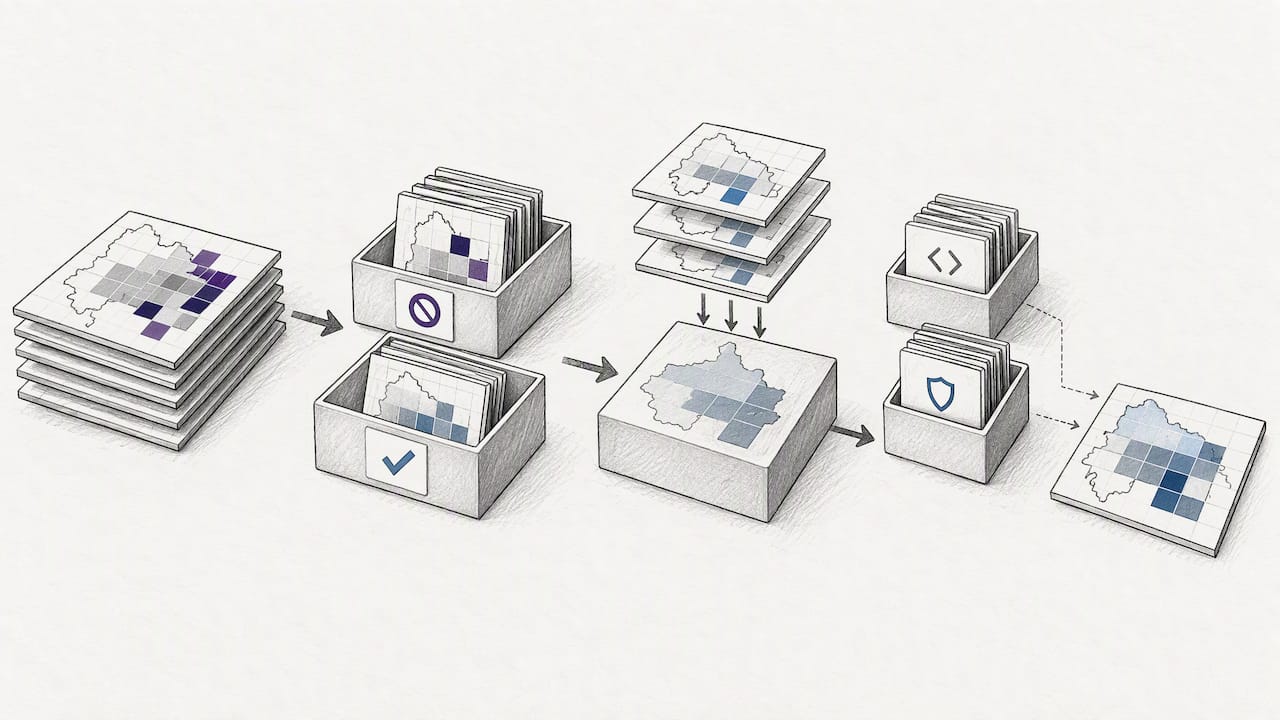
- Check disclosure flags before trusting any cell. A blank or flagged value means the figure was suppressed, not that the activity doesn’t exist.
- Join the results to boundary files or demographic data only after confirming the industry and geography codes match across sources.
- Reconcile your sums against published national or state totals. If your county-level sum doesn’t roughly match the published state aggregate, you likely have an extraction or join error.
For teams building this kind of pipeline from scratch, a practical data collection guide on reproducible retrieval methods covers similar ground for financial research use cases. Preserving the original codes, rather than renaming fields to something more readable, keeps the pipeline stable as source files update year over year.
Geographic levels, NAICS detail, and comparability issues
Geographic granularity and industry detail trade off against each other, and the tradeoff differs by dataset.
- The Economic Census publishes data for the nation, states, and selected geographies, with NAICS detail that narrows as geography narrows. A six-digit NAICS code available nationally may only be published at a two or three-digit level for a small county.
- QCEW offers county, MSA, state, and national detail with generally finer NAICS granularity preserved across geographies, since its employer-based reporting structure supports more consistent breakdowns.
- BEA’s county GDP estimates are built by distributing state totals down to counties using indicator data, then reconciling back to state totals, so they are reliable for regional scale comparisons but not a substitute for establishment-level detail.
When comparing two places with different population sizes or economic bases, raw counts mislead. A location quotient, which compares a region’s industry concentration to the national average, or a per capita measure, usually tells a more honest story than comparing two raw numbers side by side. Readers working through clustering questions can see how concentration metrics apply in practice through industry cluster analysis.
Interpreting missing or suppressed cells and quality checks
Suppressed data is not missing data. Disclosure avoidance rules exist because agencies cannot publish figures that would let someone identify an individual business’s performance, so when a cell is too concentrated among one or two firms, it gets withheld or rounded rather than shown.
The Economic Census’s own methodology documentation explains how these protections vary by NAICS code and geography, and the same principle applies across QCEW and BEA products. Treat a blank cell as “protected,” not “zero.”
Handling suppressed data defensibly means documenting every instance where it occurs, using a higher level of aggregation to estimate scale instead of guessing, and never silently imputing a number without a footnote explaining how you got there.
Pro Tip: Keep FIPS codes, NAICS codes, and disclosure flags in your working dataset even after you’ve built your final report. They’re what let you, or anyone reviewing your work later, retrace exactly how a figure was derived.
Practical tradeoffs and when paid data makes sense
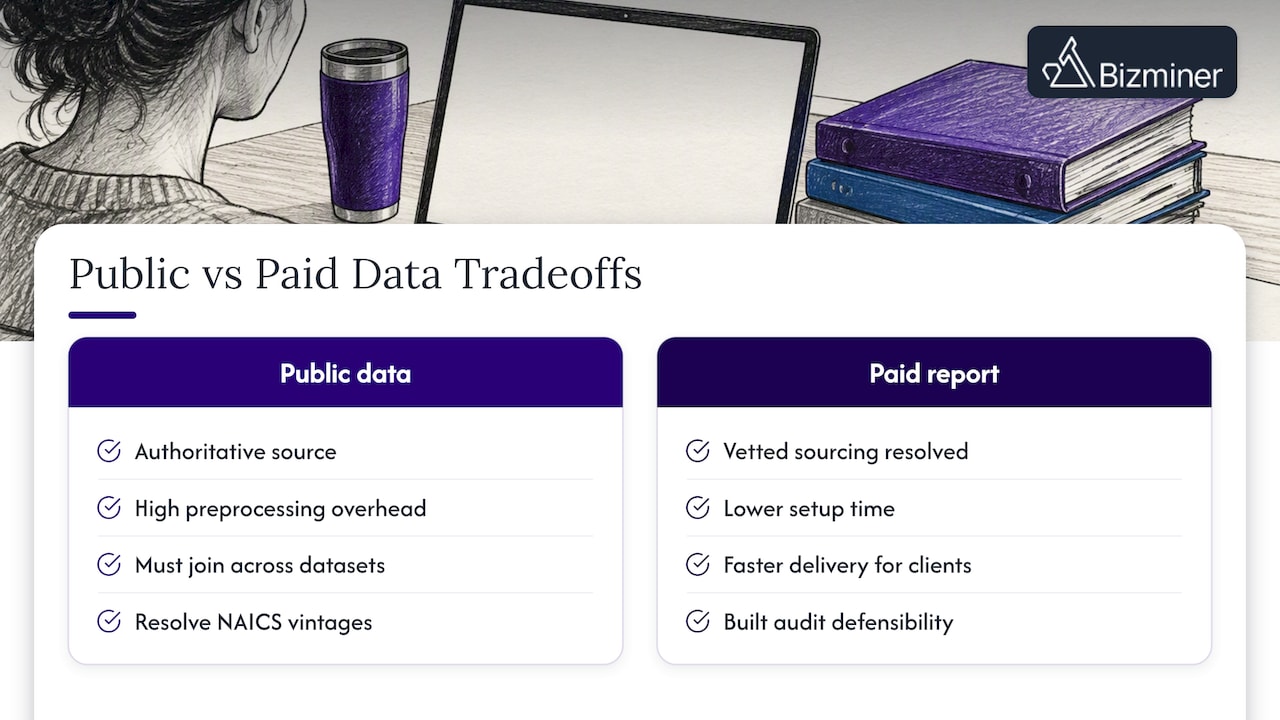
Public federal data is authoritative, but it takes real work: joining across datasets, resolving NAICS vintages, and documenting suppression. That overhead is fine for a one-off research project. It gets expensive fast when a client needs five markets analyzed by Friday.
When speed and audit defensibility both matter, a vetted paid report with the sourcing already resolved is often the more practical call than rebuilding the same pipeline from scratch.
— Danny
How Bizminer helps: custom reports, NAICS search, and API access
Bizminer builds the join work into the product: custom financial data profiles, industry and market reports, a NAICS search tool, and API access covering more than 9,000 markets segmented by industry, geography, and company size.

Bizminer’s data is designed to meet high standards for accuracy and reliability, which matters when a benchmark needs to hold up under scrutiny, not just look right in a slide deck. Where assembling public data means weeks of cross-referencing NAICS vintages and disclosure flags yourself, a Market Report or Industry Financial Performance report gets you comparable detail in a single purchase. For recurring pipelines, the Customizable API feed plugs the same granularity directly into your own workflow. Start with Market & Industry Research Analysis to see which report fits your next client deliverable.
Primary federal sources and documentation
- Economic Census: Summary Statistics (2022)
- Economic Census API documentation
- QCEW overview
- QCEW downloadable data files
- BEA GDP by state and local area methodology
Sources
- Economic Census: Summary Statistics for the U.S., States, and Selected Geographies: 2022
- Quarterly Census of Employment and Wages (QCEW) — BLS
- BEA GDP-by-state methodology
- Economic Census API developer documentation
FAQ
Which federal dataset is best for employment data by county?
QCEW is the standard source for county-level employment and wage data, since it updates quarterly and covers most wage and salary workers under state unemployment insurance systems. The BLS QCEW program publishes downloadable files by county, MSA, and state.
How often is the Economic Census updated?
The Economic Census runs on a five-year cycle, with the most recent reference year being 2022. Between cycles, analysts typically turn to QCEW or BEA data for more current figures.
What does a suppressed or blank cell in QCEW or Census data mean?
A suppressed cell means the data was withheld to protect the identity of individual businesses, not that there was no activity. Agencies document these disclosure rules, and analysts should treat suppressed figures as protected rather than estimate them without clear documentation.
Can I compare GDP figures directly to establishment counts?
No. GDP measures value added, or the dollar contribution an industry makes to output, while establishment counts measure the number of business locations. BEA’s GDP-by-place methodology treats these as distinct concepts that require separate interpretation.