For U.S. retail gap analysis, we estimate resident demand using BEA and BLS consumer-expenditure shares and estimate captured supply using Census Monthly Retail Trade, then calculate unmet demand as demand minus supply. This formula works best as a screening tool for trade-area opportunities, not a final verdict, so every gap needs a validation pass before it drives a leasing or expansion decision.
TL;DR:
- Use Census Monthly Retail Trade for supply, BEA state PCE for resident demand, and BLS Consumer Expenditure tables for household spending patterns and variance.
- Align geography, period, price basis, and merchandise classification before subtraction; Census advance estimates arrive about 10 business days after month end and are later revised.
- Reconcile categories spanning multiple NAICS codes, choose nominal or inflation adjusted dollars consistently, and account for online and visitor sales distorting local supply.
- Treat gaps as hypotheses: BLS suppresses Consumer Expenditure estimates with relative standard errors of 25% or higher, and small trade areas may need custom data.
Table of Contents
- What Data Sources Should Anchor a Retail Gap Model?
- How Do You Calculate a Retail Gap for a Trade Area?
- Why Do Mismatched Categories and Timing Create False Gaps?
- How Reliable Is a Gap Number, and When Is It Actionable?
- What Should a Retail Gap Report Actually Include?
- How Bizminer Supports Rigorous Retail Gap Analysis
- What I’ve Learned Running Retail Gap Numbers
- Put This Workflow to Work With Bizminer Reports
- FAQ
What Data Sources Should Anchor a Retail Gap Model?
A sound gap model rests on three federal data families, each answering a different half of the equation. Mixing them without understanding what each one measures is the most common reason gap numbers turn out wrong.
The Census Monthly Retail Trade and Food Services survey is the backbone of the supply side. It reports establishment-level sales, inventories, and inventory-to-sales ratios by NAICS code, and it runs on a two-stage release schedule: an advance estimate about 10 business days after month-end, followed by a regular estimate roughly six weeks later that incorporates more complete survey responses. Advance figures move first and get revised, so treating them as final is a frequent source of false gaps.
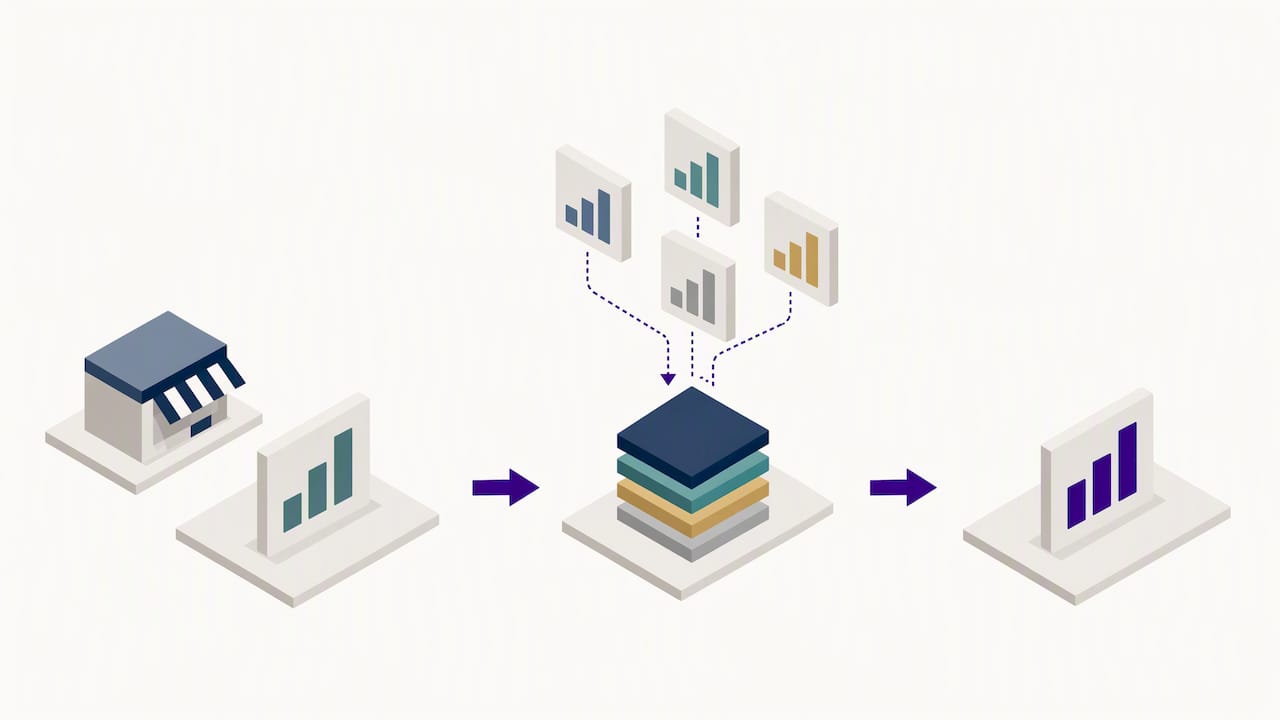
On the demand side, BEA state personal consumption expenditures give resident spending by category and by state, with annual, quarterly, and monthly detail. PCE data answer “how much do residents of this state spend on this category,” which is the demand half of the formula before any trade-area scaling happens.
The BLS Consumer Expenditure Survey fills in the texture that state-level PCE cannot: household-level spending patterns broken out by income, age, and region, along with the variance measures needed to judge how much confidence to put in a narrow category estimate. CE tables are where an analyst finds the expenditure share that gets applied to local population and income to produce a trade-area demand figure.
Beyond these three, a few supporting sources round out the picture:
- The Economic Census adds finer establishment counts and payroll detail in years it runs, useful for cross-checking category totals.
- Local sales tax receipts, when a jurisdiction publishes them by category, offer a fast reality check on captured supply.
- Private datasets (credit card panels, foot-traffic providers, point-of-sale aggregators) can fill small-area gaps that public surveys suppress, at the cost of transparency about sampling.
Each source answers a specific question. Supply comes from what retailers actually report selling; demand comes from what households report spending. The gap between them is only meaningful once both sides share the same geography, time period, and category definition, which is the subject of the workflow below.
How Do You Calculate a Retail Gap for a Trade Area?
Calculating a defensible gap number is a sequence, not a single formula. Skipping a step is how analysts end up presenting noise as opportunity.
- Define the trade area. Choose a drive-time ring, a fixed radius, or a custom polygon based on how customers actually travel to the category in question; a convenience category needs a tight 5-minute drive-time ring, while a furniture store might justify a 20-minute radius.
- Build the NAICS crosswalk. Map the BEA PCE category and the BLS CE item group to the matching Census retail NAICS code. According to BLS documentation on the gap formula, demand and supply figures must share geography, time period, price basis, and merchandise classification before they can be subtracted from each other.
- Estimate resident demand. Take the relevant BLS CE expenditure share for the category, scale it by local population and income from Census or BEA sources, and cross-check the result against state-level PCE for the category.
- Estimate captured supply. Pull establishment sales for the matching NAICS code from Census Monthly Retail Trade, scaled to the trade area using establishment counts or employment as a proxy where trade-area-level sales are not directly published.
- Calculate the dollar gap and percent gap. Dollar gap equals demand minus supply; percent gap equals the dollar gap divided by demand. A trade area with $40 million in estimated demand and $31 million in captured supply has a $9 million dollar gap, or a 22.5% percent gap.
- Run validation checks. Confirm population and income inputs against a second source, map existing competitors in the category, estimate online sales leakage, adjust for seasonality, and flag which inputs came from advance versus benchmarked releases.
The BLS Consumer Expenditure report for 2024 recommends exactly this sequence: define the trade area and crosswalk first, estimate demand and supply from the matching federal sources, calculate the gap, then validate against population, income, online sales, seasonality, and site-level constraints before treating a number as actionable.
Pro Tip: Run the same gap calculation twice, once with the advance Census release and once with the regular release, to see whether your conclusion survives the revision.
Why Do Mismatched Categories and Timing Create False Gaps?
Most “phantom” retail gaps trace back to three reconciliation errors rather than a genuine market opportunity.
- Category mismatch. A PCE category like “food and beverages purchased for off-premises consumption” does not map one-to-one to a single NAICS code; grocery, convenience, and warehouse club sales all contribute pieces of it. The BEA’s retail-control method exists specifically to reconcile PCE category growth to Census retail-control growth, and skipping that reconciliation step inflates or deflates the apparent gap.
- Timing mismatch. Comparing an advance monthly Census figure against an annual BEA PCE estimate compares two different vintages of reality. Build a revision flag into every report: mark which inputs are preliminary and re-run the calculation once benchmarked figures arrive.
- Price basis mismatch. Nominal dollars and inflation-adjusted dollars cannot be subtracted from each other. Pick one basis, nominal is usually simpler for a current-year screening exercise, and apply it consistently across both demand and supply figures.
- Non-store and visitor sales. E-commerce fulfilled from outside the trade area and spending by commuters or tourists both distort a local gap. A category with heavy online penetration, like electronics or general merchandise, often shows a smaller true local gap than a naive calculation suggests, because some of the “missing” supply is being captured online rather than left unmet.
Fixing these four issues before publishing a gap number eliminates most of the false positives that show up in a first-pass screen.
How Reliable Is a Gap Number, and When Is It Actionable?
A gap figure is only as trustworthy as the variance behind its inputs, and treating every positive number as a real opportunity is the fastest way to waste a site-selection budget.
BLS Consumer Expenditure tables flag estimates with a relative standard error of 25% or higher for suppression, a threshold BLS documents in its variance guidance, which means any gap built on a narrow category or a small trade area needs its underlying CE and Census inputs checked against that threshold before the number is trusted.
Beyond the official variance figures, a few practical rules of thumb help separate a real opportunity from statistical noise:
- Require the dollar gap to exceed the combined sampling uncertainty of the demand and supply inputs, not just a positive sign.
- Set a minimum threshold, often a percentage of total category sales in the trade area, below which a gap is not worth acting on.
- Cross-check against local sales tax receipts where the jurisdiction publishes category-level detail.
- Map competitor footprints directly; a gap that disappears once a new competitor’s recent opening is accounted for is not a gap at all.
- Run a handful of phone or online checks on nearby stores for stock-outs or wait times as a cheap, fast sanity test before committing to field research.
When a trade area is small enough that standard federal sources suppress the relevant category, that is the signal to commission custom, address-level data rather than stretch a national average past its useful resolution.
What Should a Retail Gap Report Actually Include?
A gap report earns its keep only when it gives a decision-maker enough structure to act, not just a single headline number.
At minimum, the table backing any gap finding should carry a NAICS code, a plain-language category label, estimated demand, estimated supply, the dollar gap, the percent gap, a variance or RSE indicator, and a short note on any crosswalk assumptions used to map categories.
| NAICS code | Category label | Estimated demand | Estimated supply | Dollar gap | Percent gap |
|---|---|---|---|---|---|
| — | Supermarkets and grocery stores | $40 million | $31 million | $9 million | 22.5% |
Three visualizations make the table usable at a glance: a ranked bar chart of dollar gap across categories to show where the biggest opportunities sit, a heat map of the trade area to show where leakage to nearby competitors concentrates, and a time series showing how the gap has moved across recent releases, which doubles as the revision-tracking view described earlier.
Online and visitor-driven sales deserve their own columns rather than being folded into the main gap figure, since conflating them with true unmet local demand is one of the pitfalls already covered. Every cell that depends on a federal series should carry a source and release-date note, advance versus regular Census estimate, PCE vintage year, so anyone reviewing the report later can judge how fresh the underlying numbers are.
How Bizminer Supports Rigorous Retail Gap Analysis
We built our retail trade industry pages and report library around exactly the inputs this workflow requires: NAICS-level financial benchmarks, market sizing, and company-level detail across more than 9,000 markets segmented by geography and business size.
The data service provides the fields a gap table needs without requiring an analyst to assemble them manually from multiple federal releases:
- NAICS-level industry financial benchmarks that populate the demand and supply columns for a specific trade area.
- A NAICS search tool for building the category crosswalk described in the workflow above.
- Prospect lists that can be used for mapping competitor footprints during the validation step.
- A customizable API feed for teams that want to pull report fields directly into their own models.
The data is prepared to meet standards important for audit or due-diligence review when using gap findings for decision-making.
What I’ve Learned Running Retail Gap Numbers
Sampling noise alone can produce that range even when the market is genuinely saturated. The correction is simple: before presenting a gap to a decision-maker, ask whether it clears both the variance threshold on the inputs and a minimum dollar size that justifies the cost of acting on it.
The second lesson is about communication. Stakeholders want a single number, but the honest answer is always a range plus a confidence note. I present the dollar gap alongside the RSE and let the range speak for itself rather than rounding uncertainty away.
Pro Tip: Call two or three nearby stores in the category before committing budget; a quick stock-out or wait-time check often confirms or kills a gap faster than another data pull.
— Danny
Put This Workflow to Work With Bizminer Reports
Running the steps above by hand across every category in a trade area takes real time. We built our report library so analysts can skip the manual federal-data assembly and get NAICS-level demand and supply figures, crosswalks, and competitor lists in one purchase.
A few starting points, depending on what stage your analysis is at:
- Pull a sample from our retail trade industry page to see benchmark fields before committing to a full report.
- Request a custom financial report built around your specific trade area and NAICS codes.
- Check current report and prospect list pricing to scope a project before you start.
For financing questions that come up during site-selection work, the SBA size standards checklist is a useful reference on eligibility thresholds tied to market-entry decisions.
FAQ
What is retail gap analysis data?
Retail gap analysis data is the combination of demand estimates (from sources like BEA state PCE and BLS Consumer Expenditure tables) and supply estimates (from Census Monthly Retail Trade) used to calculate unmet demand in a trade area. The formula is demand minus supply, expressed as both a dollar figure and a percent of total category demand.
How do I choose between Census, BEA, and BLS data?
Use Census Monthly Retail Trade for supply-side estimates of what retailers actually sold, BEA state PCE for state-level resident demand by category, and BLS Consumer Expenditure Survey tables for household-level spending patterns and the variance measures needed to judge small-area reliability. Each source answers a different piece of the gap formula, so most analyses need all three.
How often is Census retail trade data updated?
Census Monthly Retail Trade data releases an advance estimate about 10 business days after month-end, followed by a regular estimate roughly six weeks later once more survey responses are collected. Analysts should flag which version fed a gap calculation and re-run it once the regular estimate replaces the advance figure.
What causes a false retail gap?
False gaps usually come from mismatched NAICS categories between PCE and Census data, comparing preliminary advance estimates against benchmarked annual figures, inconsistent price basis between nominal and real dollars, or ignoring online and visitor sales that capture demand outside the physical trade area. Reconciling category definitions and timing before subtracting supply from demand removes most of these false positives.
Can small businesses use retail gap analysis for site selection?
Yes, gap analysis is a common screening tool for site selection and market expansion, though narrow categories or small trade areas often hit suppression thresholds in public data due to high relative standard error. In those cases, supplementing standard federal sources with a custom, more granular report, such as a NAICS-level market report, gives a more reliable basis for the decision.