The SBA publishes a lot of loan data, and most of it is free. You can download loan-level 7(a) and 504 records, read fiscal-year performance tables and pull lender reports. What the SBA does not publish is a clean, defensible answer to the question a credit analyst or advisor usually asks: how do borrowers in this industry, of this size, in this market actually perform? This guide covers what the public sources give you, where they stop, and how to close the gap.
TL;DR
- The SBA’s own sites cover program volume, loan-level 7(a) and 504 records, and charge-off and recovery tables by fiscal year. They are the right starting point and they cost nothing.
- Public SBA data describes SBA-backed loans only. It does not tell you how a whole industry, or a company of a given size, performs financially.
- Some demographic and business-type fields are voluntary, so treat those segments as reporting trends, not a census.
- Lenders, accountants and advisors who need industry financial benchmarks they can defend pair SBA program data with industry-level financial data.
- The cumulative 7(a) and 504 limit is now $10 million, which makes industry-specific underwriting more important for larger, capital-heavy deals.
Table of Contents
- What the SBA publishes, and where to find it
- Questions the public data answers well
- Where SBA data stops
- What changed in 2026: the $10 million limit
- Matching the data to the job
- Perspective: why we treat SBA data as one input, not the answer
- Working with industry data alongside SBA files
- Where Bizminer fits
- A short checklist before you cite SBA numbers
- FAQ
- Sources
What the SBA publishes, and where to find it
Start with the primary sources. They answer most volume and program questions.
Loan-level FOIA data. The 7(a) and 504 FOIA dataset on data.sba.gov holds loan-level files for both programs, plus a data dictionary. The SBA updates it quarterly, typically about a month after each quarter ends. The 7(a) files are split by period (FY1991 to FY1999, FY2000 to FY2009, FY2010 to FY2019 and FY2020 to present), and the 504 data comes in two files. If you want to build your own cut by NAICS code, state, loan size or lender, this is the raw material.
Program performance tables. The SBA’s loan program performance page reports performance by fiscal year (October 1 through September 30), including charge-off and recovery rates. Updates come at fiscal year-end, with quarterly refreshes in January, April and July. These tables are the quickest way to see how a program performed over time.
Lender and approval reports. The SBA also posts lender reports that summarize approvals by state and lender. They are useful for market share and competitive questions: who is active in your county, and at what volume.
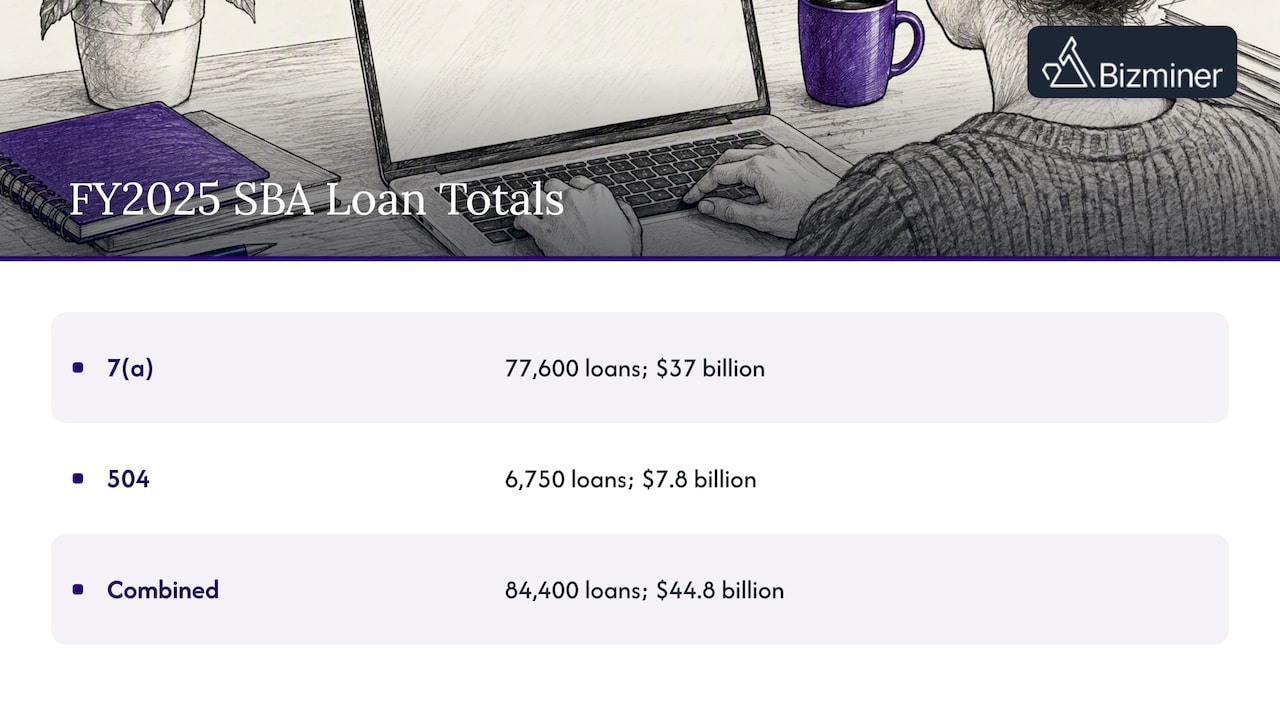
Annual and press reporting. For the headline picture, the SBA reported that it guaranteed a record 84,400 7(a) and 504 loans totaling $44.8 billion in FY2025. Of that, the 7(a) program accounted for 77,600 loans and $37 billion, and the 504 program for 6,750 loans and $7.8 billion.
Questions the public data answers well
Used on its own terms, SBA data is strong for a defined set of questions.
- How big is SBA lending in a given state, county or lender portfolio? The FOIA files carry approval amounts, lender names and locations.
- What is the typical loan size in an industry? Filter the 7(a) files by NAICS code and compute medians, not just averages, since a few large loans skew the mean.
- How has program performance moved over ten years? The performance tables give you charge-off and recovery history by fiscal year.
- Which lenders are most active in a market? Useful for referral partnerships and for banks sizing up local competition.
- How do 7(a) and 504 differ in use? 504 loans fund fixed assets, so sector mix looks different from working-capital-heavy 7(a) lending.
A practical workflow for an advisor who wants an industry view from public files:
- Download the current 7(a) FOIA files and the data dictionary.
- Filter to the NAICS code and approval years that match your client.
- Compute approval counts, median loan size and the share of loans by state.
- Pull the program-level charge-off and recovery tables for context.
- Note which fields are voluntary or sparsely populated before you quote any figure.
Where SBA data stops
This is the part most guides skip, and it is where analysts get into trouble.
It describes SBA-backed loans, not industries
A charge-off rate in SBA data tells you how SBA-guaranteed loans performed. Those borrowers were, by design, often businesses that might not otherwise get funding from private lenders. That selection effect means SBA outcomes in restaurants or trucking are not a substitute for how restaurants or trucking firms perform as a whole. If a client asks “is this industry healthy?”, loan data answers a narrower question.
Some fields are voluntary
The SBA’s open data portal notes that data on borrower demographics and business type is collected voluntarily. Segments such as veteran-owned or rural borrowers reflect what applicants and lenders chose to report. They are fine for trend direction. They are risky as an exhaustive count, and you should say so in any report that cites them.
Performance depends on the economy
The GAO has long noted that SBA subsidy estimates for 7(a) rest on cash-flow models, and actual portfolio performance is sensitive to conditions such as GDP growth and unemployment. Industry also matters inside the models: GAO’s review of the SBA model found that including industry identifiers in default equations changes the estimates. If the SBA itself treats industry as a material input, a lender or advisor should too.
Public tables rarely give you financial ratios
Loan files tell you amounts, terms, lenders and outcomes. They do not tell you the median debt service coverage, margins, or revenue per employee for firms in the borrower’s NAICS code and size band. Those are the numbers that let you judge whether a borrower’s projections are realistic.
What changed in 2026: the $10 million limit
The loan structure changed this year. As of July 2026, SBA borrowers may combine 7(a) and 504 loans for up to $10 million in SBA-backed financing. The SBA’s earlier announcement described the change as up to $5 million in 7(a) plus up to $5 million in 504, which decouples the two limits that used to share a single cap.
For industry analysis, this matters in three ways:
- Larger deals in capital-intensive sectors. Food production, energy and logistics were previously constrained by the combined limit, and a $10 million structure makes them more realistic SBA candidates.
- Historical data will understate new deal sizes. Loan-size statistics from before July 2026 describe a different ceiling. Do not use them as the upper bound for what a borrower can now request.
- Underwriting stakes rise. A $7 million fixed-asset and working-capital package leans harder on industry benchmarks than a $300,000 working-capital line.
The same SBA announcement also notes that small manufacturers can secure an unlimited number of 504 loans as long as each is tied to a distinct project, which is worth knowing when you model a manufacturer’s expansion plan.
If you are weighing financing structures for a buyer or founder beyond SBA programs, a guide on how to finance a SaaS acquisition with real numbers shows how loan limits and other funding options compare for a specific deal type.
Matching the data to the job
Different users need different layers. Here is how we see the split.
| Job | Best starting data | What to add |
|---|---|---|
| Sizing SBA lending in a county | 7(a) and 504 FOIA files | Local business counts and industry mix |
| Tracking program risk over time | SBA performance tables | Industry-level financial performance |
| Underwriting a specific borrower | Borrower financials | Industry ratios by NAICS code and size band |
| Defending a valuation or audit position | Documented, sourced benchmarks | Sample sizes and source lists |
| Finding prospective borrowers or clients | Lender reports, FOIA locations | Company-level prospect lists |
The pattern is consistent: SBA data tells you what happened inside SBA programs, and industry financial data tells you whether a specific borrower or client looks normal for its peers.
Perspective: why we treat SBA data as one input, not the answer
We build industry financial data at Bizminer, so we see the same mistake from credit analysts, accountants and advisors. They pull one public number, such as a program charge-off rate, and apply it to a single borrower in a single niche. The number is real. It just was not measured on that borrower’s peers.
Our view is simple. Public SBA data is excellent for what it covers, and you should use it first. But a loan decision or a client recommendation also needs to answer three questions the loan files cannot:
- Compared with whom? An industry average across a whole sector hides the difference between a 3-person shop and a 60-person one. Segmenting by niche, geography and company size is what turns a benchmark into a usable comparison.
- Can you defend it? Our data is accepted in U.S. Tax Court and used by government agencies, and that standard shapes how we document sample sizes and sources. If your analysis may be questioned by an auditor, a credit committee or an opposing expert, a source list is not optional.
- Is it current enough? Policy changes such as the new $10 million combined limit change who applies and for how much. Benchmarks should be refreshed on the same rhythm as your decisions.
If you want to see how that thinking plays out for lenders, our pieces on SBA loan benchmarks for credit analysts and on why a low bank charge-off rate can mask default rates by industry go deeper. For the wider underwriting picture, see our guide to commercial underwriting data for lenders.
— Danny
Working with industry data alongside SBA files
A few habits make the combination reliable.
Match the classification. SBA files use NAICS codes, and so should your industry benchmarks. A mismatch of one digit level can change the peer group materially. Decide whether you are working at the 3-, 4- or 6-digit level and keep it consistent.
Match the size band. Compare a borrower to firms of similar revenue or headcount. Our write-up on company size benchmarks, public tables and paid reports for court use explains why size segmentation changes conclusions.
Match the geography. A national figure can hide a regional story. If your portfolio is concentrated in a few metros or counties, work from defensible local business patterns and industry data by geography.
Document your sources. Record the file name, the “as of” date and the filters you applied. The FOIA files carry an as-of date in the file name, and the performance tables are updated on a known schedule, so a citation is easy to write and easy to check later.
Flag survivorship and selection. Say plainly in any memo that SBA data covers SBA-approved borrowers. Readers trust a caveat stated up front more than one they discover.
A worked example
Say you advise a client planning a $4 million expansion of a regional food manufacturer. From the FOIA files you pull recent 7(a) and 504 approvals for the matching NAICS code in the client’s state: how many, what median size, which lenders. That shows the market for SBA financing is real and who serves it. Then you need to test the plan itself: are the client’s projected margins and debt service coverage in line with comparable manufacturers of its size? That second question is an industry financial performance question, and the loan files do not answer it.
Where Bizminer fits
Bizminer provides industry financial benchmarks and custom reports across more than 9,000 markets, segmented by industry, geography and company size. For this kind of work, the relevant products and published prices are:
- Industry Financial Performance report: $249 per report
- Industry Market report: $249 per report
- Company Profile: $249 per report
- Financial Report, Market Report, Valuation Report and Company Report: $349 per report each
All are one-off purchases listed on our pricing page. Subscriptions and custom API feeds are also available, and their pricing is not published. If you want to see how a custom report is built around your niche and location, start with granular analysis reports. Accountants who add benchmarks to client deliverables can see how same-day market benchmarks fit custom financial reports.
A short checklist before you cite SBA numbers
- Did you state the fiscal year and the “as of” date of the file or table?
- Did you separate 7(a) from 504? Charge-off reporting differs between them, so a blended rate can mislead.
- Did you note that voluntary fields are incomplete?
- Did you avoid applying a program-wide rate to one industry or one borrower?
- Did you check whether the figure predates the $10 million limit?
- Did you pair the loan data with industry financial benchmarks that match NAICS code, size and geography?
FAQ
Where can I find SBA loan data?
The main source is data.sba.gov, which hosts the 7(a) and 504 FOIA loan-level files, updated quarterly. The SBA also publishes lender reports and a loan program performance page with fiscal-year tables. Start with the FOIA dataset and its data dictionary.
What are the default rates for SBA loans by industry?
The SBA’s performance tables report charge-off and recovery rates by fiscal year, with program-level detail. For an industry view, you can build your own rates from the loan-level FOIA files by grouping on NAICS code. Keep in mind that this reflects SBA-backed borrowers, not each industry as a whole.
Did the SBA double its loan limit?
In effect, yes for combined financing. As of July 2026, eligible borrowers can combine up to $5 million in 7(a) with up to $5 million in 504, for up to $10 million in SBA-backed financing. The SBA announced the rule in May 2026 and confirmed it was in effect in July.
Is SBA data enough to benchmark a borrower?
No. It shows how SBA loans performed, but it does not give you industry financial ratios by company size or location. Lenders and advisors usually pair it with industry benchmarks that match the borrower’s NAICS code, size band and region.
Sources
- SBA open data portal
- SBA: loan program performance
- SBA: record capital delivered in FY25
- SBA: cumulative 7(a) and 504 limit announcement
- SBA: $10 million financing now available
- GAO: subsidy cost of the 7(a) program
- GAO-04-9: 7(a) subsidy model