A “good” revenue per employee number depends entirely on what you’re comparing it against. Across 90+ industries, NYU Stern’s Adamodar dataset puts RPE anywhere from under $10,000 to over $1.76 million, with a broad market median near $111,000. For private SaaS companies specifically, SaaS Capital’s 2026 survey found a median ARR per employee of $141,125.
Three key factors influence the wide variation in these numbers: industry differences, company maturity levels, and whether a company is bootstrapped or venture-funded.
Bizminer’s NAICS-level data lets you narrow those ranges to your exact market instead of guessing from a national average.
Key Takeaways
Revenue per employee benchmarks only mean something when compared within the same NAICS code, company size, and funding stage rather than against a single cross-industry average.
| Point | Details |
|---|---|
| Know the real range | NYU Stern data shows RPE spanning under $10,000 to over $1.76 million across industries, with a median near $111,000. |
| Use the right SaaS baseline | Private SaaS companies report a median ARR per employee of $141,125, per SaaS Capital’s 2026 survey. |
| Bootstrapped often beats funded | At comparable ARR, bootstrapped SaaS firms frequently post higher RPE than equity-backed peers due to spending discipline. |
| Pair RPE with other metrics | Gross margin per employee and revenue trend analysis catch distortions that RPE alone misses. |
| Go granular when precision matters | Bizminer’s NAICS-level custom reports narrow benchmarks to your exact market instead of a broad sector average. |
Table of Contents
- What Counts as Revenue Per Employee Benchmarks
- How Revenue Per Employee Benchmarks Vary By Industry
- Benchmarks By Company Size And Funding Type
- Why Revenue Per Employee Benchmarks Can Mislead You
- Calculating Revenue Per Employee: Data And Validation Checklist
- Where NAICS-Level Data Changes The Interpretation
- What Actually Moves This Number
- Get NAICS-Level Revenue Per Employee Benchmarks
- Sources
What Counts as Revenue Per Employee Benchmarks
Revenue per employee (RPE) is total revenue divided by employee count over the same period. That’s it. The complexity lives in how you define the numerator and denominator, not the math itself.
For the denominator, decide upfront between headcount and full-time equivalents (FTE). A company with 40 full-timers and 20 part-timers working half schedules has either 60 employees or 50 FTEs, and that choice moves your RPE meaningfully. Investopedia’s definition recommends staying consistent within your comparison set rather than picking whichever method flatters the number.
For the numerator, SaaS companies typically use annual recurring revenue (ARR) instead of GAAP revenue, since ARR better reflects the run rate of the business. Everyone else should stick with trailing twelve-month GAAP revenue.
Contractors and seasonal staff need a rule, too. A common approach:
- Count W2 employees at headcount or FTE, your choice, but stay consistent.
- Exclude 1099 contractors from the denominator, since their cost sits in expenses, not payroll.
- For seasonal spikes, use an average headcount across the period, not a single snapshot.
Worked example: A company with $12 million in annual revenue and 55 FTEs has an RPE of $218,182. Swap in headcount of 68 (counting part-timers as full units) and RPE drops to $176,470. Same business, two defensible numbers.
How Revenue Per Employee Benchmarks Vary By Industry
Cross-industry averages are close to useless for judging a specific company, because the underlying businesses have almost nothing in common operationally. A hospital and a software company both generate revenue and both employ people, but the mechanics behind each dollar are entirely different.
Vena’s 2026 benchmark summary identifies only a handful of sectors that clear $1 million in RPE: entertainment software at roughly $1.76 million, real estate development near $1.42 million, and brokerage/investment banking around $1.3 million. Everything else sits well below that ceiling, often by an order of magnitude or more.
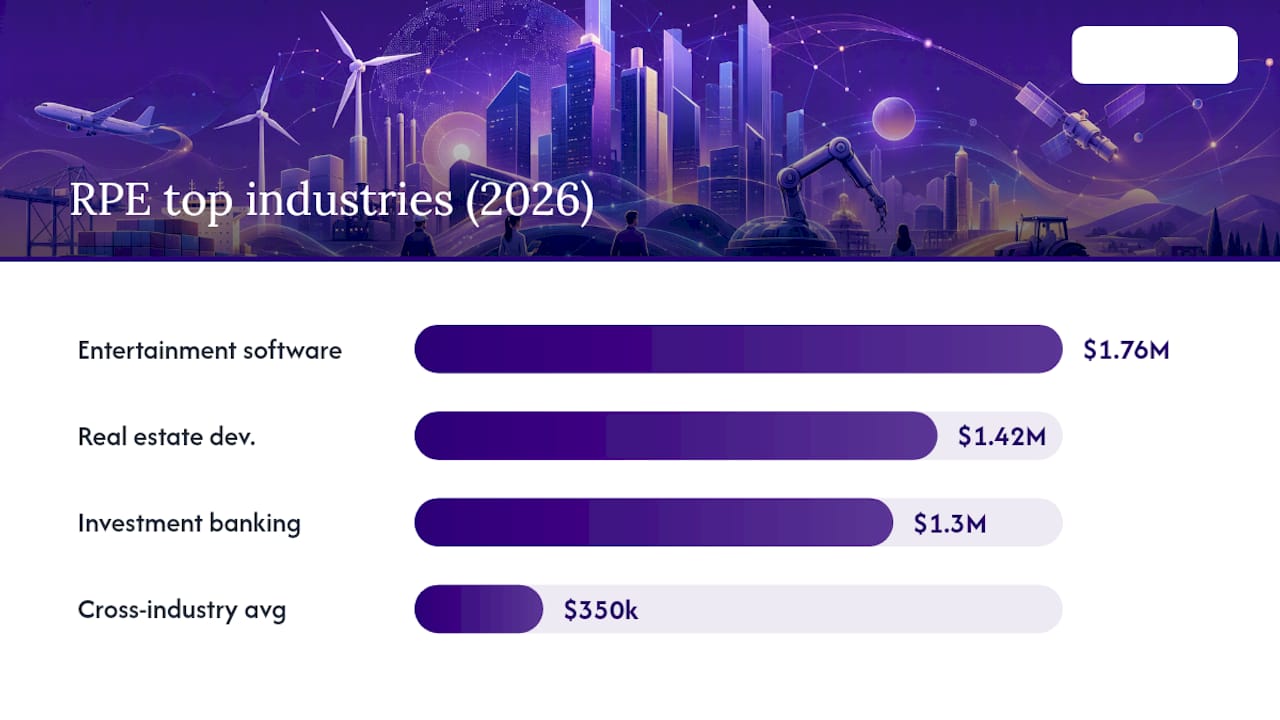
Typical revenue per employee ranges vary significantly by industry types, reflecting their business models and cost structures. Entertainment software and digital platforms tend to be at the high end due to scalable revenue models, while consumer-facing, labor-intensive sectors such as restaurants generally have lower revenue per employee figures. Manufacturing, retail, healthcare, and construction fall somewhere in between, influenced by factors like automation level, margins, and labor mix.
A useful pattern across the high bands, pass-through revenue and capital intensity inflate RPE without necessarily reflecting better-managed labor. Real estate development revenue often represents property value moving through the business, not employee output in any direct sense. That distinction matters when you’re using RPE to judge operational efficiency rather than just financial scale.
HRBench’s analysis flags a similar problem with the commonly cited $350,000 cross-industry average some sources report for 2024: capital-light digital giants pull the mean far above what a typical operating business should expect. If you’re benchmarking against an average instead of your specific NAICS code, you’re likely comparing yourself to companies with nothing in common with your cost structure.
Benchmarks By Company Size And Funding Type
Stage and funding type move RPE almost as much as industry does, and private SaaS offers the clearest illustration because the data is unusually well tracked.
SaaS Capital’s 2026 data puts the median ARR per employee for private SaaS at $141,125, but that single figure hides real variation by maturity:
- Early-stage (pre-product-market-fit through early growth): often $150,000 to $350,000 in ARR per FTE, per stage bands reported by Stack Network’s 2026 benchmarking summary. Headcount often outpaces revenue while teams build product and initial go-to-market motion.
- Growth stage: roughly $250,000 to $600,000, as sales efficiency improves and early hires become fully productive.
- Scale stage: roughly $400,000 to $900,000, reflecting mature sales processes and, increasingly, AI-assisted operations that lift output per head.
- Public SaaS companies: frequently exceed $900,000, benefiting from years of process refinement and product-led growth motions that reduce headcount needs relative to revenue.
Funding type also affects revenue per employee metrics. Bootstrapped SaaS companies tend to report higher ARR per FTE than equity-backed peers at similar revenue levels, reflecting more cautious spending and prioritization of revenue-generating roles. Conversely, venture-backed firms might show lower RPE as they invest ahead of revenue growth, which is not inherently an operational shortfall.
Why Revenue Per Employee Benchmarks Can Mislead You
RPE is a diagnostic starting point, not a verdict. Four distortions show up constantly, and missing any one of them leads to bad conclusions.
Capital intensity skews the number upward in sectors like real estate development and investment banking, where revenue reflects transaction size or asset value rather than labor output. Pass-through revenue does something similar. A construction firm that subcontracts most physical labor will show artificially high RPE because its employee count only reflects the internal management layer, not the people actually doing the work. Outsourcing creates the same effect in reverse direction analysis: a company that outsources customer support will look more efficient on paper than one that keeps support in-house, even if total labor cost is identical. Accounting treatment, particularly ARR versus GAAP revenue recognition, can shift the number by double digits percentage-wise depending on contract structure.
Because of these distortions, Investing recommends pairing RPE with other measures rather than reading it alone:
- Gross margin per employee, which strips out cost of goods sold and gets closer to actual productivity.
- Revenue per billable hour, useful for professional services where headcount doesn’t map cleanly to output.
- Year-over-year trend, which matters more than any single-period snapshot.
Pro Tip: Track RPE quarterly against your own trailing four quarters before you ever compare it to an external benchmark. A rising internal trend tells you more about operational health than matching an industry median that may not reflect your specific cost structure or business model.
Prefer cohort comparisons, meaning same NAICS code, similar revenue size, and similar funding stage, over broad market averages. A single external number rarely accounts for enough of these variables to be actionable on its own.
Calculating Revenue Per Employee: Data And Validation Checklist
Getting RPE right starts with clean inputs, not a complicated formula.
You need three things: total revenue for a defined period (usually trailing twelve months), employee count for the same period (headcount or FTE, chosen consistently), and a clear rule for contractors and outsourced labor. Pull revenue from audited financials or, for SaaS, your ARR report as of period end. Pull headcount from payroll records rather than an org chart, since org charts often lag actual staffing by weeks or months.

Reconciliation example: a company reports $8 million in revenue and 42 employees on the org chart, but payroll shows 38 FTEs after accounting for two open reqs and a contractor miscounted as staff. RPE moves from $190,476 to $210,526. That’s a meaningful swing for a benchmarking exercise built on the org chart alone.
Before you trust the number, run it through this checklist:
- Confirm the revenue period matches the employee-count period exactly.
- Verify headcount source is payroll, not projected or budgeted staffing.
- Confirm contractors are excluded or flagged separately.
- Check whether ARR or GAAP revenue is appropriate for the business model.
- Compare the result against at least two prior periods to catch data errors.
Where NAICS-Level Data Changes The Interpretation
Broad sector averages hide the variation that actually matters for decision-making. A NAICS code covering “computer systems design” spans everything from three-person consultancies to enterprise software vendors, and treating them as one benchmark group produces a number nobody in that range can use.
Bizminer’s coverage of more than 9,000 distinct markets means RPE comparisons can run at a granularity most public datasets don’t offer, segmented by geography, company size, and specific NAICS code rather than a broad industry label. That level of detail is part of why Bizminer’s data has been accepted in U.S. Tax Court and is used by government agencies for market and valuation analysis.
Consider a regional accounting firm advising a client in specialty food manufacturing. A broad “manufacturing” benchmark might suggest RPE in the $250,000 range. But a NAICS-level pull for that specific product category and company size band could show a realistic range closer to $180,000 to $220,000, changing whether the client’s current staffing looks efficient or bloated.
When a public benchmark table gets you in the right neighborhood but you need a defensible number for a valuation, loan assessment, or client advisory engagement, that’s the point to move from general references to a custom benchmarking report.
What Actually Moves This Number
Most companies chase RPE the wrong way, by cutting headcount and hoping the ratio improves. That works for exactly one quarter, right before service quality drops and revenue follows the layoffs downward.
The stronger lever is pricing discipline and product leverage. Companies that raise RPE sustainably tend to fix pricing gaps or automate repetitive work before they touch headcount at all. If your RPE sits well below your NAICS cohort for two or more consecutive quarters, that’s a signal to review pricing and workflow automation before you touch staffing levels. Trend direction over four to six quarters tells you far more than any single comparison to a published median.
— Danny
Get NAICS-Level Revenue Per Employee Benchmarks
Public averages get you close. They don’t get you defensible. Bizminer builds custom reports at the NAICS-code and company-size level instead of forcing your business into a broad industry bucket that includes competitors nothing like you operationally.

Every Bizminer report draws from data that has already stood up in U.S. Tax Court and is used by government agencies for their own market analysis, so the benchmark you hand a client or board isn’t just a number pulled from a blog post. Whether you’re an accountant preparing a valuation, an advisor benchmarking a client’s workforce productivity, or an analyst building an internal scorecard, Bizminer’s market and industry research gets you a comparison set that actually matches your company’s size, geography, and NAICS code. Start by browsing sample reports or request a custom report built around your exact benchmarking need.
Sources
- Employee Metrics by Sector (US) — NYU Stern (Adamodar)
- 2026 Revenue Per Employee Benchmarks for Private SaaS Companies — SaaS Capital
- Revenue per Employee — Investopedia
- Average Revenue per Employee by Industry: 2026 Benchmarks — Vena