Client benchmarking data means the metrics and peer comparisons you use to judge a client’s performance against similar businesses. The immediate action: pick 5 to 15 KPIs that map to the client’s goals, choose a validated data source rather than a random web search, and normalize every figure by revenue, headcount, or another consistent denominator. Frameworks from APQC and NIST’s Baldrige criteria back this approach, and licensed sources like Bizminer fill the gap when you need audit-ready numbers.
TL;DR:
- Benchmarking should use 5 to 15 targeted KPIs normalized by revenue or headcount to ensure clarity and actionability.
- Normalizing data by appropriate denominators and segmenting by industry, geography, or business size is essential for valid peer comparisons.
- Licensing validated datasets with transparent methodologies is crucial for audit-level reports, especially when large sample sizes or legal scrutiny are involved.
- Industry-specific benchmarks focus on metrics like inventory turnover in retail, production efficiency in manufacturing, and revenue per FTE in professional services.
- A well-structured, documented report with visual tools like benchmark bands and percentile charts enhances credibility and supports decision-making.
Table of Contents
- Choosing the right KPIs: a 5 to 15 KPI rule and sample sets by function
- How to normalize and segment data for apples-to-apples comparisons
- A pragmatic benchmarking workflow: plan, collect, analyze, adapt
- Building defensible benchmarking reports and presenting results to clients
- When to license validated benchmark data and how Bizminer supports defensible benchmarking
- Case studies showing practical application of client benchmarking data
- Author perspective: what actually matters in benchmarking work
- Where Bizminer fits when you need licensed benchmark data
- Sources
- FAQ
Choosing the right KPIs: a 5 to 15 KPI rule and sample sets by function
More metrics do not make a stronger report. They make a confusing one. APQC’s guidance on effective benchmarking points to a balanced set of 5 to 15 focused KPIs spanning financial, operational, and customer measures as the practical ceiling before a report stops being actionable and starts being noise. Past that range, clients tend to lose the thread of what actually matters.
The right mix depends on what you are diagnosing. A few starting points by function:
- Financial: gross margin, operating margin, revenue per employee, days sales outstanding.
- Operational: cycle time, capacity utilization, cost per unit, on-time delivery rate.
- Customer: retention rate, net promoter score, customer acquisition cost, average deal size.
- Workforce: turnover rate, revenue per FTE, time to fill open roles, compensation ratio versus peers.
For a consulting diagnostic, you often lean on financial and operational metrics that reveal where margin is leaking. HR compensation benchmarking narrows to workforce and pay-band data, usually pulled from salary surveys alongside internal payroll records. Operational performance reviews weight cycle time and utilization more heavily, especially in manufacturing or logistics clients. Whatever the mix, tie each metric back to a specific client objective before you add it to the list, or it becomes a number nobody uses. Our KPI benchmarks by industry guide walks through sector-specific examples if you need a starting template.
How to normalize and segment data for apples-to-apples comparisons
Raw numbers mislead more often than they clarify. A $10 million company and a $500 million company will never compare cleanly on revenue alone, which is why normalization comes before any peer comparison.
- Normalize per FTE when comparing productivity or cost structure across companies of different sizes.
- Normalize as a percent of revenue when comparing spending categories like marketing, payroll, or overhead.
- Normalize as cost per unit when comparing operational efficiency in production or service delivery.
- Segment by NAICS code, revenue band, geography, and business model before you run any comparison, since a regional retailer and a national e-commerce player will skew each other’s averages.
- Adjust for seasonality, one-time outliers, and accounting method differences (cash versus accrual, for instance) and document exactly how you did it.
EPA’s ENERGY STAR benchmarking work illustrates the stakes of denominator choice well outside finance: a building’s water use only means something once it is expressed per square foot or per occupant, not as a raw total. The same logic holds for client financials.
Pro Tip: Always write down your normalization method in the report itself, not just in your working file, so a client or auditor can retrace your logic months later.
A pragmatic benchmarking workflow: plan, collect, analyze, adapt
Treat benchmarking as a cycle, not a one-time report. APQC frames this as four repeatable phases: Plan, Collect, Analyze, and Adapt, each with its own deliverable and owner.
- Plan: align on client objectives, pick the KPI set, and name a data owner for each metric.
- Collect: pull data from validated sources, document definitions, and flag gaps early.
- Analyze: normalize, segment, and compare against peer bands, then draft initial findings.
- Adapt: turn gaps into a prioritized action list and set a cadence for re-measurement.
A modular engagement can move fast. APQC’s own practitioner workflow describes a 2 to 4 week diagnostic using public benchmarks to build an initial gap map, before licensing deeper data for the full analysis. The most common pitfall is skipping the approval step on metric definitions before collection starts, which forces rework later. Building in a short sign-off checkpoint after the Plan phase avoids that entirely.
Building defensible benchmarking reports and presenting results to clients
A benchmarking report earns trust through structure as much as content. Lead with a plain verdict: where the client stands and why it matters. Follow with peer positioning, normalized tables or visuals, a method notes section, and a short action roadmap tied to the gaps you found.
Visualization choices matter more than they get credit for:
- Benchmark bands (quartile ranges) work well for showing where a client falls relative to a peer group.
- Percentile charts highlight exactly how far above or below median a client sits on a single metric.
- Trend lines show whether a gap is widening or closing over time.
APQC’s guidance frames a compact, well-documented KPI set as the core of a defensible report. Choosing 5 to 15 focused metrics rather than a sprawling dashboard keeps the report legible and easier to defend under questioning.
For audit or MD&A-level defensibility, document the source, sample size, and normalization method for every figure you cite. The SEC’s MD&A guidance is explicit that KPIs need clear definitions and disclosed calculation methods so the numbers cannot be read as misleading. Our benchmarking report examples page has templates built around this structure.
When to license validated benchmark data and how Bizminer supports defensible benchmarking
Licensing matters most for regulatory disclosures, court-ready valuation work, or any project needing a sample size larger than what a free source provides. Before choosing a dataset, check for:
- NAICS-level granularity matched to the client’s actual industry code.
- Documented normalization methods and denominators.
- Disclosed sample size and a traceable source list.
- Update frequency that matches your reporting cadence.
This kind of granularity in data, accepted in U.S. Tax Court and used by government agencies, matters when a report needs to hold up under audit or legal review. For a one-off engagement, an off-the-shelf Industry Financial Performance report often covers the need. For ongoing work across many clients, a custom API feed makes more sense.
Case studies showing practical application of client benchmarking data
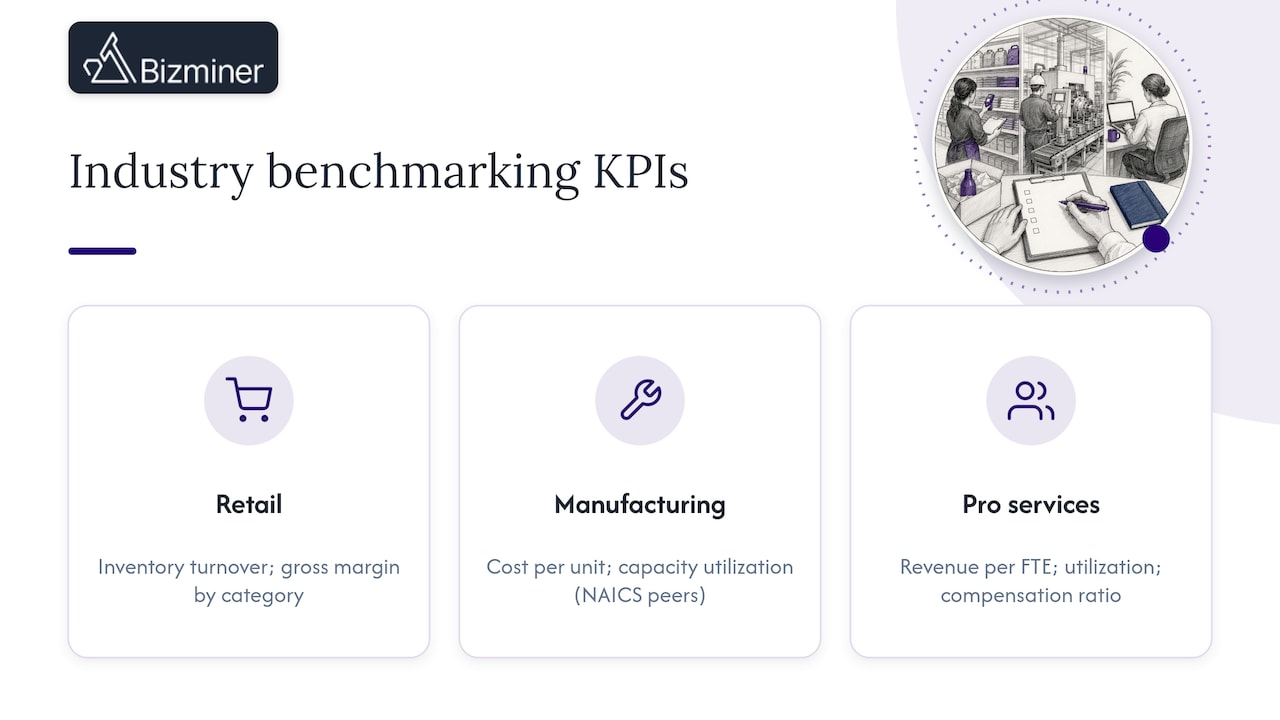
The way benchmarking plays out shifts by industry, even when the underlying process stays the same. A retail advisory engagement typically centers on inventory turnover and gross margin by category, since a retailer’s health shows up fastest in how quickly stock moves and what it costs to move it. Comparing a client’s turnover against NAICS-matched peers, rather than a general retail average, tends to surface whether a slow category is a market-wide trend or a client-specific problem.
In manufacturing, cost per unit and capacity utilization carry more weight than customer metrics, because margin pressure usually traces back to production efficiency. A client running below-median utilization against peers in the same NAICS code often has a clearer capital allocation problem than a demand problem, and normalized benchmarks make that distinction visible in a way raw output numbers cannot.
Professional services firms lean harder on workforce metrics: revenue per FTE, utilization rate, and compensation ratio against peer firms of similar size. A firm’s revenue-per-FTE gap against peers frequently points to underpricing rather than understaffing, a distinction that changes the entire recommendation. Findle Inventory’s breakdown of operational metrics covers a similar logic for service teams tracking inventory-adjacent KPIs. Across all three cases, the constant is the same: pick the metric that matches the client’s actual cost or revenue driver, then benchmark against a peer group narrow enough to mean something.
Author perspective: what actually matters in benchmarking work
Defensibility beats breadth every time. A tight, well-documented KPI set that survives a client’s questions is worth more than a sprawling dashboard nobody can explain. Run benchmarking as a program with visible early wins, not a single report that lands once and gets filed away.
— Danny
Where Bizminer fits when you need licensed benchmark data

Bizminer builds custom financial data profiles across more than 9,000 markets, with NAICS-level granularity and court-accepted sourcing built in. Start with the Market & Industry Research product or check current report pricing on the pricing page. Reports and API feeds are customizable to the peer group and geography your engagement actually needs.
Sources
Not all benchmark data carries the same weight, and the source you pick shapes how defensible your final report will be. Broadly, you are choosing between validated licensed databases, free public sources, industry association surveys, and custom primary research.
Each comes with tradeoffs:
- What Are Most Effective Benchmarking Strategies Used by Top Companies | APQC
- 2023-2024 Baldrige Excellence Framework Criteria Commentary (Business/Nonprofit)
Before you rely on any dataset, run it through a short checklist: does it disclose sample size, are the metric definitions written out in plain language, is the data normalized by a stated denominator, and can you trace figures back to a named methodology? APQC’s tools guidance recommends standardized frameworks and KPI scorecards precisely because they make this kind of transparency checkable.
License a dataset when the client needs audit-ready figures or a large enough sample to hold up under scrutiny. Use free public benchmarks for a quick directional read. Run a custom survey only when no existing dataset covers the peer group you actually need, since the time cost is real. Our page on where to find reliable industry ratio sources breaks down specific source types in more depth.
FAQ
What counts as client benchmarking data?
Client benchmarking data is the set of financial, operational, customer, and workforce metrics used to compare a client’s performance against a peer group. It typically comes from a validated database, public filings, or a custom survey, normalized so companies of different sizes can be compared fairly.
How many KPIs should a benchmarking report include?
A focused set of 5 to 15 KPIs across financial, operational, and customer categories tends to keep a report actionable without overwhelming the client with data. Adding more metrics past that range usually dilutes the report’s clarity rather than strengthening it.
Where can I find reliable benchmarking data?
Reliable sources include licensed industry databases, government and SEC filings, trade association surveys, and custom primary research when no existing dataset fits the peer group. Licensed datasets like Bizminer’s Industry Financial Performance reports add NAICS-level detail and documented sourcing that free public data often lacks.
What are the four main types of benchmarking?
The four commonly referenced types are financial (comparing metrics like margin and revenue), operational (efficiency and process metrics), strategic (competitive positioning), and internal (comparing units within the same organization). Most client engagements blend financial and operational benchmarking, since those metrics tie most directly to margin and performance gaps.
Why does normalizing benchmark data matter?
Normalizing data, such as expressing spend as a percent of revenue or cost per FTE, prevents companies of different sizes from being compared unfairly on raw totals. Without it, a benchmark can suggest a client outperforms peers when the opposite is true once the numbers are adjusted for scale.