TAM, SAM, and SOM are three nested estimates of market size. Total addressable market (TAM) is all the revenue a product could earn if it won every possible buyer. Serviceable addressable market (SAM) is the part of that you can actually reach with your product, price, and geography. Serviceable obtainable market (SOM) is the share of SAM you can realistically win in a set period. Each one is smaller than the last, and the gap between them is where honest planning happens.
This guide defines each term, shows the arithmetic, walks through two worked examples, and covers the mistakes that make these numbers fall apart when a lender, investor, or client asks where they came from.
TL;DR
- TAM is the total revenue opportunity if you captured 100% of demand. SAM is the slice you can serve. SOM is the slice you can win soon.
- The basic formula multiplies potential customers by average revenue per customer, then narrows the customer count at each step.
- Bottom-up sizing (built from customer counts and real spending) is usually easier to defend than top-down sizing (a slice of a big industry figure).
- SOM is the number that belongs in your plan. Most weak market sections lead with a huge TAM and never get to SOM.
- Whoever reads your numbers will ask for the source. Industry-level financial and market data makes each assumption traceable.
Table of Contents
- What TAM, SAM, and SOM mean
- TAM vs. SAM vs. SOM at a glance
- How to calculate TAM, SAM, and SOM
- Worked example 1: a product manufacturer
- Worked example 2: a service business
- Where to find data that holds up
- Common mistakes that make estimates unreliable
- Making your numbers defensible
- Perspective
- Put real industry data behind your estimate
- From SOM to a plan you can act on
- FAQ
- Sources
What TAM, SAM, and SOM mean
The three terms describe market size at three levels of realism.
TAM, total addressable market. Salesforce describes TAM as the total revenue opportunity if a business captured 100% of market demand. It is a ceiling, not a forecast. It answers one question: how big could this get if nothing stood in the way?
SAM, serviceable addressable market. Some publications write it as serviceable available market, and the idea is the same. SAM is the portion of TAM that is reachable and relevant to your business. Amazon Ads notes that factors such as geographic location and demographics filter TAM down to SAM. If you sell only in three states, or only to companies above a certain size, everything outside that boundary drops out.
SOM, serviceable obtainable market. SOM is the portion of SAM you can reasonably capture. The same Amazon Ads guide points to the market landscape, brand awareness, and budget as the limits. Salesforce adds that SOM reflects your current business model, supply, production capability, and competitive position.
So TAM is what exists, SAM is what you can sell to, and SOM is what you can actually win.
TAM vs. SAM vs. SOM at a glance
| TAM | SAM | SOM | |
|---|---|---|---|
| Full name | Total addressable market | Serviceable addressable (or available) market | Serviceable obtainable market |
| Question it answers | How big is the whole opportunity? | How much of it can my offer and reach serve? | How much can I win in the next period? |
| What narrows it | Nothing: it assumes 100% share | Geography, segment, price point, channel, regulation | Competition, capacity, budget, sales cycle, brand |
| Typical time frame | Long-term ceiling | Medium term | Near term, usually one to three years |
| Main audience | Investors sizing the upside | Strategy and product teams | Operators, lenders, and anyone checking feasibility |
| Common failure | Quoting a giant industry figure | Defining the segment too broadly | Skipping it altogether |
The framework is useful at different growth stages. TechTarget’s view is that SOM and SAM focus planning on the revenue and share attainable now, while TAM frames expansion through broader products or geographies. An early-stage owner should live in SOM. A company deciding on its next product line should lean on SAM and TAM.
How to calculate TAM, SAM, and SOM
The core arithmetic is simple. Amazon Ads gives the TAM formula as the total number of potential customers multiplied by average revenue per customer. SAM and SOM apply the same formula to a smaller customer count.
- Define the market. Say exactly who buys, what problem they pay to solve, and in what unit you count them (households, practices, schools, firms).
- Count potential customers. Use industry data to estimate how many of those buyers exist.
- Estimate revenue per customer. Carta describes using historical sales, surveys, or competitor pricing to estimate what a customer spends.
- Multiply for TAM. Customers times annual revenue per customer.
- Filter for SAM. Remove customers outside your geography, segment, or channel.
- Filter again for SOM. Remove what competition, capacity, and budget will not let you reach in your planning window.
Top-down vs. bottom-up sizing
Carta describes two ways to build the numbers. Top-down starts with a large market figure and takes a percentage of it. Bottom-up starts with counted customers and observed or researched spending, then multiplies. Carta’s perspective is that bottom-up sizing is generally more accurate, while top-down is faster but depends more heavily on estimates.
In practice, use both. Build bottom-up as your main case, then run a top-down check. If the two land within a reasonable range, your assumptions probably hold. If they differ by a factor of five, one of your inputs is wrong, and finding which one is the most useful hour of the exercise.
Worked example 1: a product manufacturer
Salesforce uses a baseball bat maker to show the full chain. The figures below come from that example.
- TAM: 20 million U.S. customers at $60 per bat is $1.2 billion.
- SAM: distribution reaches 5 million of those customers, so SAM is $300 million.
- SOM: after accounting for competition, 2 million customers remain, but production capacity of 200,000 bats per year makes that the real limit. At the same $60 price, that works out to $12 million.
The lesson is in the last step. Demand was not the constraint. Capacity was. SOM is shaped by what you can deliver, not only by what buyers want.
Worked example 2: a service business
Here is a hypothetical, with invented numbers for illustration only. Say a bookkeeping firm wants to sell a monthly cash-flow review to independent dental practices.
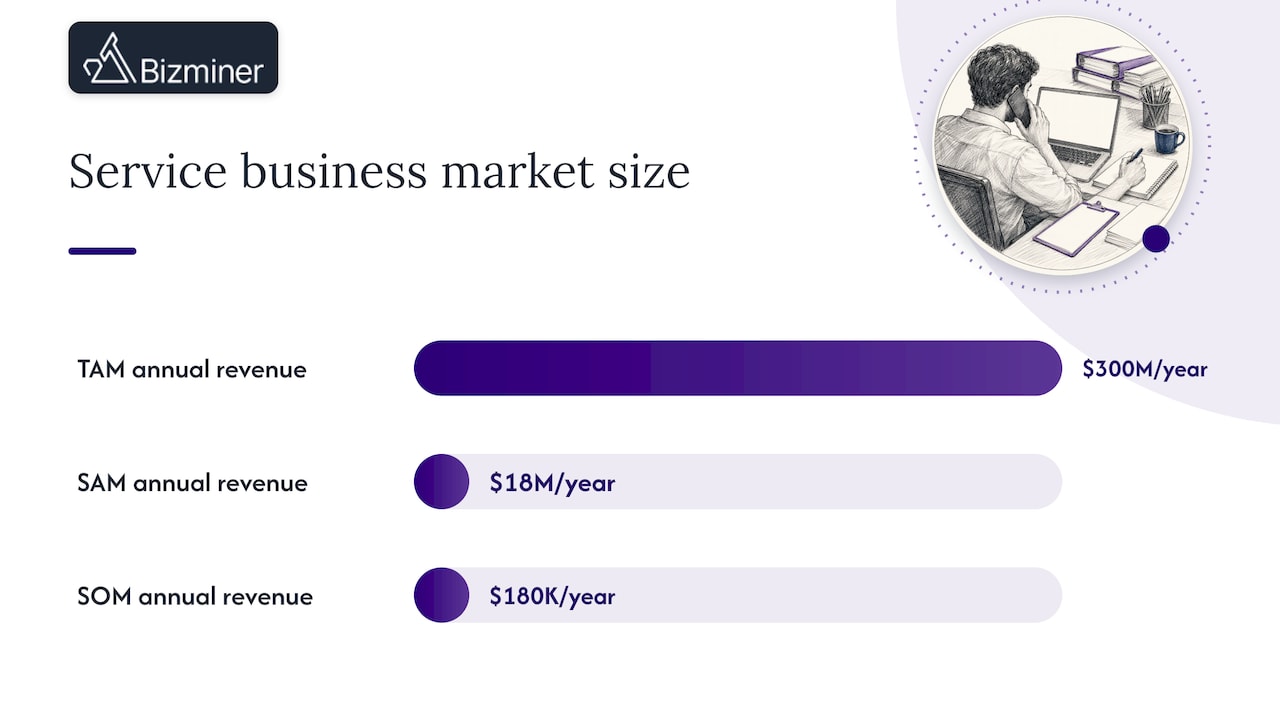
- TAM: assume 100,000 practices nationwide, each paying $3,000 a year. TAM is $300 million.
- SAM: the firm serves only practices in four neighboring states, and only those with at least three providers. Assume that leaves 6,000 practices. SAM is $18 million.
- SOM: with two sales staff and a 90-day sales cycle, assume the firm can sign 60 practices in the first two years. SOM is $180,000 a year.
Notice how different the three figures read. A pitch built on $300 million invites skepticism. A plan built on $180,000 of SOM inside an $18 million SAM tells a lender the owner understands the business. Every figure here must be replaced with real counts before it goes into a plan.
Carta offers a similar chain for education: start with roughly 100,000 U.S. public schools, and if 10% are interested, the estimate is 10,000 schools. The method is the same: a counted universe, then a defensible filter.
Where to find data that holds up
The formula is easy. The inputs are hard. Three places to start:
Government planning guidance. The U.S. Small Business Administration frames market research and competitive analysis as central to planning: find your customers, then define what sets you apart from competitors. That is the discipline behind SAM and SOM.
Industry financial data. Revenue per customer is the input people guess at most. Industry-level financial benchmarks by size and geography replace the guess with a figure you can cite. Our guide to how to use market sizing data walks through this step by step, and market data for business plans covers sources and examples.
Your own customer records. Real deal sizes, close rates, and churn beat any outside average. Use outside data to set the universe and your own data to set the conversion rate.
Tying these numbers to a plan is part of broader thinking about the benefits of strategic planning, where customer research and competitor analysis feed the opportunity you commit to. For a section written to satisfy investors, see our piece on a business plan market analysis built on TAM, SAM, and SOM.
Common mistakes that make estimates unreliable
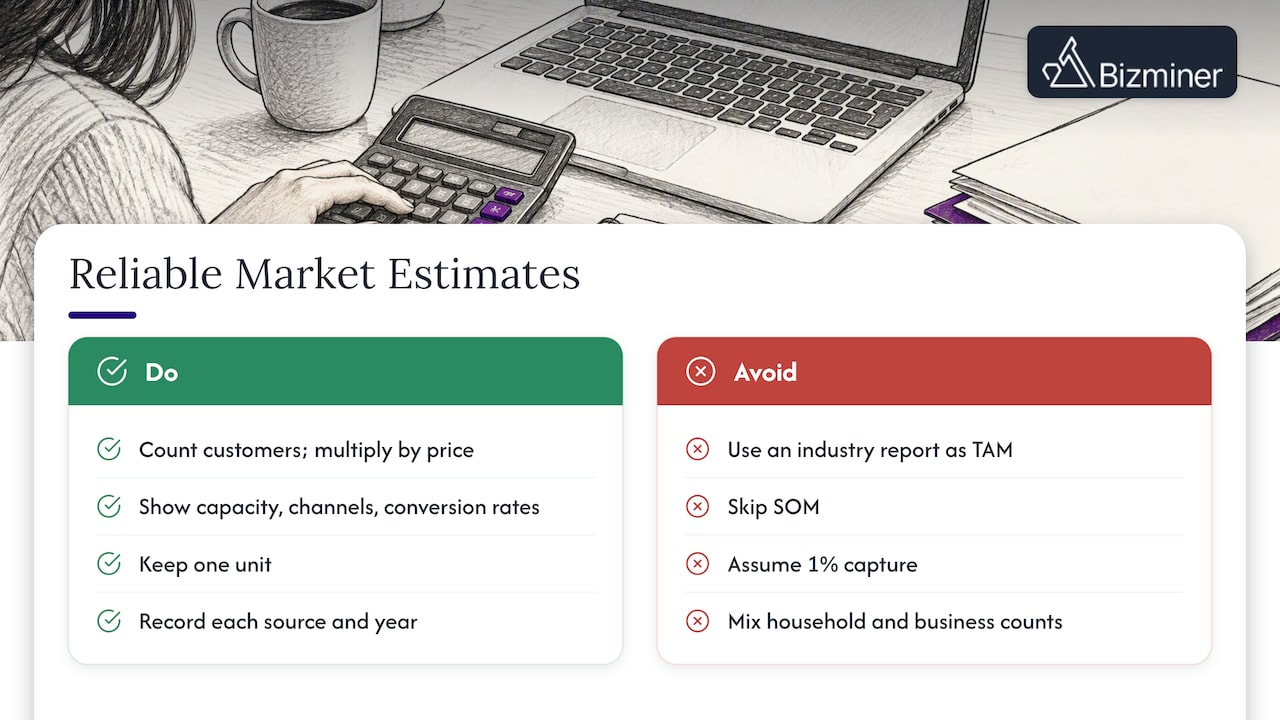
Quoting an industry report as your TAM. A figure for “the global software market” is not your market. Count the customers you could plausibly serve with your product and multiply by your price.
Skipping SOM. Search Engine Journal’s perspective is that SOM is the smallest audience in the framework and often overlooked because larger audiences look better on slide decks. The smallest number is the one a lender will test.
Using one percent as a plan. “If we capture just 1% of a $5 billion market” is not an assumption, it is a wish. Show the sales capacity, channels, and conversion rates that produce the share.
Mixing units. Counting households in TAM and businesses in SAM breaks the chain. Pick one unit and keep it.
Ignoring capacity. The bat example shows it: if you cannot produce or deliver, demand is irrelevant. For a service firm, capacity means hours and headcount.
Never documenting sources. An estimate with no source is an opinion. Note where every count and price came from, and the year it applies to.
Setting it once. Markets move. Revisit the numbers when pricing, competition, or your target segment changes. A market trend analysis helps you see whether the base is growing or shrinking, and a market saturation analysis tests whether your SOM assumes room that is already taken.
Making your numbers defensible
A defensible estimate is one a skeptical third party can rebuild. A few habits get you there.
- Write the assumption next to every number. “6,000 practices” should carry a note on the source and year.
- Segment by size. A five-person firm and a 500-person firm do not spend alike. Picking the right size band changes revenue per customer a lot, which is why we wrote about industry benchmarks by size.
- Name the geography. Local markets differ. A statewide SAM built from national averages will be off.
- Show a range. Give a conservative, base, and optimistic SOM. Readers trust ranges more than single figures.
- Keep the work reproducible. Save the data pulls so the estimate can be updated in an hour, not rebuilt from scratch.
For advisors who prepare these analyses for clients, the same discipline applies. If you want to see how clusters of related industries change the picture, our overview of industry cluster analysis is a useful next step.
Perspective
We see the same pattern in market sections that come across our desk: a huge TAM on the first line and nothing under it. The people reading those numbers, whether a loan officer, a client’s CFO, or a reviewer, do not stop at the headline. They ask how many companies, of what size, in which places, earning how much.
That is why we built Bizminer around granularity. Our platform covers more than 9,000 distinct markets, segmented by industry, geography, and company size, so a SAM can be defined by the same boundaries your product actually has. Our reports include larger sample sizes and detailed source lists, and our data is accepted in U.S. Tax Court and used by government agencies. We think a number only helps you if you can show where it came from.
Our advice: spend less time polishing TAM and more time on SAM and SOM. Count real businesses, use revenue per customer from your own size band, and write down every assumption. The smaller figure you can defend beats the bigger one you cannot.
Danny
Put real industry data behind your estimate
If your SAM depends on how many businesses of a given size operate in a given area, and what they earn, that is the data we publish. Industry Financial Performance, Industry Market, and Company Profile reports are $249 each, and Financial, Market, Valuation, and Company reports are $349 each, as listed on our pricing page. Subscriptions and custom API feeds are also available, and you can see how to build a prospect list when you are ready to turn SAM into named accounts.
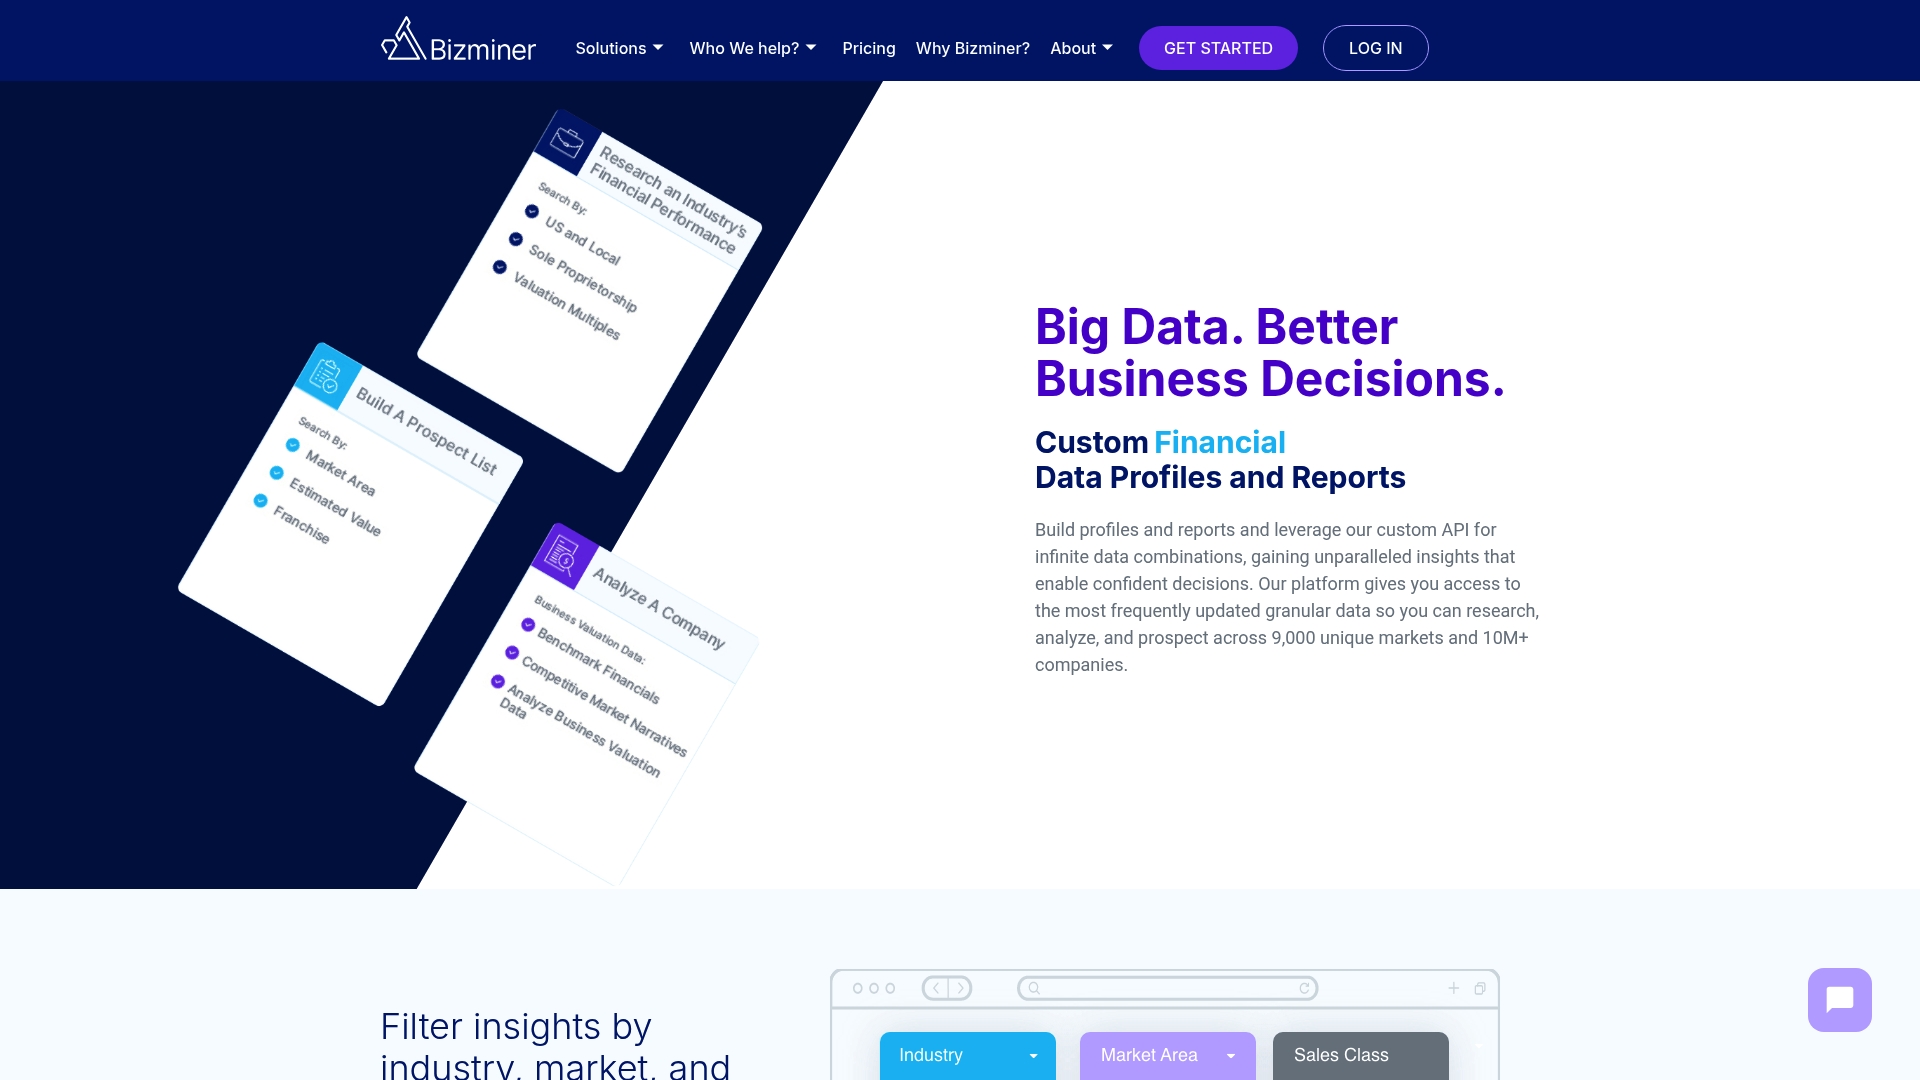
For advisors and accountants, our custom analysis reports let you filter by niche segment, geography, and business size, so the figures you hand a client match the market you are describing.
From SOM to a plan you can act on
Once SOM is set, turn it into targets. Divide the dollar figure by your average deal size to get the number of customers needed. Divide that by your close rate to get the number of conversations, and by the length of your sales cycle to get a timeline. If the result needs more hours than your team has, either SOM is too high or capacity is too low. Adjust the one that is wrong.
Then build the list. SAM tells you how many businesses fit. A prospect list gives you their names. Our guide on prospecting for advisors covers how to prioritize them, and private company data sources explains why checking more than one source improves the count. If you work with small companies, company size benchmarks help you pick the right band for revenue per customer. For the wider view, our market and industry research page shows what is available across industries, and our page for business advisors shows how advisors use it with clients.
FAQ
What is the difference between TAM, SAM, and SOM?
TAM is the full revenue opportunity if you won 100% of demand. SAM is the part you can serve given your geography, segment, and offer. SOM is the part you can realistically capture in a defined period given competition and capacity. Each is a subset of the one before it.
How do you calculate TAM, SAM, and SOM?
Multiply the number of potential customers by average revenue per customer to get TAM. Repeat with only the customers you can reach for SAM, and only the customers you can win in your time frame for SOM. Build the counts bottom-up where you can, and cross-check against a top-down figure.
Which number matters most?
For day-to-day planning, SOM, because it ties to what you can deliver and sell. Investors will want to see a credible TAM and SAM as well, since they show room to grow. A plan that has all three, with sources, is the strongest.
Can you give an example of TAM, SAM, and SOM?
A bat manufacturer with 20 million potential U.S. customers at $60 per bat has a TAM of $1.2 billion. If its distribution reaches 5 million customers, SAM is $300 million. If capacity caps output at 200,000 bats a year, SOM is $12 million.
How often should you update the estimate?
Update it whenever pricing, competition, or your target segment changes, and review it at least once a year. Keep your data pulls and notes so the update is quick.
Sources
- TAM, SAM, and SOM: Made Simple for Growing Businesses (Salesforce)
- What Is Total Addressable Market? (Salesforce)
- TAM SAM SOM: What It Means and How to Calculate (Amazon Ads)
- Market size: TAM, SAM, & SOM (Carta)
- TAM SAM SOM (TechTarget)
- TAM, SAM, SOM: Understanding Their Role (Search Engine Journal)
- Market research and competitive analysis (U.S. Small Business Administration)