
Good industry data for Miami comes in two layers. Public sources such as the Census Bureau, FloridaCommerce, Miami-Dade County and the Beacon Council give you the macro picture: jobs, payroll, trade, establishment counts. For margins, expenses, growth rates and company-level numbers by industry, you need a financial benchmark source built for client work. This guide shows what each layer can tell you, where each one stops, and how to combine them.
It is written for accountants, business advisors, lenders and analysts who have to put a number in front of a client, a credit committee or a reviewer, and then defend it.
TL;DR
- Start with free public data: Census QuickFacts for establishments and payroll, the Beacon Council for GDP and tax context, and the county dashboard for economic metrics.
- Public data tells you how big Miami-Dade is and how fast it moves. It rarely tells you what a typical restaurant, freight forwarder or dental office earns on a dollar of revenue.
- Use a location quotient to see which industries Miami-Dade over- or under-represents compared with the nation before you pick a niche.
- For audit-defensible financial benchmarks, you need documented sample sizes and source lists. We built Bizminer around that need.
- Miami is exposed to Latin American trade and to interest rates, so check the time stamp on every figure.
Table of Contents
- The Miami picture in five public numbers
- What public sources do well, and where they stop
- Use a location quotient to choose where to look
- Three Miami patterns that change how you read the data
- The tax backdrop your clients will mention
- From macro data to a defensible benchmark
- Our perspective: granularity is what makes a number survive review
- Reports and licenses that fit Miami engagements
- Examples of how Miami professionals use the data
- Mistakes that weaken a Miami analysis
- FAQ
- Sources
The Miami picture in five public numbers
Before you open any paid tool, anchor yourself in the published facts. These are the ones we would put on the first page of a Miami work file.
Economic output. The Beacon Council puts Miami’s total GDP at $260 billion as of 2024, first in Florida and fourteenth nationally. Note that other sources define the metro area more widely and report larger totals, so always record which geography a GDP figure covers.
Business base. The Census Bureau’s QuickFacts page for Miami-Dade County lists 98,394 employer establishments and $71.595 billion in annual payroll for 2023, across 83,164 employer firms. That gap between establishments and firms matters: a chain with twelve locations is one firm and twelve establishments.
Job growth. In August 2025, the Miami metro area added 15,800 private sector jobs, the most of any U.S. metro that month, a 1.3% gain. Education and health services added 6,100, trade, transportation and utilities 5,700, and construction 3,800.
Labor market. The Beacon Council’s quarterly report notes that unemployment in the county rose slightly to 2.4% at the close of 2024. The county’s October 2024 labor market report shows total employment up 0.8% year over year to nearly 1.371 million, while Florida fell 0.6% and the U.S. rose 0.1%.
Trade. PortMiami’s top 10 trade partners account for 493,390 TEUs and $30.6 billion in cargo value in fiscal 2025, with Latin America and the Caribbean, Asia and Europe the main regions.
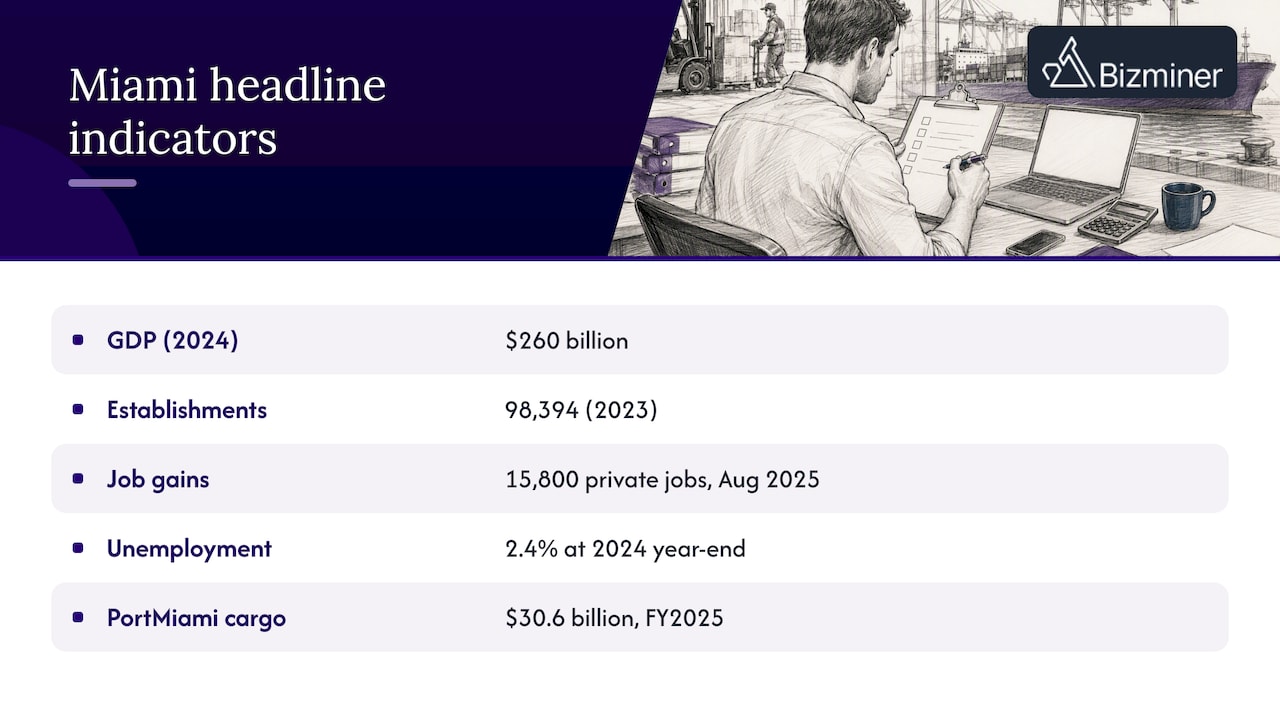
These are good headline numbers. None of them is a benchmark. A banker deciding whether a Hialeah logistics company’s 6% net margin is healthy cannot use any of the five.
What public sources do well, and where they stop
Public sources are authoritative, free and citable. They are also built to describe an economy, not to evaluate a business.
| Question | Public data answers it? | Where it falls short |
|---|---|---|
| How many businesses and jobs are in Miami-Dade? | Yes, Census and FloridaCommerce | Counts only, with a lag of a year or more on some series |
| Which sectors are growing? | Yes, monthly jobs releases | Employment growth is not profit growth |
| What is the tax environment? | Yes, Beacon Council | Says nothing about industry margins |
| What is a typical gross margin for my client’s niche? | No | Needs financial statement data |
| How does my client compare with peers of its size in this metro? | No | Needs size and geography segments |
| Who are the potential customers or targets? | Partly | Lists of firms need a company-level database |
The Beacon Council makes a point worth taking seriously: it advises professionals to use local economic dashboards and quarterly reports to track labor force participation and sector capital investment, rather than lean on national projections. We agree. A national average for restaurants hides the difference between a Brickell tasting room and a Hialeah lunch counter.
Use a location quotient to choose where to look
If you advise across industries, your first question is usually which sectors matter locally. Miami-Dade County’s economic metrics page points to the location quotient (LQ) as a way to see whether an industry is over- or under-represented locally against the national average.
The logic is simple:
- Take the industry’s share of local employment.
- Divide it by the same industry’s share of national employment.
- A result above 1.0 suggests a local concentration. Below 1.0 suggests the industry is thinner here than average.
An LQ above 1.0 can point to a competitive cluster, such as logistics tied to the port. A low LQ can mean a gap, or simply an industry that does not fit the local economy. Treat it as a screening tool, then validate with financial data. High concentration does not mean high profitability.
Three Miami patterns that change how you read the data
Trade follows Latin America
PortMiami cargo values and TEU counts track conditions in Latin America and the Caribbean, as the port’s trade-partner statistics show. If you value a freight, customs brokerage or wholesale business, a strong year may reflect a partner economy and not the owner’s skill. Ask for several years of history and note the partner-country mix.
Rates hit construction and real estate
Miami-Dade County’s own reporting notes that local sector performance stays sensitive to national macro shifts, including interest rate changes that affect construction and real estate. That is a reminder to date-stamp every benchmark and to stress-test projections against a higher-rate scenario.
Industrial space is not one market
The Beacon Council’s quarterly report describes a split in industrial real estate: higher vacancy in older facilities that have sat empty for a long time, alongside scarcity and strong demand for modern, logistics-ready space. A single “industrial vacancy rate” can mislead a lender. Ask which building class the borrower occupies.
The tax backdrop your clients will mention
Clients in Miami often raise taxes first. The Beacon Council describes a 0% individual income tax rate and a 5.5% corporate income tax rate as a core part of the area’s pitch to investors. For advisors, the practical point is that tax climate explains why firms relocate here, but it does not predict whether a given firm will be profitable. Benchmarks do that work.
From macro data to a defensible benchmark
Here is the workflow we see strong practitioners follow when a Miami client needs a peer comparison.
- Define the industry precisely. Use a six-digit NAICS code, not a sector label. “Healthcare” is too wide to benchmark. An outpatient specialty practice is not.
- Set the geography. Decide whether the comparison is Miami-Dade, the metro, Florida or national, and write down why. Local cost structures, such as rent and labor, can differ from national norms.
- Match the size band. A business with $800,000 in revenue should not be compared with one with $40 million.
- Pull financial ratios. Gross margin, operating margin, expense ratios, growth, and balance sheet ratios belong in the file, with the date range.
- Record the sample and sources. Reviewers ask how many companies sit behind a number and where the data came from.
- Layer in the macro context. Add the public figures above to explain trends, not to replace the financials.
If you work with geography as a dimension a lot, our guide to defensible industry data by geography walks through the API workflow. Accountants who need metro-level work after changes in federal GDP data will find our note on audit-ready MSA benchmarks useful.
Where public data can complement a benchmark
Once you have your peer ratios, public company disclosures can add a sanity check for larger names. For publicly traded companies, sector benchmarks built from public records offer a different lens: they compare what companies say with what they deliver. That is not a substitute for private-company financial benchmarks, but it helps when a Miami client sells into or competes with listed firms.
Our perspective: granularity is what makes a number survive review
We have watched the same pattern play out for years. A professional pulls a broad industry average, puts it in a report, and a reviewer, lender or opposing expert asks one question: which companies are in that average? If the answer is vague, the number loses its value.
That is why we built Bizminer around granularity. Our platform covers over 9,000 unique markets, segmented by industry, geography and company size, so a Miami advisor can compare a client with peers that actually resemble it. Our data is accepted in U.S. Tax Court and used by government agencies, and our reports include larger sample sizes and detailed source lists. Those features exist because defensibility is the product, not the chart.
Our advice for Miami work in particular:
- Use public data to explain the environment and Bizminer-style benchmarks to measure the company.
- Never mix geographies silently. If your peer set is national, say so in the footnote.
- Keep the date of every figure. Miami’s trade and real estate exposure means last year’s numbers can mislead.
- Treat free city dashboards as context, and financial benchmarks as evidence.
— Danny
Reports and licenses that fit Miami engagements
If you are ready to move from context to client deliverables, here are the one-time reports we publish on our pricing page:
| Report | Price |
|---|---|
| Industry Financial Performance | $249 per report |
| Industry Market | $249 per report |
| Company Profile | $249 per report |
| Financial Report | $349 per report |
| Market Report | $349 per report |
| Valuation Report | $349 per report |
| Company Report | $349 per report |
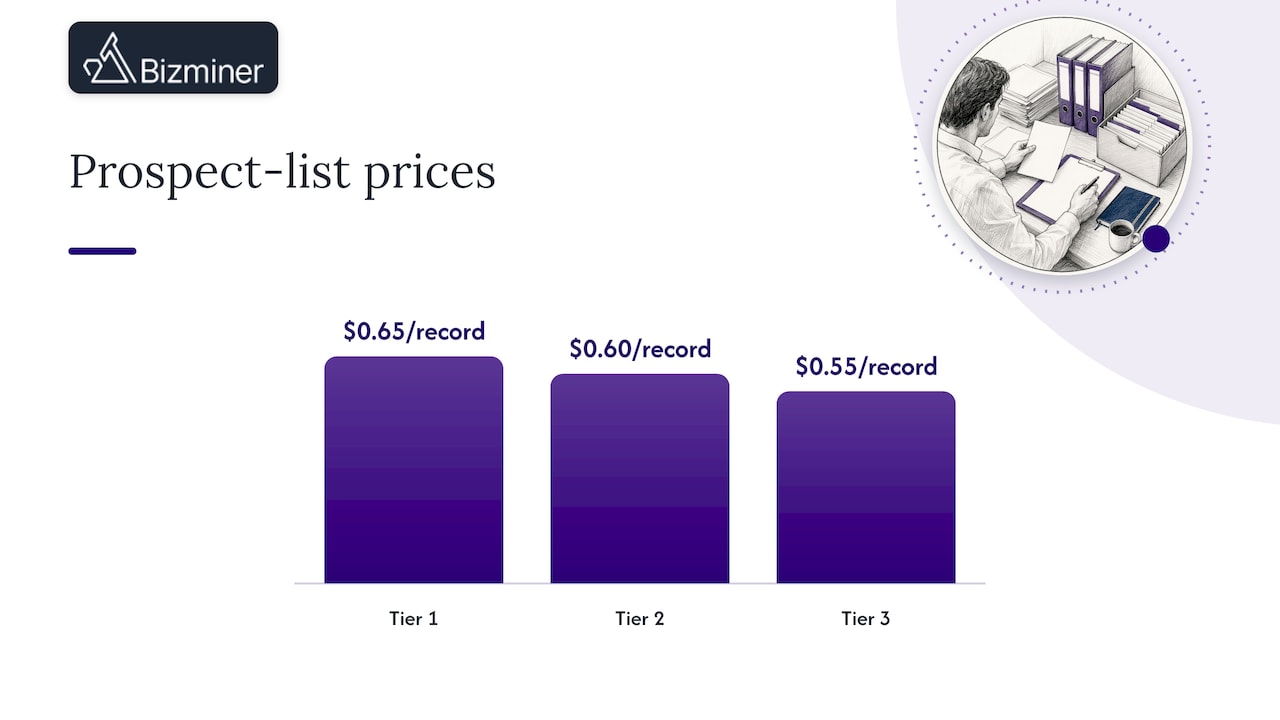
Prospect lists are priced per record: Tier 1 is $0.65, Tier 2 is $0.60 and Tier 3 is $0.55. We also offer a subscription and a customizable API feed. Neither has a published price, so check the pricing page or contact us.
For most Miami engagements, an Industry Financial Performance report is the natural first purchase: it gives you the peer ratios for one industry. If you are building a valuation or a loan file, the Valuation Report or Financial Report goes further. You can also see how an industry financial profile is structured before you buy. When you want to shape the output yourself, our custom report tools let you filter by niche, geography and size.
Examples of how Miami professionals use the data
These are illustrative workflows, not client case studies.
A CPA preparing a damages or valuation file. The practitioner needs margins for a Miami-Dade freight forwarder. They pick the NAICS code, filter to a revenue band and compare with national peers. They cite the benchmark’s sample size and sources, then use PortMiami trade statistics to explain the volume trend.
A lender screening a real estate borrower. The loan officer compares the borrower’s operating ratios with peers in real estate (NAICS 531), then reads the county’s industrial real estate commentary to judge whether the borrower’s building class matches demand.
A small business development center counselor. The counselor wants a local startup to see what a realistic expense structure looks like. They use industry ratios for the startup’s niche and the Census establishment count to show how crowded the field is.
An advisor building a pipeline. A growth-focused advisor picks industries with a high LQ, then builds a B2B prospect list for the segments where Miami firms cluster.
Mistakes that weaken a Miami analysis
- Citing a headline GDP without the geography. Metro, county and city definitions differ, and so do totals.
- Using national averages for local cost lines. Rent and wages can diverge from the national picture. Our piece on BLS average wages by industry shows how to turn a wage figure into a benchmark you can defend.
- Treating job growth as business health. Hiring is a signal, not a margin.
- Skipping the date. The Oct 2024 labor figures above are useful, but they are not a 2026 snapshot.
- Leaving the sources out. If a reviewer cannot trace a number, expect it to be discounted.
If your work involves a deal, our market data due diligence checklist lays out what to verify. For a full overview of our platform, see our market and industry research page.
FAQ
Where can I find free industry data for Miami?
Start with Census QuickFacts for Miami-Dade County, the county’s economic metrics dashboard, FloridaCommerce monthly employment releases and the Beacon Council’s quarterly reports. These cover jobs, payroll, establishments and trade. They do not give company-level margins or expense ratios.
Is Miami data different from the rest of Florida?
Often, yes. The October 2024 county labor report shows Miami-Dade employment rising 0.8% while Florida’s fell 0.6%. Trade exposure to Latin America and the Caribbean also makes Miami’s mix distinct, so a statewide number can mislead for local work.
Can I use Bizminer data for Miami-specific benchmarks?
Yes. Our platform segments by industry, geography and company size across over 9,000 markets, so you can narrow a peer set to the geography and size that fits your client. Check the specific industry and geography on our site before you buy, since coverage varies by market.
How much does a Bizminer industry report cost?
Industry Financial Performance, Industry Market and Company Profile reports are $249 each. Financial, Market, Valuation and Company reports are $349 each. The subscription and API feed have no published price.
What is a location quotient and why does it matter?
It compares an industry’s share of local employment with its share nationally. A value above 1.0 suggests a local concentration, which helps you spot clusters and gaps. Use it to choose where to dig, then confirm with financial benchmarks.
Sources
- Miami-Dade Beacon Council: Economy
- Miami-Dade Beacon Council: Market Research
- Beacon Council Quarterly Report, Q1 FY 2024-2025
- U.S. Census Bureau QuickFacts: Miami-Dade County
- Miami-Dade Labor Market Report, October 2024
- PortMiami Overall Statistics 2025
- Miami-Dade County Economic Data Snapshot
- Miami-Dade Water and Sewer Department 2025 Annual Report