Accounting client benchmarking compares a client’s financial and operational metrics against defensible peer groups so advisors can pinpoint prioritized improvement opportunities and justify advisory fees. Done correctly, it flags outliers in profitability, efficiency, and liquidity fast. Sources like the AICPA’s National MAP Survey, RMA Annual Statement Studies, and commercial publishers like Bizminer give the comparison enough rigor to survive client scrutiny, and in some cases, courtroom scrutiny.
TL;DR:
- Benchmarking with top-quartile targets rather than industry medians encourages higher client performance levels across profitability, efficiency, and productivity.
- Peer group selection should consider revenue size, geographic location, and service mix to ensure meaningful comparisons and avoid misleading conclusions.
- Using medians and quartiles in comparisons provides more accurate benchmarks than averages, especially when analyzing financially volatile or skewed data.
- Reliable benchmarking data sources include Bizminer for detailed NAICS-based reports, RMA for lending ratios, and public datasets for industry structure context.
- Setting measurable targets with clear numbers and timeframes improves client actionability and helps justify advisory fees based on KPI improvements.
Table of Contents
- What Does Accounting Client Benchmarking Cover?
- Which Financial Ratios Matter Most in Client Benchmarking?
- How Do You Benchmark a Client Step by Step?
- Where Do You Find Reliable Benchmark Data?
- How Do You Turn Benchmark Gaps Into Client Action?
- Why Does Data Defensibility Matter for Client Benchmarks?
- What Accountants Get Wrong About Benchmarking
- How Bizminer Supports Defensible Client Benchmarking
- Sources
- FAQ
What Does Accounting Client Benchmarking Cover?
Benchmarking splits into three lanes, and mixing them up is the fastest way to give a client bad advice.
Industry benchmarking compares a client against its NAICS sector as a whole. It’s useful for a new client where you have no history yet. Peer-group benchmarking narrows that pool by revenue band, employee count, service mix, or geography. This is where most of the useful advisory insight lives. Internal practice benchmarking turns the lens on the firm itself, tracking realization rates, staff utilization, and revenue per partner over time.
Choosing peer criteria matters more than choosing the metric:
- A $2 million landscaping company has almost nothing in common with a $20 million commercial landscaping firm, even under the same NAICS code.
- Geography swings labor cost ratios enough to distort margin comparisons across regions.
- Service mix (retail versus wholesale, for instance) changes what a “normal” gross margin even looks like.
Which Financial Ratios Matter Most in Client Benchmarking?
Five categories cover most of what a client engagement needs, and each one answers a different question.
Profitability ratios (gross margin, net margin, EBITDA margin) show whether the business model itself works before overhead and financing distort the picture. Productivity metrics, especially revenue per employee and average billing rate, reveal whether a labor-heavy client is overstaffed or underpriced. Efficiency ratios (receivables turnover, inventory turnover, asset turnover) expose how well a client converts assets into cash. Liquidity and leverage measures, current ratio, quick ratio, debt to equity, and debt service coverage, tell you how much runway a client has before a bad quarter becomes a crisis.
- Gross margin below industry median often points to pricing or supplier cost problems, not volume problems.
- Receivables turnover well under peer median usually means collections policy, not customer quality.
- Debt service coverage near 1.0 is a warning sign regardless of industry.
Pro Tip: Working capital ratios move faster than annual P&L trends. Check them quarterly for any client flagged as an outlier, not just at year end.
One industry-agnostic pattern shows up constantly: firms that use top-quartile targets instead of medians push clients toward high performance rather than mediocrity, because the average in most industries is dragged down by a long tail of underperformers.
How Do You Benchmark a Client Step by Step?
A repeatable process turns benchmarking from a one-off report into a standing advisory service.
- Define the objective and peer-match criteria. Decide whether you’re solving a pricing question, a profitability question, or a lending question, then set NAICS code, revenue band, and geography. Six-digit NAICS granularity matters here. A four-digit code lumps a specialty electrical contractor in with general contractors, which produces useless comparisons.
- Collect and normalize client financials. Map the client’s chart of accounts to standard categories, and strip out one-time items like a PPP loan write-off or a lawsuit settlement.
- Select benchmark sources and pull peer data. Match the source to the question: lender-grade ratios for a credit memo, practice metrics for a firm comparison.
- Compare using medians and quartiles. A single average hides more than it reveals. Quartile position tells you where the client actually stands.
- Prioritize recommendations with measurable targets. Attach a number and a timeframe to each recommendation, not a vague direction.
- Set a monitoring cadence. Quarterly check-ins on the two or three metrics that moved the most keep the engagement alive past the initial report.
Pro Tip: Build one reusable reporting template per industry vertical you serve regularly. It cuts prep time on repeat engagements by more than half.
Where Do You Find Reliable Benchmark Data?
No single source covers every need, so match the source to the decision you’re making.
- Public datasets (Census, BEA, the Annual Business Survey) give structural context: employment counts, receipts by size class, and industry distribution, which is useful for validating that your peer sample is representative rather than skewed toward large or small outliers.
- RMA Annual Statement Studies remain the standard reference for lenders assessing comparative financial ratios across hundreds of industries, making them the right choice when a benchmark needs to support a credit decision.
- AICPA’s National MAP Survey lets firm leaders filter practice-level data by region, firm size, and service line, which is the right tool when you’re benchmarking the firm rather than a client.
- Industry almanacs and government reference guides document dozens of comparative indicators with NAICS-based breakdowns that are hard to find anywhere else.
- Commercial publishers like Bizminer fill the gap public data leaves open: six-digit NAICS granularity, larger current-year samples, and client-ready formatting.
How Do You Turn Benchmark Gaps Into Client Action?
A number that sits two points below the peer median isn’t automatically a problem. Check sample size and volatility before treating any single-quarter gap as a real signal. A one-time equipment purchase or a slow month can move a ratio without meaning anything structural.
Once a gap is confirmed, translate it into a lever the client can actually pull:
- A revenue-per-employee gap points to staffing ratios or underpricing, not effort.
- A receivables turnover gap points to collections policy or payment terms.
- A leverage gap points to financing structure, not operations.
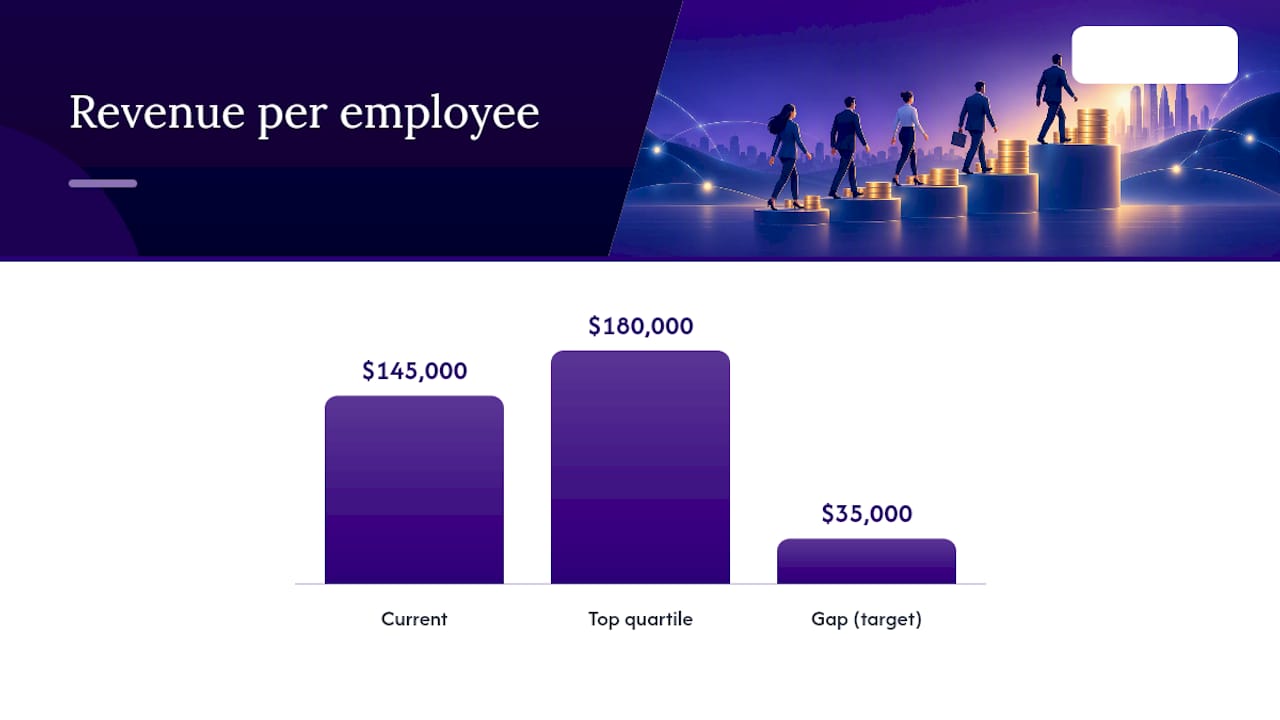
Set the target with a number attached: “raise revenue per employee from $145,000 to the top-quartile mark of $180,000 within 18 months” gives the client something concrete to work toward, and gives you something to package as an advisory offer with a fee tied to specific KPI checkpoints rather than an hourly rate.
Pro Tip: Price the advisory package around the metrics you’re tracking, not around hours worked. Clients pay more readily for a defined outcome than for a time log.
Why Does Data Defensibility Matter for Client Benchmarks?
A benchmark only holds up if a client, a lender, or opposing counsel can trace where the numbers came from. Defensibility rests on sample size, NAICS specificity, and documented normalization rules, not just a clean-looking chart.

Bizminer’s reporting is built around that standard: NAICS-granular data across more than 9,000 markets, with benchmarks that have been accepted in U.S. Tax Court and used by government agencies. Document your source, sample size, and any adjustments directly in the client report. That paper trail is what separates a defensible benchmark from a guess dressed up as one.
What Accountants Get Wrong About Benchmarking
The most common mistake is matching peer groups on NAICS code alone and ignoring revenue band, which stacks a $500,000 shop against a $5 million one. The second is treating a one-time expense as a trend. The third is leaning on averages when medians and quartiles tell the real story.
Two quick tests worth running this quarter: pull revenue-per-employee for your five most profitable clients and see how they compare to peer medians, and run a days-sales-outstanding check across your client base to spot collection problems before they become cash-flow emergencies.
— Danny
How Bizminer Supports Defensible Client Benchmarking
Some providers give accountants six-digit NAICS granularity and current-sample data that public datasets and generic industry averages can’t match, at a price point built for per-engagement use rather than a long-term contract. Firms use it for custom benchmarking reports, revenue-per-employee lookups, and working capital diagnostics, then hand clients a document with sourcing detailed enough to survive a lender’s or a court’s questions.
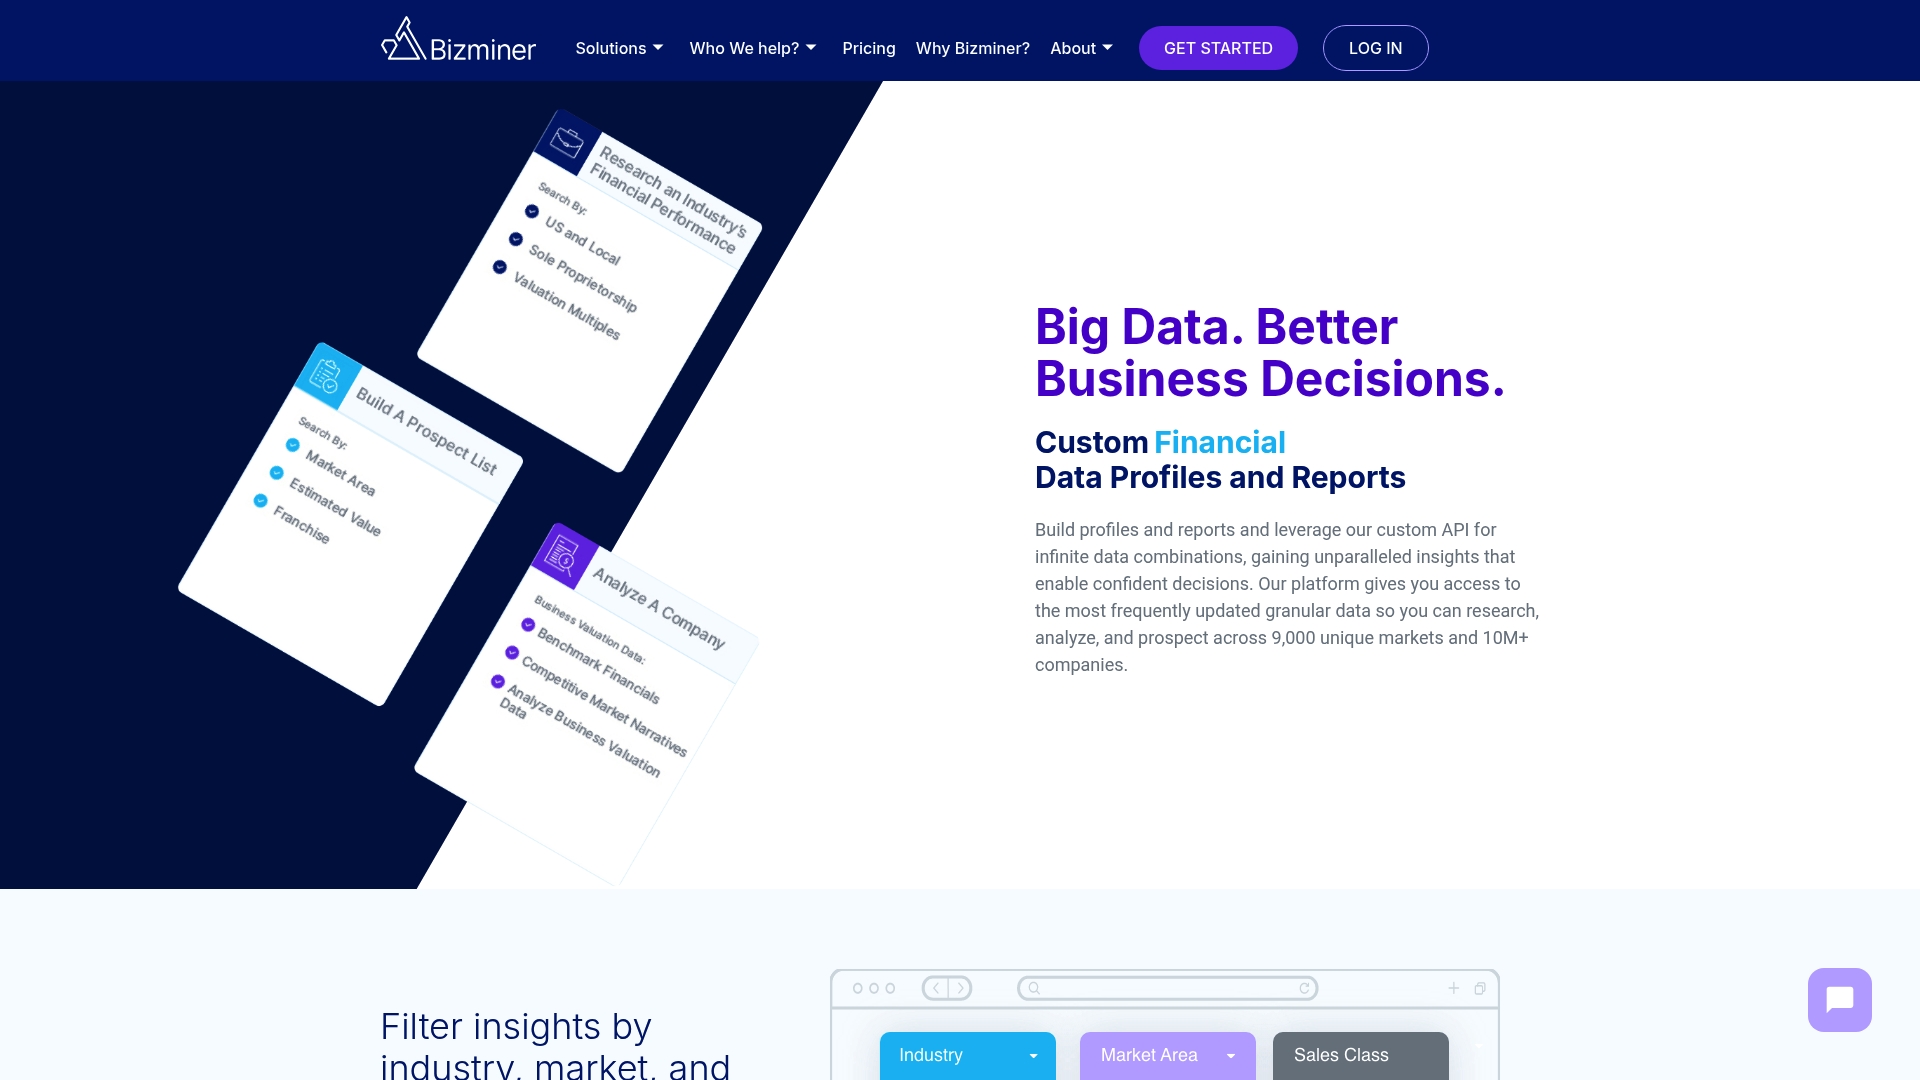
Typical workflows look like this: pull a Company Profile before a new engagement kickoff, run a Financial Report when a client’s ratios need a defensible comparison for a loan application, or use the NAICS industry search tool to confirm you’re matching the right six-digit code before building a peer set. Reports start at $249 for an Industry Financial Performance report and $349 for a full Financial Report, priced per report rather than as a subscription commitment. Browse sample benchmarking reports to see the output format, or head to the market and industry research page to check coverage for your client’s sector before your next engagement.
Sources
- AICPA — National MAP Survey (professional insight)
- RMA Annual Statement Studies (library reference)
- Entrepreneur’s reference guide to small business information — statistics (Library of Congress)
FAQ
What Is Accounting Benchmarking?
Accounting benchmarking is the practice of comparing a business’s financial ratios and operational metrics against a defensible peer group to spot performance gaps. Sources like RMA Annual Statement Studies and NAICS-based commercial reports supply the comparative data most firms rely on.
What Are the 7 Types of Benchmarking?
Benchmarking frameworks vary, but the most commonly cited categories are internal, competitive, functional, generic, strategic, process, and performance benchmarking. In accounting practice, most engagements fall into industry, peer-group, or internal practice benchmarking, which map roughly onto the competitive, functional, and internal types.
What Are the 5 Phases of Benchmarking?
Most benchmarking methodologies follow five phases: planning, data collection, analysis, integration, and action. For a client engagement, that means defining peer criteria, pulling normalized financials, comparing against medians and quartiles, prioritizing recommendations, and monitoring results over time.
Who Are Big 4 Clients?
Big 4 firms (Deloitte, PwC, EY, and KPMG) primarily serve large public companies, multinational corporations, and major financial institutions that need audit, tax, and advisory work at scale. Mid-size and regional firms typically serve small and midsize businesses, where NAICS-granular benchmarking tools like Bizminer help level the playing field on data quality.
How Much Does Bizminer Cost for Benchmarking Reports?
Bizminer prices reports individually rather than through a single flat fee: an Industry Financial Performance or Company Profile report runs $249, while a full Financial Report or Valuation Report runs $349. Prospect list pricing and API feed costs are listed separately on the pricing page.