Most benchmarking mistakes happen before any number is read. The peer group is wrong, the data is older than it looks, the sample is too thin, or the two companies don’t account for revenue the same way. The arithmetic is fine and the conclusion is still wrong. This guide walks through the eight errors accountants, advisors, lenders and planners make most often, and gives you a check you can run on each one before a benchmark goes into a client memo, a loan file or a valuation.
TL;DR
- Peer selection drives the answer. Pick the comparison set on purpose, by industry, size and geography, and write down why.
- Check the reporting period behind a benchmark, not only the publication date.
- A benchmark built on few observations is a direction, not a number. Ask how many companies sit behind it.
- Benchmarks describe a peer group. They are not targets, and they say nothing about why a gap exists.
- Benchmarking only pays off when findings become owned actions that you measure again.
Table of Contents
- Mistake 1: Choosing the peer group by convenience
- Mistake 2: Comparing companies of different sizes
- Mistake 3: Comparing things that were never comparable
- Mistake 4: Trusting a thin sample
- Mistake 5: Mixing up the publication date and the reporting period
- Mistake 6: Ignoring accounting differences
- Mistake 7: Treating the benchmark as a target
- Mistake 8: Stopping at the report
- A quick pre-flight checklist
- Who is most exposed to these errors
- Where Bizminer fits
- Our perspective
- FAQ
- Sources
Mistake 1: Choosing the peer group by convenience
The most damaging error is also the quietest. Someone grabs the closest industry label, or the five competitors they already know, and calls it a peer group. Everything downstream inherits that choice.
Research on mergers shows how much the choice matters. A study of 663 target-sought fairness opinions from 2000 to 2015 found that the average selected peer group sits at the 38.4th percentile of all possible peer portfolios. The authors also found that after a 2007 Delaware ruling, targets’ peer selections shifted lower, which suggests that peer choice is a lever that people pull deliberately. If a peer set can move a valuation in a deal, it can move a loan decision or a client recommendation too.
Classification labels deserve the same scrutiny. A study of industry classification misfits found that firms that don’t fit the industry they are filed under show larger abnormal accruals. A company filed under the right code can still be an odd one out. A regional restaurant group with a catering arm is not a pure restaurant.
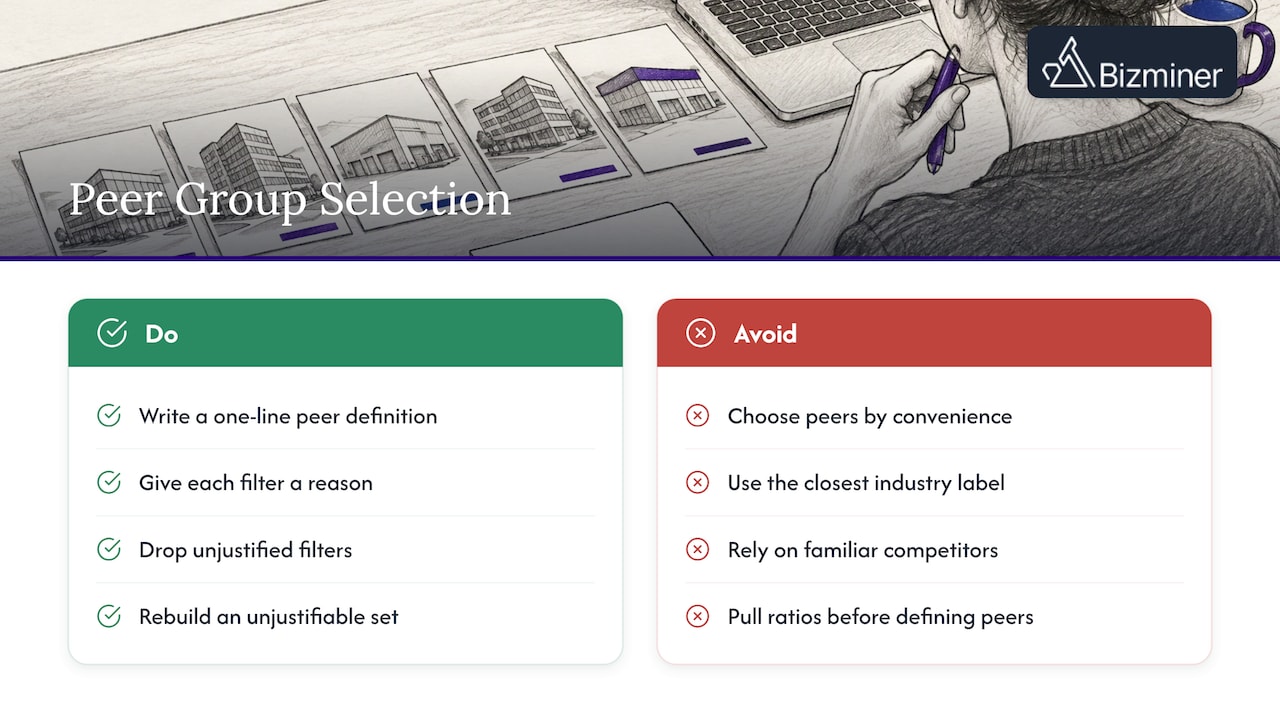
The check: before you pull a single ratio, write a one-line peer definition (industry, size band, geography, business model) and a one-line reason for each. If you cannot justify a filter, drop it. If you cannot justify the whole set to a skeptical reviewer, rebuild it. Our guide to peer group selection walks through an eight-step version of this.
Mistake 2: Comparing companies of different sizes
A $400,000 landscaping company and a $40 million one both appear under the same industry code. Their margins, payroll ratios and debt loads have little in common. Larger firms buy materials at better rates, spread overhead across more revenue and borrow more cheaply. Small firms often pay the owner through distributions that never touch the expense lines.
Blending these into one industry average gives you a number that describes no real business. A small client looks inefficient against it, and a large one looks fine when it is not.
The check: use revenue bands, and confirm the band actually fits your subject. If the client sits near a boundary, look at the band above and below and see whether the conclusion changes. If it does, say so in the report. Our piece on industry benchmarks by size explains how to pick the right band.
Mistake 3: Comparing things that were never comparable
The deepest benchmarking error is treating different operations as the same operation. Robert Kaplan of Harvard Business School made the point plainly: benchmarking tells you little when the processes or products compared are fundamentally different. His examples were comparing the production cost of a Mercedes-Benz 450SL with a Mazda Miata, or the customer-service cost of Armani with that of Wal-Mart. He argued that aggregate-metric comparisons only hold up for standardized, low-cost, undifferentiated processes.
The same trap shows up in sales and operations metrics. A single headline figure, such as a conversion rate, hides the mix of situations behind it. A breakdown of cold call conversion rate benchmarks shows how an average can look authoritative while leaving out the differences that decide whether it applies to you.
In financial work, the equivalents are business model and revenue mix. A contractor that sells services is not comparable to one that resells materials, even with the same NAICS code (the federal classification system that sorts businesses by activity). A franchisee is not comparable to an independent. Premium and discount operators in the same industry carry different gross margins by design.
The check: ask what the subject company actually sells and how. If your peer data cannot be cut by niche, you are comparing averages of unlike things. Use the narrowest segment that still has enough companies in it, which brings us to the next point.
Mistake 4: Trusting a thin sample
A benchmark is a summary of the companies behind it. Narrow the filters far enough and the summary rests on a handful of firms, where one unusual company can swing the median.
APQC, the benchmarking research organization, states that a reliable benchmark rests on enough validated observations for each measure and peer group. It notes that peer filters such as industry, revenue band and region shrink the sample, and that when the sample is thin, the value should be treated as directional and corroborated against other peer groups.
This creates a real tension. Tight filters improve relevance and weaken the sample. Loose filters do the opposite. There is no setting that removes the trade-off, so you manage it:
- Start with your ideal narrow peer group and note the number of observations.
- Widen one filter at a time (a neighboring size band, a related industry code, a wider region).
- Compare the results. If the ratio is stable across the versions, you can lean on it. If it jumps around, report a range instead of a point.
The check: never accept a benchmark without the count of companies behind it. Ask for the sample size on every ratio, because it can differ from one measure to the next.
Mistake 5: Mixing up the publication date and the reporting period
A report published this month may describe financial statements from a year or two ago. That is normal, since companies take time to file and the data takes time to validate. The mistake is assuming that “published recently” means “describes recently.”
APQC advises separating the publication or refresh date from the underlying reporting period, and comparing your actual results from an equivalent completed 12-month fiscal period. A client’s trailing six months set against a prior-year full-year benchmark will mislead you, especially in a seasonal business.
APQC also cautions against treating age as the only test. Validation, normalization, relevance and changes in the process or operating environment all affect usefulness, and a newer benchmark from a poorly matched peer group can tell you less than a somewhat older one from a close match. Freshness does not rescue a bad comparison.
The check: for each benchmark, record three dates: when it was published, which fiscal period it covers, and which period your subject’s numbers cover. If the periods don’t line up, adjust or caveat before you compare. Be especially careful across big shifts, such as an interest-rate swing or a pandemic year, where a pre-shift benchmark may no longer describe how the industry operates.
Mistake 6: Ignoring accounting differences
Two companies can run identical operations and report different margins. Reasons include cash versus accrual accounting, depreciation methods, inventory valuation (FIFO versus LIFO), how owner compensation is treated, and where costs land between cost of goods sold and operating expenses. A ratio built from one company’s chart of accounts is not automatically comparable to a ratio built from another’s.
APQC’s guidance includes verifying that definitions, formulas, exclusions and units have not changed between the benchmark and your measure. That applies to financial ratios as much as to process metrics. “Operating margin” in your client’s books and in the benchmark may be two different calculations.
The check: normalize before comparing. Reclassify the client’s expenses to match the benchmark’s categories, adjust owner pay to a market level when the benchmark assumes it, and note any one-time items. Then compare. For audit-ready documentation of these adjustments, see our guide to making client benchmarking data audit ready.
Mistake 7: Treating the benchmark as a target
A median is where half the peers are better and half are worse. It is not a goal, and it is not a verdict. A company 3 points below the median on gross margin may have a deliberate discount strategy, a different customer mix or a new location still ramping up. Or it may have a pricing problem. The number alone cannot say which.
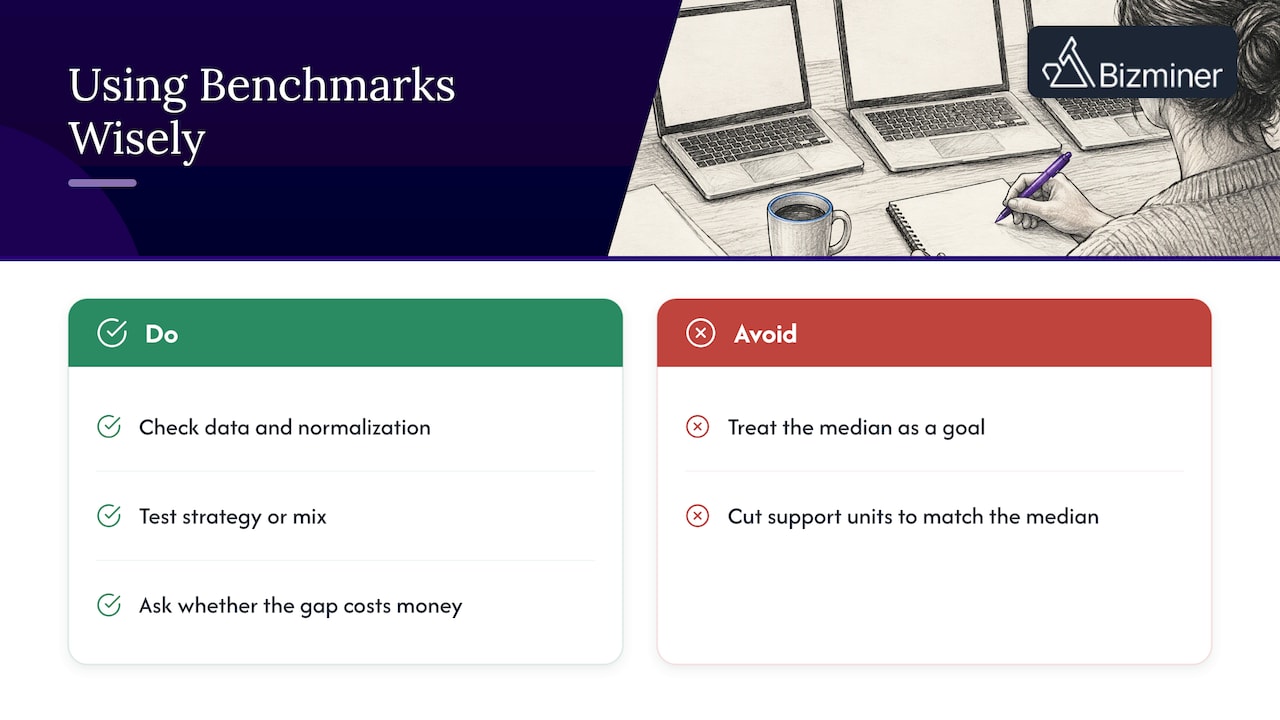
Kaplan’s argument cuts the same way for internal functions: ranking a support unit by aggregate cost or headcount assumes identical, undifferentiated output, which is rarely true of units that earn their value as partners to the business. Cutting to match the median can destroy the thing that made the unit worth having.
There is evidence that benchmarks can steer behavior in unintended ways. A study of mutual fund ratings found that Morningstar’s 2002 move from a single equity peer group to size and style categories removed a bias against growth funds, and that biased benchmarking had induced higher-risk portfolios before the changes. When people are measured against a flawed yardstick, they adapt to the yardstick.
The check: use the benchmark to generate questions, not conclusions. For every notable gap, ask three things: is the gap real (data and normalization), is it explained by strategy or mix, and is it costing money? Only a gap that survives all three belongs in a recommendation.
Mistake 8: Stopping at the report
A benchmarking study ends up in a drawer more often than it ends up changing a business. The common causes are familiar: no owner for the findings, recommendations that are not tied to numbers, and no plan to measure again.
A workable close-out looks like this:
- Pick the two or three gaps that matter most, ranked by dollar impact.
- Assign each to a named person with a target range (not a single point) and a date.
- Set the next benchmark refresh to a regular schedule, ideally aligned to fiscal year-end when new peer data arrives.
- Re-run the same peer definition so the comparison stays like for like. If you change the peer group, say so and restate the prior result.
For accountants, this follow-up is also where benchmarking becomes recurring advisory work. Our article on four ways accountants can use financial benchmarking covers how.
A quick pre-flight checklist
| Question | What a good answer looks like |
|---|---|
| Why this peer group? | Written definition by industry, size, geography and model |
| How many companies behind each ratio? | A stated count, with a wider cut checked for stability |
| Which fiscal period does it cover? | Matches the period of the subject’s numbers |
| Are definitions aligned? | Client figures reclassified to the benchmark’s categories |
| Is the gap explained? | Strategy, mix or timing ruled in or out |
| Who owns the follow-up? | A named person, a range and a refresh date |
Who is most exposed to these errors
The stakes differ by role, and so does the usual failure.
- Accountants and tax professionals face challenges to the defensibility of a comparison. A benchmark used to support a position needs a documented peer definition and a traceable source.
- Lenders often compare a borrower to a broad industry average. A borrower in a narrow niche, or a different size band, can look weaker or stronger than it is.
- Advisors and SBDCs (small business development centers) tend to meet small clients, where blended all-size averages are most misleading.
- Academic programs teach the method, and students pick up the habit of reaching for the first benchmark they find. Teaching the peer-definition step first fixes that.
- Non-profits and local planners need geography. A national industry figure rarely describes a county economy.
Our industry comps data guide covers five filters that make a comparison stand up to scrutiny, and the KPI benchmarks by industry guide shows which ratios to start with.
Where Bizminer fits
Most of the mistakes above come down to data you can cut precisely and trace back to its source. Bizminer covers more than 9,000 unique markets segmented by industry, geography and company size, so you can set the peer definition yourself instead of accepting a blended average. Our reports include larger sample sizes and detailed source lists, and the data is accepted in U.S. Tax Court and used by government agencies.
The Industry Financial Performance report is $249 per report, and the Financial Report, Market Report and Valuation Report are $349 each, all one-off. Subscriptions and custom API feeds are also available. Details are on the pricing page.

Our perspective
We built Bizminer around one belief: a benchmark is only as good as your ability to say exactly who is in it. Every mistake in this article is a version of not knowing that.
When an accountant tells a client they are below their industry on margin, the first question should be “which industry, which size, which region, how many companies?” If the answer is a shrug, the number should not travel any further. That is why we put so much weight on granularity: the ability to narrow to a niche segment, a geography and a business size, and to see the sources and sample behind the result.
Audit defensibility matters to us for the same reason. Our data is accepted in U.S. Tax Court and used by government agencies, and our reports include detailed source lists, because a comparison that cannot be explained cannot be defended.
Our advice to every professional we work with is to define the peer group before you look at the answer. Do that and most of the other errors get easier to catch.
Danny
FAQ
What is the most common benchmarking mistake?
Choosing the wrong comparison set. Using a broad industry code, a mix of company sizes or a handful of familiar competitors produces a benchmark that describes no one in particular. Define the peer group by industry, size, geography and business model, and write down why.
How many companies should a benchmark be based on?
There is no universal number. APQC says a reliable benchmark needs enough validated observations for each measure and peer group, and that thin samples should be treated as directional and corroborated with other peer groups. In practice, ask for the count behind every ratio and widen one filter at a time to see whether the result holds.
How old can benchmark data be?
Age matters less than fit. Check the fiscal period the data covers, not just the publication date, and compare against an equivalent completed 12-month period of your own. A somewhat older benchmark from a close peer group can beat a newer one from a poor match.
Should we aim to match the industry median?
No. The median is a reference point, not a goal. A gap may reflect strategy, customer mix or timing rather than a problem. Test whether the gap is real, explained and costing money before you act on it.
Sources
- APQC: How Should Organizations Interpret the Age and Time Period of Benchmark Data?
- APQC: How Many Organizations Are Needed for a Reliable Benchmark?
- Harvard Business School Working Knowledge: When Benchmarks Don’t Work
- The strategic choice of peers in M&A valuations
- Industry classification misfits: identification, consequences and more
- Tilting at Windmills: Biased Benchmarks and the Risk-Taking of Mutual Funds