An industry SWOT analysis is a SWOT run on a whole sector instead of one company: the strengths, weaknesses, opportunities and threats that apply to every firm competing in it. It is only as good as the evidence behind each cell. Opinions produce a generic list. Industry benchmarks, federal statistics and segment-level data produce a document a client, a loan committee or a tax examiner can rely on. Bizminer’s industry financial reports cover over 9,000 markets by industry, geography and company size, which is the level of detail an industry SWOT needs.
TL;DR
- An industry SWOT describes the sector, not one firm. Strengths and weaknesses are traits most competitors share. Opportunities and threats come from outside the sector.
- Every entry should point to a number: a margin, a growth rate, a share of receipts, a seasonal swing.
- Use official sources for the macro layer, such as the Census Bureau and the SBA, and segment benchmarks for the layer that decides the advice.
- Read seasonality in unadjusted data, compared year over year, so a holiday peak is not mistaken for a trend.
- Pair the SWOT with other tools. It is a starting frame, not a forecast.
Table of Contents
- What an industry SWOT is, and how it differs from a company SWOT
- Build it in five steps
- Worked example: a retail industry SWOT
- Reading seasonality without mistaking it for a trend
- Common mistakes
- Perspective
- Get the segment data behind your SWOT
- FAQ
- Sources
What an industry SWOT is, and how it differs from a company SWOT
A company SWOT asks what this firm does well and badly. An industry SWOT asks what is true of the sector for a typical participant. The distinction matters because the two get mixed up constantly, and the mix-up produces entries like “strong brand” in a retail industry analysis, which describes one retailer and tells you nothing about the sector.
A workable split:
| Quadrant | Industry-level meaning | Evidence to attach |
|---|---|---|
| Strengths | Traits most firms in the sector share and benefit from | Median profitability, stable demand, low capital needs |
| Weaknesses | Structural limits across the sector | Thin margins, high labor share, heavy inventory |
| Opportunities | Outside conditions a typical firm could exploit | Demand shifts, new channels, underserved geographies |
| Threats | Outside conditions that make success harder | Tariffs, downturns, new competitors, regulation |
OpenStax’s management textbook defines a threat as anything in the external competitive environment that makes it harder for a firm to succeed, such as an economic downturn or a competitor’s better product. It also notes that opportunities and threats can be a matter of perspective: the same shift away from car ownership can be framed as a risk or as a revenue chance. Write down which framing you chose and why.
If your client needs the firm-level view, our guide to a company SWOT analysis covers it, and a competitor SWOT handles the head-to-head version.
Build it in five steps
1. Define the industry narrowly enough to be useful
“Retail” is too broad to advise anyone. Pick a NAICS code (the federal classification system for industries), a geography and a size band. A 12-employee specialty shop in Ohio does not face the same economics as a national chain. Bizminer segments data by industry, geography and company size, so the definition you choose in step one is the filter you apply to the data, for example through the Retail Trade industry page.
2. Gather the macro layer from official sources
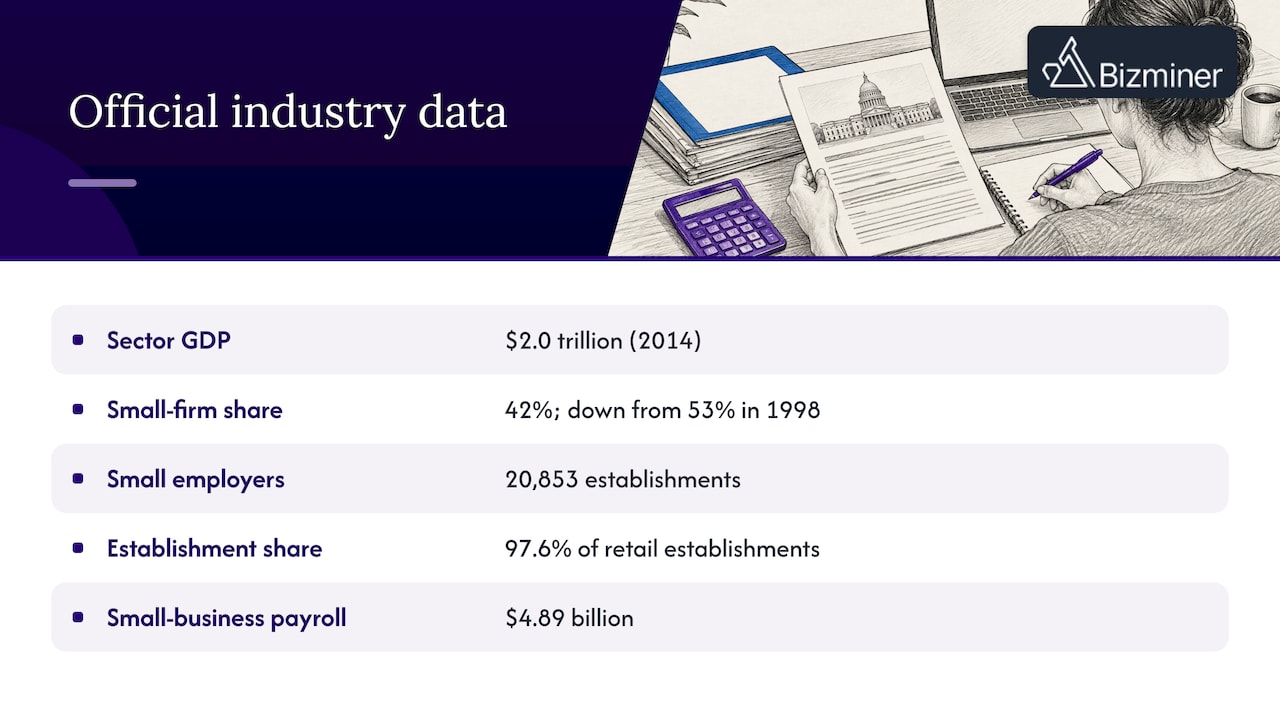
Start with free federal data for size, structure and employment. The SBA Office of Advocacy publishes it. Its report on small business GDP shows that Wholesale and Retail Trade was $2.0 trillion in 2014, with small businesses producing 42% of that industry’s GDP, down from 53% in 1998. That one line already supplies a structural entry: the small-firm share of the sector has been shrinking.
State and local analysts can go further. The SBA’s Georgia profile shows retail trade had 20,853 small employer establishments, or 97.6% of the industry’s establishments, and $4.89 billion in small-business payroll. A development center or non-profit can build a local SWOT around figures like these.
3. Add the competition and entry-barrier evidence
The SBA’s own approach to the question is a good template. When it sets size standards, it weighs five factors, including average firm size, startup costs and entry barriers, and industry competition measured by the receipts share of the four largest firms. Borrow those five lenses. Each one maps to a quadrant: low entry barriers are a weakness for incumbents and an opportunity for entrants, and high concentration is a threat to small firms.
4. Layer in segment benchmarks
Federal data tells you how big the sector is. It rarely tells you what a firm of a given size earns in a given metro area. That is where benchmarks decide the advice: margins, expense ratios, and liquidity by segment. A strength only counts if the typical firm in that segment actually shows it. Our guide to industry risk analysis shows how to turn benchmark gaps into earnings at risk, and the industry data by geography workflow covers pulling segment figures into your own models.
For lenders, SBA loan industry data explains where to find the sector evidence that supports a credit decision.
5. Score, rank and write the implication
A list of 20 bullets is not an analysis. Keep three to five entries per quadrant, rank them by size of effect, and write one sentence per entry: what it means for a typical firm and what action follows. Then state the implication for your reader’s decision, whether that is a loan, a business plan or a curriculum case.
Worked example: a retail industry SWOT
Retail is the most searched version of this exercise. Here is how the evidence translates into entries, using official figures.
Threat: policy shocks. In 2019 a proposed 25% tariff on Chinese holiday-product imports pushed one small business to consider domestic manufacturing, and enforcement was delayed until Dec. 15, 2019. The same event shows the perspective point above: a threat to importers, an opening for domestic producers.
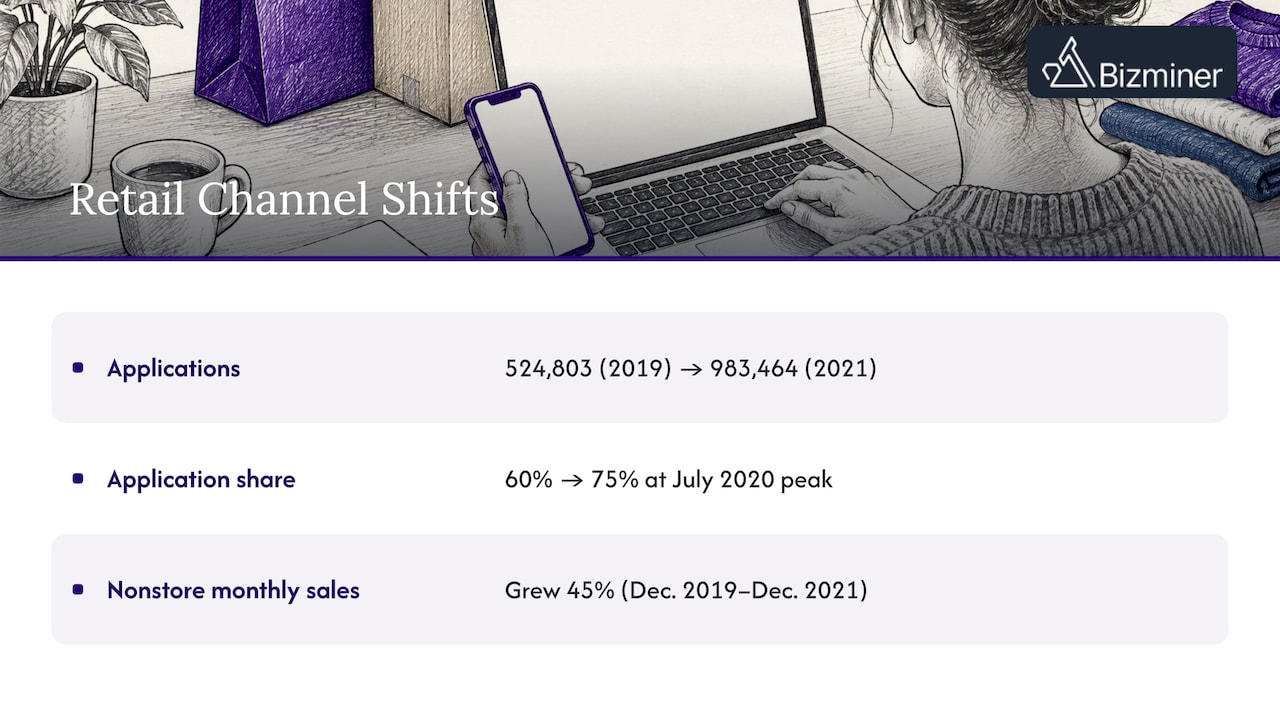
Opportunity or threat: channel shift. SBA data show retail applications rose from 524,803 in 2019 to 983,464 in 2021, nonstore retail’s share of applications went from 60% to 75% at the July 2020 peak, and nonstore monthly sales grew 45% from December 2019 to December 2021. For an established storefront this is a threat, since entry is easier and competitors multiply. For a lender evaluating a niche e-commerce borrower it is an opportunity. The quadrant depends on whose decision the SWOT serves.
Weakness: shrinking small-firm share. The decline from 53% to 42% of sector GDP, cited above, belongs here.
What remains is the layer no federal table gives you for your client: margins and expenses for their size band and region. For retail, our retail market analysis blueprint and the piece on federal datasets for retail gap analysis show how to combine public data with segment benchmarks.
Reading seasonality without mistaking it for a trend
Seasonality belongs in the SWOT because it shapes cash flow, and a loan officer or advisor will ask about it. The reader’s usual question is where to find the data and how to read it.
Where to find it. The Census Bureau’s Monthly Retail Trade series offers monthly retail sales and seasonal factors from 1992 to the present, by kind of business. Its sales are adjusted for seasonal, holiday and trading-day differences, but not for price changes.
Adjusted or unadjusted? The St. Louis Fed explains that seasonally adjusted data smooth out regular spikes and drops, while not-seasonally-adjusted data are needed to see periodic surges such as October-to-December holiday hiring. So for trend work, use adjusted series. For seasonality entries in your SWOT, use unadjusted series and compare the same months across recent years.
Separating patterns from trends. Seasonal patterns are regular, short-lived and tied to the calendar, which makes them fairly predictable. Long-term growth and decline are trends, and expansions and contractions are business cycles. The same Fed article describes how seasonal adjustment removes trend and cycle components so one-off events do not distort the seasonal factors.
Know the limits. The Census Bureau uses the X-13ARIMA-SEATS program to derive its factors and warns that adjustments are approximations that can become less precise if buying patterns during holiday periods change. If a sector’s peak has moved, as it did when online ordering grew, check that the factors still fit before you rely on them.
A practical approach: put the peak months and the size of the swing in Strengths if the sector reliably earns most of its profit then, or in Weaknesses if cash has to stretch across a long off-season. For the longer-run side, see our market trend analysis guide.
Common mistakes
- Company traits in an industry SWOT. “Great management” is a firm entry. Remove it.
- Unsourced adjectives. “Highly competitive” means little. A four-firm receipts share means something.
- Treating the SWOT as a forecast. OpenStax cautions that a SWOT only works as well as the person doing the analysis and can overlook key issues, since it is hard to imagine every threat. The CIPD likewise advises using it alongside techniques such as PESTLE and as part of ongoing monitoring, without assuming the past predicts the future.
- Mixing time periods. A 2014 GDP share and a 2021 payroll figure can sit in the same table only if each is labeled with its year.
- Ignoring size and geography. A national average hides the segment your client actually competes in.
Perspective
Most industry SWOTs fail at the same point: the evidence runs out exactly where the advice begins. Federal tables tell you the sector’s size and employment. They do not tell you what a firm of 15 employees earns in your county, and that is what a borrower, a client or a student case study turns on.
That is why we built Bizminer around granularity. Our reports let you filter by niche, geography and business size across over 9,000 markets, with larger sample sizes and detailed source lists. Our data is accepted in U.S. Tax Court and used by government agencies, so an entry in your SWOT can rest on benchmarks you can defend in front of a reviewer.
Build the macro layer from official sources, then anchor each quadrant in segment-level numbers. The analysis gets shorter and the conclusions get harder to argue with.
Danny
Get the segment data behind your SWOT
Bizminer’s one-off reports cover the evidence an industry SWOT needs. Industry Financial Performance and Industry Market reports are $249 per report. Financial Report and Market Report are $349 per report. Valuation Report is also $349. Subscriptions and customizable API feeds are available on request, and prospect lists start at $0.55 per record on Tier 3. See the full pricing page.
If your SWOT is for a client pitch, prospecting for advisors shows how the same industry findings can drive outreach.
FAQ
What is the difference between an industry SWOT and a company SWOT?
An industry SWOT covers traits and outside forces shared by the sector, so it applies to a typical competitor. A company SWOT covers one firm’s own resources and position. Use the industry version first to set the context, then the company version to place a client within it.
How many entries should each quadrant have?
Three to five ranked entries per quadrant is enough. Each should carry a figure and a one-sentence implication. Longer lists dilute the findings and usually mean entries are unsourced opinions.
Where do I find seasonality data for my industry?
For retail, the Census Bureau’s Monthly Retail Trade series gives monthly sales by kind of business from 1992 onward. Use unadjusted figures to see the peaks and compare the same months across years. For segment detail by size and region, benchmark reports fill in what national series cannot.
Can a SWOT predict where an industry is heading?
No. It is a snapshot of conditions and a way to organize them. Pair it with trend analysis and a monitoring routine, and update it when the evidence changes.
Sources
- OpenStax, Using SWOT for Strategic Analysis
- CIPD, SWOT analysis factsheet
- SBA Office of Advocacy, Small Business GDP, 1998-2014
- SBA Office of Advocacy, Georgia Small Business Economic Profile
- Federal Register, Small Business Size Standards: Retail Trade
- SBA Office of Advocacy, holiday business and tariff threat
- SBA Office of Advocacy, Business Dynamics During the COVID-19 Pandemic
- U.S. Census Bureau, Monthly Retail Trade time series
- U.S. Census Bureau, Monthly Retail Trade adjustment factors
- St. Louis Fed, Data Seasonality with FRED