
A business plan market analysis has one job: prove that a reachable, profitable market exists and that you have a credible plan to capture a realistic slice of it. That means covering six things every reader expects to see: an industry overview, a defined target market, TAM/SAM/SOM figures, a competitive breakdown, the trends driving demand, and the sources behind every number. Investor-facing plans usually run 3 to 5 pages on this section; internal plans can trim to a page if the sourcing still holds up.
TL;DR:
- Market size figures should be based on the correct NAICS code, using both top-down and bottom-up approaches for a defendable TAM estimate.
- Narrow TAM to SAM and SOM by applying realistic constraints such as geography, product features, and sales capacity, ensuring alignment with financial projections.
- Use firsthand competitor research and explicit barrier analysis to accurately identify your competitive position and potential entry challenges.
- Focus on trends that can be directly tied to demand or pricing impacts, quantifying their effect rather than relying on vague generalizations.
- Record all data sources with dates and methodology details to ensure transparency and credibility during investor review or lender evaluation.
Table of Contents
- How Do You Define Your Industry and Gather the Right Metrics?
- How Do You Calculate TAM, SAM, and SOM?
- How Do You Analyze Your Competition and Find Your Opening?
- Which Market Trends Actually Move the Needle for Your Business?
- Where Do You Find the Data, and How Do You Document It?
- How Should You Present the Market Analysis in Your Plan?
- What Does a Worked TAM/SAM/SOM Example Look Like?
- Why Do Defensible Benchmarks Matter for Your Market Analysis?
- What Do Founders Get Wrong About Market Analysis?
- Where Bizminer Fits Once You Need Numbers You Can Defend
- Where Should You Go for the Data Behind Your Numbers?
- Sources
How Do You Define Your Industry and Gather the Right Metrics?
Start by picking a NAICS code that actually matches what you sell, not the closest-sounding category. A bakery classified under “Retail Bakeries” (NAICS 311811) pulls different benchmark data than one filed under general food manufacturing, and that mismatch quietly wrecks every downstream calculation. The Census Bureau’s NAICS system is the standard classification, and it’s worth spending 20 minutes confirming your code before pulling any other data.
Once you have the code, four metrics matter more than the rest:
- Market size in dollars, at the national and (where possible) local level
- CAGR (compound annual growth rate) over the past 3 to 5 years
- Concentration, meaning whether a few large players dominate or the market is fragmented
- Margin benchmarks typical for businesses your size in that industry
Frameworks help you organize this, but don’t force every one into the plan. PESTEL (political, economic, social, technological, environmental, legal) is useful when outside forces like regulation or interest rates genuinely shape your business. Porter’s Five Forces is sharper for judging how attractive an industry actually is, since it forces you to name your suppliers’ leverage, how easily customers can switch, and what stops a new competitor from walking in tomorrow. Guides on the Five Forces method note that supplier concentration and buyer power feed directly into your pricing assumptions later in the plan, so don’t treat this as an academic exercise.
For sourcing, the SBA’s business planning guidance points to a short list of free federal datasets worth bookmarking: Census Business Builder for industry counts, the Bureau of Labor Statistics for employment and wage data, and the Bureau of Economic Analysis for spending patterns. Industry trade associations often round out the picture with margin and concentration figures the federal sources don’t break out.
How Do You Calculate TAM, SAM, and SOM?
Segment your customers first, because sizing without segmentation produces a number nobody can defend. Most plans use some mix of demographic (age, income), geographic (metro area, region), behavioral (purchase frequency, brand loyalty), and firmographic (company size, industry) segmentation, depending on whether you sell to consumers or businesses. A regional HVAC company might segment by homeowner age and home value; a B2B software tool might segment by employee count and industry vertical.
With segments defined, work through sizing in this order:
- Calculate TAM (Total Addressable Market) using a top-down or bottom-up approach. Top-down starts with a published industry figure and narrows it by geography or segment. Bottom-up starts with a unit price times a realistic number of potential buyers and builds up. Bottom-up almost always produces a more defensible number because every input traces back to something you can source.
- Narrow TAM to SAM (Serviceable Addressable Market) by applying the constraints that actually limit you: geography you can service, product features you currently offer, price points your target segment will pay.
- Derive SOM (Serviceable Obtainable Market) from your actual go-to-market capacity, not a round percentage of SAM. If your sales team can realistically make 200 outreach calls a month at a 4% close rate, that arithmetic gives you a SOM figure nobody can wave away as invented.
Statistic Callout: Practical guides on market analysis consistently flag that investors scrutinize SOM far more than TAM, and they reject SOM figures that don’t reconcile with the revenue line in your financial projections. A TAM slide means nothing if your SOM assumes capturing a small percentage “because that seems conservative.” Tie the number to sales visits, ad spend, and cost-per-lead, or production capacity instead, and pilot the assumption with even a small test run before you commit to it in writing.
Document every assumption in a short footnote or appendix table: where the base number came from, what filter you applied, and why. A step-by-step market sizing resource can help you reconcile top-down and bottom-up estimates when they land far apart, which happens more often than most first-time founders expect.
How Do You Analyze Your Competition and Find Your Opening?
List your direct competitors first, meaning businesses selling the same solution to the same customer. Then list indirect competitors, the ones solving the same underlying problem a different way. A meal-kit delivery service competes directly with other meal-kit brands, but indirectly with grocery delivery apps and even frozen dinner aisles.
Build a compact competitor matrix covering:
- Pricing tier and typical customer size
- Primary sales channel (direct, retail, online, referral)
- One clear strength and one clear weakness each
- Estimated market share, even if it’s a rough qualitative band like “dominant,” “established,” or “niche”
Pro Tip: Call three of your competitors’ customer service lines or visit their locations before you write this section. Twenty minutes of firsthand observation about how they actually treat customers will surface a real weakness that no industry report will ever hand you.
Barriers to entry matter as much as the competitor list itself. High capital requirements, licensing hurdles, or entrenched brand loyalty all raise the bar for you and for whoever comes after you. Note them explicitly, because a plan that ignores barriers reads as naive to anyone who’s evaluated a few hundred pitches. Comparing your numbers against small business benchmarks helps you judge whether a competitor’s advantage is structural or just a temporary lead.
Close the section with a two or three sentence positioning statement: who you serve, what you do better than the alternatives, and why that gap is durable rather than easily copied.
Which Market Trends Actually Move the Needle for Your Business?
Not every trend deserves space in your plan. The ones worth including are the ones you can tie directly to a demand or pricing assumption three pages later in your financial model.
Start with government indicators before anything else:
- BLS employment and wage data shows whether your target customer’s income is rising or shrinking in your region
- BEA consumer spending figures reveal category-level spending shifts
- Google Trends offers a fast, free directional check on search interest, though it’s a signal, not a statistic
- Census Business Builder tracks establishment counts over time, a useful proxy for how crowded a market is getting
Separate cyclical trends from structural ones, because they belong in your forecast differently. A cyclical trend, like a slowdown tied to interest rates, should soften your near-term projections without changing your long-term thesis. A structural trend, like a permanent shift toward remote work reshaping commercial real estate demand, should reshape the thesis itself.
Statistic Callout: Federal Reserve interest rate releases are worth checking directly if your business depends on financing costs, whether that’s customer credit, your own working capital line, or big-ticket purchases your customers finance. A half-point rate shift can move a customer’s buying decision more than any marketing trend you’ll find in a magazine article.
Quantify impact wherever you can rather than gesturing at a trend vaguely. “Remote work is growing” says nothing useful; “co-working space demand in secondary metros rose alongside remote work adoption, per BLS regional employment data” gives an underwriter something to actually check.
Where Do You Find the Data, and How Do You Document It?
Free sources cover you for roughly 70% of what a market analysis needs, and you should exhaust them before spending a dollar. Start here:
- data.census.gov and Census Business Builder for industry counts and demographic overlays
- BLS.gov for employment, wages, and regional labor data
- BEA.gov for GDP and consumer spending trends
- Federal Reserve releases for interest rate and credit condition data
- CPSC.gov if your product category involves safety regulation
Primary research fills the gaps those sources can’t reach, particularly local pricing and customer willingness to pay. A business research tutorial on market planning recommends pairing secondary data with a short primary study, such as a 15 to 20 question survey sent to 50 to 100 prospective customers, or a small pilot sale to test actual conversion. You don’t need statistical significance for a business plan; you need directionally honest numbers you’re willing to defend in a meeting.
Buy paid, granular data when the free sources run out of local detail, which happens constantly once you move past national averages. A tool built for granular industry financial benchmarks fills that gap, particularly for local market sizing and margin comparisons that national datasets simply don’t break out by geography.
Whatever mix you use, record it. A one-paragraph methodology note, listing each figure’s source and the date it was pulled, turns a plan that reads like a guess into one that reads like due diligence.
How Should You Present the Market Analysis in Your Plan?
Structure the chapter the same way you researched it, in a logical sequence a reader can follow without flipping back and forth.
- Industry overview (size, growth rate, structure) — roughly half a page
- Target market and segmentation — a half page to one page, including your TAM/SAM/SOM figures
- Competitive analysis — one page, anchored by your competitor matrix
- Market trends and drivers — a half page, focused on the two or three trends that actually move your forecast
- Sources and methodology — a short paragraph or appendix note
Investor decks usually compress this into 3 to 5 pages total; an internal operating plan can run one to two pages if the sourcing is still airtight. Three visuals do more work than any amount of prose: a SOM calculation table showing the arithmetic from TAM down to SOM, a competitor matrix, and a simple trend line chart if you have multi-year data to show.
Before you call the section done, run this check: every source has a date attached, your SOM figure matches the revenue assumption in your financial model exactly (not “roughly”), and your methodology note is specific enough that someone else could reproduce your numbers.
What Does a Worked TAM/SAM/SOM Example Look Like?
Take a hypothetical specialty pet grooming business planning to open in a mid-sized metro area of about 500,000 people.
Assumptions:
- National pet grooming and boarding services market: roughly $12 billion annually (industry association estimate)
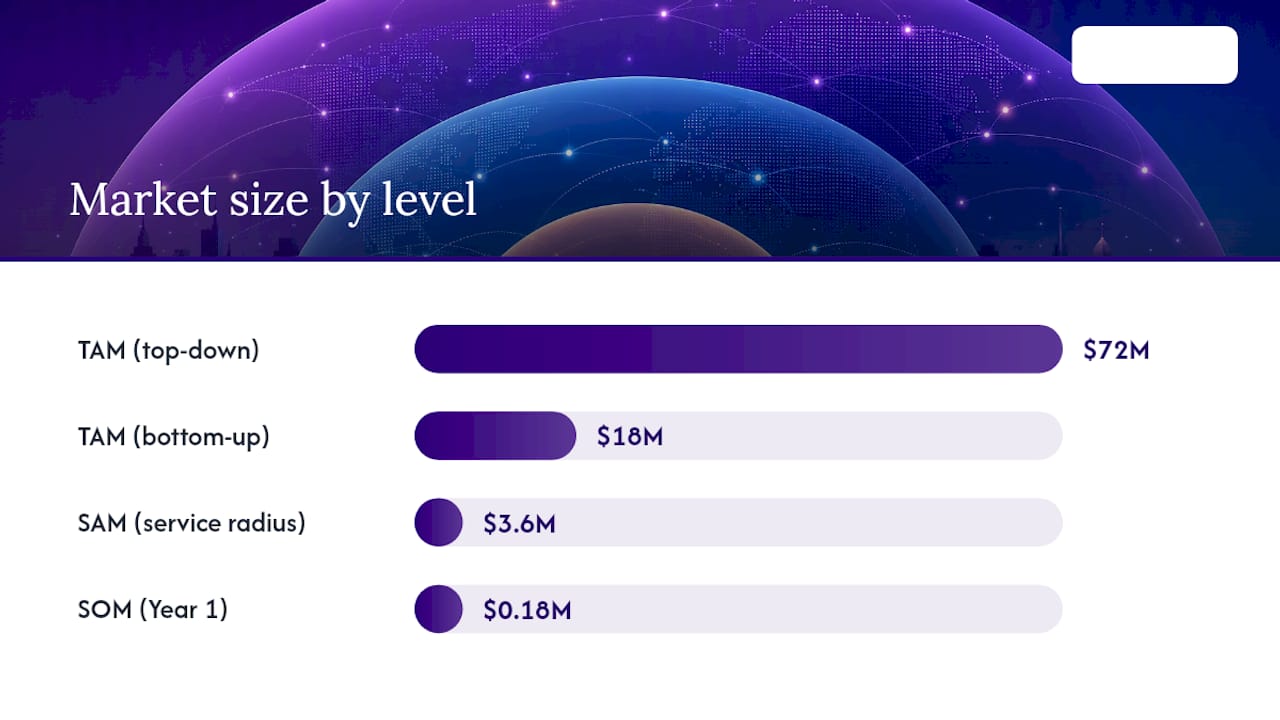
- Metro area represents about 0.6% of national population, giving a rough top-down local TAM of $72 million
- Bottom-up check: an estimated 40,000 dog-owning households in the metro area, average annual grooming spend of $450, gives a bottom-up TAM of $18 million
- SAM narrows this to households within a 10-mile service radius willing to pay premium pricing, roughly 8,000 households, or $3.6 million
- SOM assumes capturing 5% of SAM in year one based on a planned marketing budget supporting 15 new client acquisitions per month, giving a first-year SOM of roughly $180,000
| Metric | Method | Value |
|---|---|---|
| TAM (top-down) | National share by population | $72 million |
| TAM (bottom-up) | Households × average annual spend | $18 million |
| SAM | Serviceable households in service radius | $3.6 million |
| SOM (Year 1) | 5% capture via planned acquisition rate | $180,000 |
Paragraph to paste into a plan: "The specialty pet grooming market in our metro area represents an estimated $18 million bottom-up TAM based on 40,000 dog-owning households spending an average of $450 annually. Narrowing to households within our service radius and price tier yields a SAM of $3.6 million.
Sources and assumptions checklist: household count sourced from Census data, average spend from an industry association survey, acquisition rate tied to a specific marketing budget and expected conversion rate, all figures dated and footnoted.
Why Do Defensible Benchmarks Matter for Your Market Analysis?
Free federal data gets you most of the way, but it rarely breaks down to your specific city or ZIP code, which is exactly where SOM claims fall apart under scrutiny. Bizminer covers more than 9,000 individual markets with the kind of local granularity that Census tables don’t offer, and its data has been accepted in U.S. Tax Court and used by government agencies, which says something about how it holds up under real examination.
Reach for a paid benchmark when you need to:
- Stress-test a SOM figure against actual local competitor performance
- Pull margin and ratio benchmarks specific to your industry code and region
- Support a loan application or investor deck with third-party sourced numbers instead of self-reported estimates
What Do Founders Get Wrong About Market Analysis?
The mistake I see most often is an inflated TAM paired with an uncited SOM, as if bigger numbers make a plan more convincing. They don’t. They make it look untested. The second most common failure is a SOM figure that quietly contradicts the revenue line in the financial projections three pages later, which any careful reader catches immediately.
Before you submit a plan, run one last pass: every figure has a source and a date, your SOM math is shown rather than asserted, and your competitive claims are specific enough that a stranger could verify them. That checklist takes fifteen minutes and saves you from the single fastest way to lose credibility with a lender or investor.
— Danny
Where Bizminer Fits Once You Need Numbers You Can Defend
Bizminer is the paid option for founders who’ve done the free-data legwork and still need local granularity or a benchmark that holds up under a lender’s or investor’s questions. Its core offering is industry financial benchmarks and custom market reports across more than 9,000 individual markets, built from public and private datasets rather than self-reported averages.

If your plan needs a local SOM stress test, the market and industry research reports cover your exact NAICS code and geography. If you’re building out margin assumptions for the competitive section, the financial ratios glossary breaks down which profitability ratios matter for your industry and how to calculate them correctly. And if you want a fully customized dataset built around your specific market questions rather than a standard template, the custom analysis report service builds it from your parameters directly. Pick the report that matches the number you’re least confident defending, and start there.
Where Should You Go for the Data Behind Your Numbers?
- NAICS lookup and industry classification: Census
- Employment, wage, and labor market data: Bls
- Local market sizing and industry benchmarks: Bizminer’s local market analysis
- Step-by-step TAM/SAM/SOM reconciliation: Bizminer’s market sizing guide