Benchmarking for CPAs means producing NAICS-granular, normalized peer comparisons that hold up as evidence in advisory, valuation, and lending work. The first move on any engagement is assigning the client’s 4 to 6 digit NAICS code and revenue band, then pulling median and P25/P75 ratios from a source like Bizminer or RMA. Skip the granularity step and everything downstream, from a loan memo to a valuation appendix, gets weaker.
TL;DR:
- Precise NAICS coding and normalization are essential to ensure benchmark comparisons are credible and robust for advisory, valuation, and lending purposes.
- Using median, P25, and P75 ratios from shredded data sets helps identify significant deviations and supports stress testing scenarios.
- Proper peer set filtering based on NAICS, size, and geography, with clear documentation, prevents scale distortions and potential challenges.
- Benchmarks should be documented with source data, date, and filters, and every normalization needs supporting evidence to withstand underwriter or court scrutiny.
- Recurring benchmarking services can transform compliance tasks into advisory opportunities, provided they are integrated into ongoing client reviews.
Table of Contents
- Why Precise Benchmarking Changes Outcomes for Advisory, Valuation, and Lending
- How Do You Build a Defensible Benchmark From Scratch?
- What Do Lenders and Courts Expect to See in a Benchmark Package?
- What Are the Most Common Benchmarking Mistakes, and How Do You Catch Them?
- Turning Benchmarking Into a Standing Advisory Service
- Get NAICS-Granular Reports That Hold Up in Court and in Underwriting
- Sources
Why Precise Benchmarking Changes Outcomes for Advisory, Valuation, and Lending
Lenders don’t read financial statements in a vacuum. They run quick checks against DSCR and liquidity benchmarks before a loan officer even calls the client back, and many programs expect a debt service coverage ratio somewhere in the 1.15 to 1.35 range depending on the industry and program. Miss that band without a documented explanation, and the file stalls.
Valuations lean on the same logic through guideline-company multiples: EV/EBITDA, EV/Revenue, Price/SDE. Accuracy here depends almost entirely on how tightly the comparable set matches the subject company by NAICS code, size, and growth profile. A sloppy comp set invites a lower multiple, or a fight with opposing counsel.
The upside cuts the other way too. CPAs who build benchmarking into recurring client reviews turn a compliance task into an advisory offering. Firms that use structured benchmarking and defined industry niches report stronger CAS growth and higher fees than firms that treat industry comparison as an afterthought.
What benchmarking actually buys a client:
- A lender-ready DSCR and liquidity check before the bank asks
- A defensible multiple range for a sale, buyout, or estate valuation
- Early warning on margin erosion versus peers, months before cash flow shows it
- A pricing baseline for advisory conversations about cost structure
Quick benchmark: many lender programs treat a DSCR below 1.15 as a red flag requiring explanation, while ratios above 1.35 are typically viewed as comfortable headroom.
How Do You Build a Defensible Benchmark From Scratch?
The workflow is the same whether you’re prepping a loan package or a valuation report. Skipping a step is what gets benchmarks challenged later.
- Nail down NAICS and revenue band. Push for a 4 to 6 digit code, not the generic 2 digit sector. A construction subcontractor coded only at the 2 digit “Construction” level gets averaged against general contractors and highway builders that have nothing in common with its margin structure.
- Normalize the client’s financials. Strip owner-specific perks, one-time gains, and related-party transactions. Every adjustment needs a paper trail: an invoice, a lease amendment, a bank statement. Unsupported normalizations are the first thing opposing counsel or an underwriter will attack.
- Filter the peer set. Match on NAICS, then hold revenue within roughly 2 to 3 times the client’s size to avoid scale distortions, and add geography if labor or regulatory costs vary regionally. Pull median, P25, and P75, not just an average.
- Compute the core ratios. Gross margin, net margin, EBITDA margin, current ratio, DSCR, revenue per employee, inventory turnover, and AR days cover most advisory and lending questions.
- Set variance thresholds and write the narrative. Flag anything more than one standard deviation from the peer median and explain it in plain language, not just a number in a table.
- Stress test. Run a quick scenario, a 10% input cost increase is a common one, and show how margin and DSCR move.
- Assemble the deliverable. Attach the comparability filters, source dataset and date, normalization support, and the narrative memo.
Pro Tip: Keep a one-page comparability matrix in every valuation or loan file listing each filter applied, NAICS, revenue band, margin spread, geography, and the exact dataset and date pulled. It turns a two-hour cross-examination question into a thirty-second answer.
What Do Lenders and Courts Expect to See in a Benchmark Package?
Underwriters and expert witnesses ask the same basic question in different words: how do I know this comparison is fair? The answer has to be on paper, not in your head.
- Comparable selection. List the NAICS codes, size filters, and growth or margin screens used to build the peer set, and explain any manual exclusion.
- DSCR and covenant sizing. Use the peer median DSCR as a sanity check against the proposed covenant, and flag if the client sits below the typical 1.15 to 1.35 lender range.
- Normalization evidence. Underwriters and opposing experts will ask for the invoice, lease, or payroll record behind every adjustment, not just the adjusted number itself.
- Reporting quality. Clean monthly management accounts and consistent chart-of-accounts mapping reduce the risk premium a buyer or lender attaches, and stronger reporting infrastructure tends to support higher transaction multiples.
- Appendix language. A short paragraph stating the dataset, its date, the NAICS code and revenue filter, and the rationale for any substitution or widened band.
None of this needs to be elaborate. It needs to be consistent, dated, and attached.
What Are the Most Common Benchmarking Mistakes, and How Do You Catch Them?
Most benchmarking failures trace back to one of four habits, and all four are fixable with a checklist rather than more software.
- Defaulting to 2-digit NAICS because it’s faster to find data. It’s also the fastest way to introduce the exact aggregation bias the 2026 sector study measured.
- Accepting a normalization without a source document. If there’s no invoice, contract, or bank record behind an add-back, treat it as unproven until someone produces one.
- Comparing against peers 5 or 10 times the client’s revenue. Stick to the 2 to 3x band, and if you must go wider for a thin dataset, say so in writing.
- Ignoring seasonality and startup effects. A business in its second year of operation, or one with a heavy fourth-quarter season, needs adjusted thresholds, not the same variance band you’d apply to a mature, steady-state company.
Pro Tip: Before any benchmark package leaves the office, have a second preparer confirm three things: the NAICS code matches the client’s actual revenue mix, every normalization has an attached document, and the peer set falls inside the 2 to 3x revenue band. That thirty-second review catches most of the errors that come back to bite you in a deposition.
Turning Benchmarking Into a Standing Advisory Service
Benchmarking earns its keep when it’s recurring, not a one-time exercise buried in a valuation file. That’s a concrete, sellable conversation, and it’s the kind of forward-looking work that shifts a CPA relationship from compliance to advisory.
Start small. A quarterly cadence with three to five pilot clients across different NAICS codes is enough to prove the model before rolling it firmwide, and it gives you real variance data to tune your thresholds against.
— Danny
Get NAICS-Granular Reports That Hold Up in Court and in Underwriting
Bizminer gives CPAs the one thing generic industry averages can’t: benchmark data cut to the exact NAICS code and revenue band a client actually competes in, not the broad sector bucket that blurs everything together. That granularity is what stands up to a skeptical underwriter or an opposing expert, and Bizminer’s data has already cleared that bar, having been accepted in U.S. Tax Court.

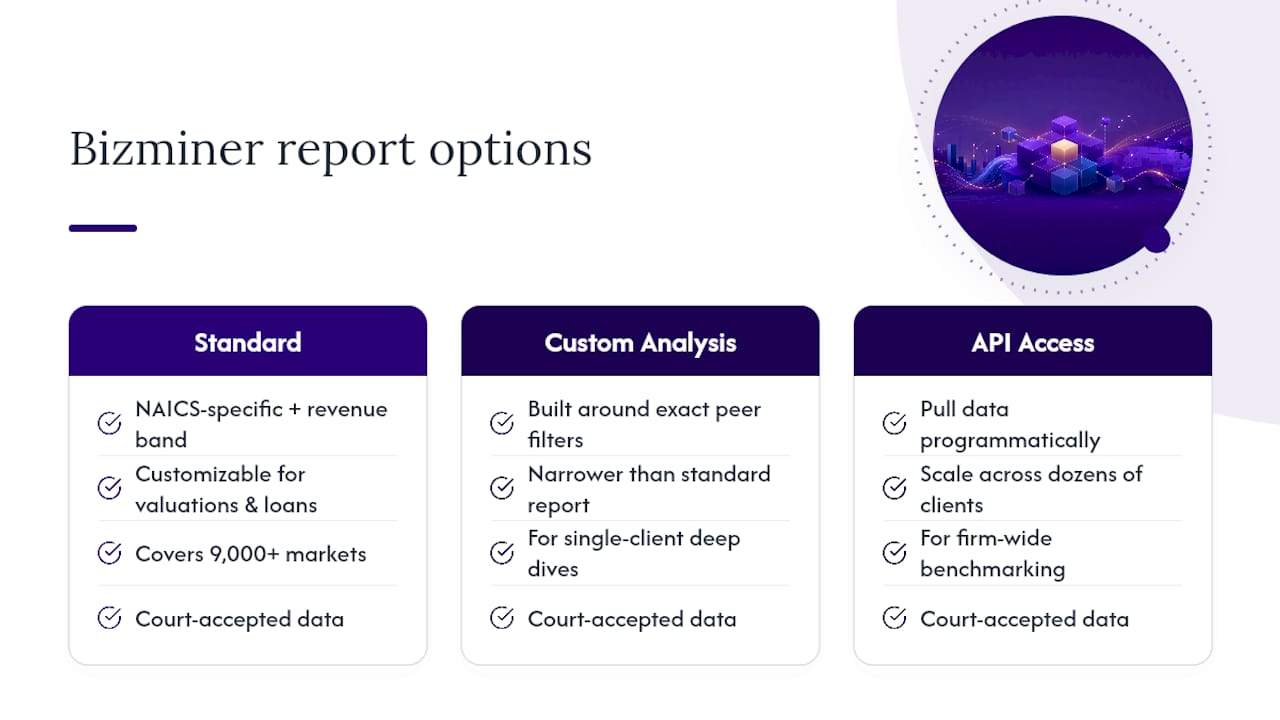
The platform covers more than 9,000 markets with customizable reports built for valuation appendices, loan packages, and recurring advisory dashboards. Need something narrower than a standard report? Order a custom analysis built around your client’s exact peer filters, or pull data through API access for a firm running benchmarks across dozens of clients at once. If you’re preparing a loan file or a valuation this quarter, start by pulling a sample report through Bizminer’s market and industry research tool and check the NAICS coverage for your client’s exact code before you build the rest of the file around it.
This article is general information, not a substitute for advice from a qualified financial advisor. Consult a qualified financial professional about your own circumstances before acting on anything here.
Sources
No single source covers every situation, so the practical approach is to match the source to the job. RMA remains a common reference point for lender-facing ratio checks because underwriters already know its format. Bizminer fills the gap RMA often leaves: customizable, NAICS-granular reports across more than 9,000 markets, with documentation that has been accepted in U.S. Tax Court. SBA data, BLS wage and productivity figures, and trade association surveys round out context, especially for regulatory or labor-cost questions a pure financial ratio won’t answer.
Granularity is not a nice-to-have. A 2026 study on sector aggregation bias found that using broader two-digit NAICS groupings introduces material valuation bias compared to more granular four-digit groupings, largely because within-sector dispersion widens sharply once you zoom in. Treat sector code selection as the single biggest lever in the whole exercise, ahead of most modeling choices.
Where granularity gets thin: some 6-digit NAICS cells have too few reporting businesses for a stable median. When that happens:
- The importance of normalizing financial statements for business valuation (Mercer Capital)
- Financial health benchmarks by industry (2026)
When RMA coverage is thin for a niche code, supplement with Bizminer or association data and note the substitution in your workpapers. Document every source, every dataset version, and the date it was pulled. A benchmark without a date attached is a benchmark nobody can defend a year later.