
Retailers and manufacturers tie up the most working capital, largely because inventory dominates their balance sheets, while asset-light service businesses run lean on cash needs but live or die on collection speed. The cash conversion cycle (CCC) is the sharpest cross-industry metric because it isolates operating timing rather than providing a snapshot ratio. The benchmarks below draw on Aswath Damodaran’s sector dataset, the J.P. Morgan Working Capital Index, and Bizminer’s NAICS-level reporting.
TL;DR:
- Inventory-heavy sectors like retail and aerospace typically have inventory-to-sales ratios three to five times higher than service industries, affecting their cash flow timing.
- When benchmarking working capital, selecting the most granular NAICS cohort and adjusting for size and seasonality ensures more accurate comparison instead of relying on broad sector averages.
- The cash conversion cycle provides a comparable measure across industries by focusing on days rather than dollar amounts, making it useful for assessing efficiency regardless of business model.
- Sector-specific risks such as demand volatility, reimbursement delays, or supply-chain disruptions directly influence working-capital needs and should inform management strategies.
- Using detailed datasets like Bizminer enables more precise industry and regional benchmarks, essential for tailored working-capital analysis and client reporting.
Table of Contents
- Working Capital by Industry: A Benchmark Table
- Key Working-Capital and Liquidity Metrics: Definitions and When to Use Each
- Why Working-Capital Benchmarks Vary by Industry
- How to Benchmark a Company Against Industry Peers
- Recent Trends Reshaping Working-Capital Benchmarks
- Why Bizminer Data Adds Value for Industry Benchmarking
- Working-Capital Strategy Looks Different in Every Sector
- Sector-Specific Risks That Strain Working Capital
- How Working Capital Shapes Efficiency and Profitability
- Presenting Benchmarks Without Overselling Them
- Get Granular Benchmarks Instead of Broad Sector Averages
- Sources
Working Capital by Industry: A Benchmark Table
The industries below sit at opposite ends of the working-capital spectrum, and the gap is not subtle. Inventory-heavy sectors routinely carry inventory-to-sales ratios three to five times higher than service industries, while receivables patterns swing just as widely based on who the customer is and how long they take to pay.
The table pulls accounts receivable and inventory ratios primarily from Damodaran’s dataset (data through January 2026), with cash conversion cycle context informed by J.P. Morgan’s index. Figures are approximate sector medians, not universal constants; individual companies inside each sector can vary widely by size and business model.
Some cells are intentionally described qualitatively rather than with a precise percentage where the underlying dataset reports the metric only in relative or trend terms rather than a fixed number. The pattern that jumps out: inventory-heavy sectors like aerospace and retail sit at one extreme, restaurants and software sit at the other, and the middle is occupied by industries where billing cycles, not physical goods, drive the cash lag.
Key Working-Capital and Liquidity Metrics: Definitions and When to Use Each
Ratio selection matters more than most analysts admit. Each metric answers a slightly different question, and picking the wrong one for the wrong industry produces a misleading benchmark.
- Current ratio = current assets ÷ current liabilities. Broad liquidity snapshot; distorted by slow-moving inventory in retail or manufacturing.
- Quick ratio = (current assets minus inventory) ÷ current liabilities. Better for inventory-heavy sectors where goods on the shelf aren’t truly liquid.
- Cash ratio = cash and equivalents ÷ current liabilities. The strictest test, useful for stress scenarios or distressed-company reviews.
- Cash conversion cycle (CCC) = DSO + DIO − DPO, where DSO is days sales outstanding, DIO is days inventory outstanding, and DPO is days payable outstanding.
The OpenStax liquidity ratio primer notes a current ratio of roughly 2:1 is often flagged as “healthy,” but that threshold breaks down fast once you cross industries. A software firm with a 1.2 current ratio may be perfectly stable; a homebuilder with the same number could be in real trouble. CCC solves that blind spot by measuring days, not dollars, so a semiconductor company and a grocery chain can be compared on the same scale.
Why Working-Capital Benchmarks Vary by Industry
Structural differences, not management skill alone, explain most of the gap between sectors. Inventory-heavy businesses like aerospace, industrial equipment, and general retail post high DIO because physical goods sit on shelves or in warehouses for weeks or months before conversion to cash. Service and information businesses skip that step entirely, so their working-capital profile lives almost entirely in receivables and payroll timing.
- Manufacturing and construction often carry hidden inventory in the form of work-in-progress, which inflates true inventory intensity beyond what a simple inventory-to-sales ratio shows.
- Healthcare providers face reimbursement lag from insurers, pushing DSO well above what a comparably sized retail business would ever tolerate.
- Restaurants show almost no accounts receivable (customers pay immediately) but absorb heavy payroll costs, a working-capital driver that ratio analysis alone tends to undercount.
- Construction firms deal with long project timelines and progress billing, which distorts both receivables and payables in ways that a single-quarter snapshot misses.
Pro Tip: When benchmarking a manufacturer, check the inventory footnotes for work-in-progress and raw materials breakdowns separately. A company can look lean on finished-goods inventory while carrying weeks of unbilled WIP that never shows up in a headline inventory-to-sales figure.
How to Benchmark a Company Against Industry Peers
A defensible benchmark follows a repeatable process, not a single ratio pulled from a database.
- Select the peer cohort. Match the target company to its NAICS code at the most granular level available, rather than a broad two-digit sector.
- Filter by size. Revenue and employee count both shift working-capital norms; a $2 million retailer and a $200 million retailer rarely share the same DSO or DIO patterns.
- Choose median over mean, and report quartiles. Outliers skew averages badly in small cohorts.
- Adjust for seasonality. Use trailing-12-month figures rather than single-quarter snapshots, especially for retail, agriculture, and construction.
- Sanity-check against disclosures. Cross-reference the benchmark against the company’s own 10-K or financial statements before presenting it to a client or stakeholder.
Use Damodaran’s sector tables for broad cross-industry ratio components, the J.P. Morgan index for CCC trend direction, and Bizminer’s industry financial benchmarks when the client needs a NAICS-level split that public datasets don’t offer.
Statistic callout: A 10-day increase in DIO for a company with $50 million in cost of goods sold ties up roughly $1.4 million in additional inventory investment, cash that would otherwise be available for debt paydown, hiring, or reinvestment. That’s the kind of sensitivity scenario worth running before finalizing any benchmark-based recommendation.
Recent Trends Reshaping Working-Capital Benchmarks
J.P. Morgan’s Working Capital Index estimates roughly $707 billion in trapped working capital across industries, a figure driven by inventory buildups and slower collections that started during supply-chain disruptions and never fully unwound. Some sectors compressed their cycles as conditions normalized; others kept stretching.
- Semiconductors saw among the largest DIO increases as manufacturers overbuilt inventory to hedge against chip shortages, then got stuck holding it.
- Pharmaceutical companies extended their CCC as regulatory and distribution timelines lengthened.
- Upstream oil and gas firms saw working-capital swings tied to volatile input costs and long project cycles.
For forecasting, the practical takeaway is to lean on trailing 12-month medians rather than the most recent quarter, and build in a scenario adjustment for supply shocks rather than assuming the pre-2022 benchmark baseline still holds.
Why Bizminer Data Adds Value for Industry Benchmarking
Public datasets give you the broad strokes; Bizminer fills in the detail. Its coverage spans over 9,000 industry and market segments at the NAICS level, and its data has been accepted in U.S. Tax Court and used by government agencies, a bar most industry data providers never clear. Analysts use it for client deliverables, expert-witness support, and custom cohort reports where a broad sector average is too blunt to defend.
Working-Capital Strategy Looks Different in Every Sector
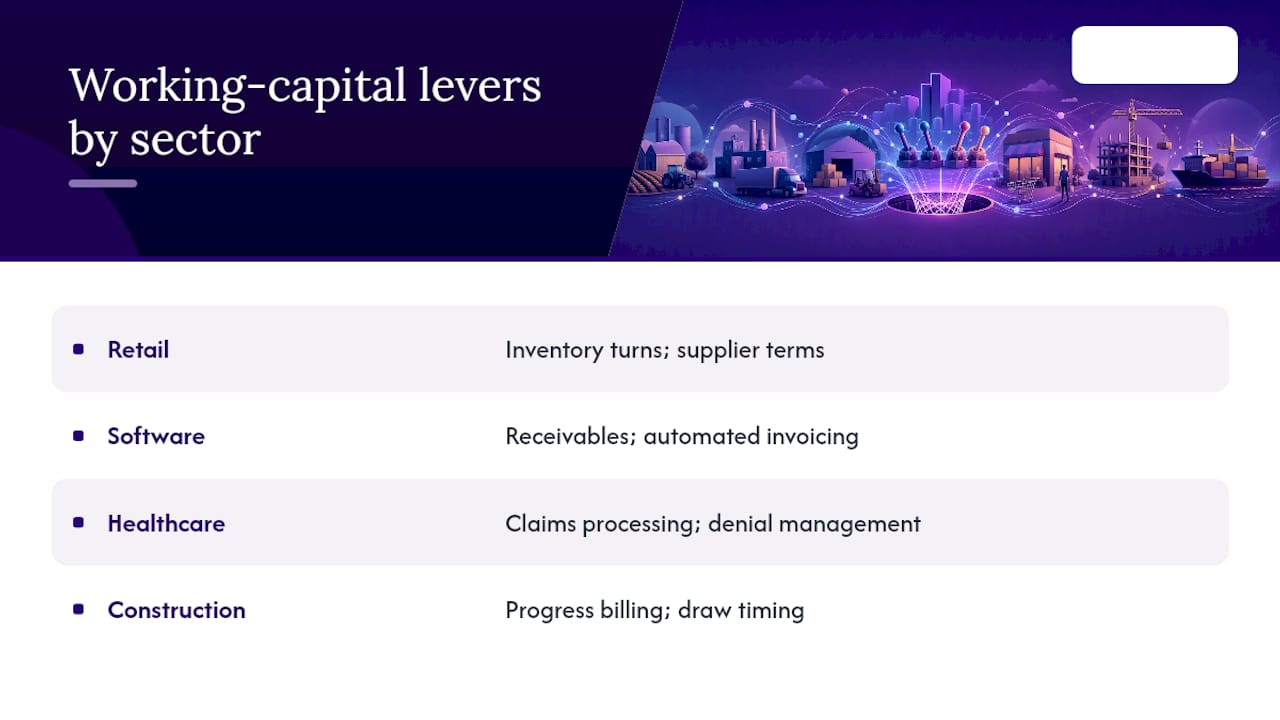
A retailer managing working capital focuses almost entirely on inventory turns and supplier payment terms, because that’s where the cash is locked. Extending DPO by even five days across a $100 million cost-of-goods base frees up meaningful cash without touching sales or margins. A software company, by contrast, has almost no inventory to manage, so its working-capital strategy centers on collections: shortening DSO through tighter contract terms or automated invoicing.
Healthcare organizations play a different game entirely. Reimbursement delays from insurers mean the strategic lever isn’t inventory or even collections in the traditional sense. It’s claims processing speed and denial management, both of which function as working-capital tools even though they rarely get labeled that way. Construction firms manage working capital through progress billing schedules, timing draw requests to stay ahead of subcontractor payments rather than behind them.
The common thread across all of these strategies is that management effort should follow the balance sheet. A manufacturer spending its energy on receivables automation while ignoring a bloated raw-materials stockpile is optimizing the wrong lever. Benchmarking against the right industry cohort tells you which lever actually matters before you spend a quarter fixing the wrong problem. That’s the practical value of matching strategy to sector rather than applying a generic playbook.
Sector-Specific Risks That Strain Working Capital
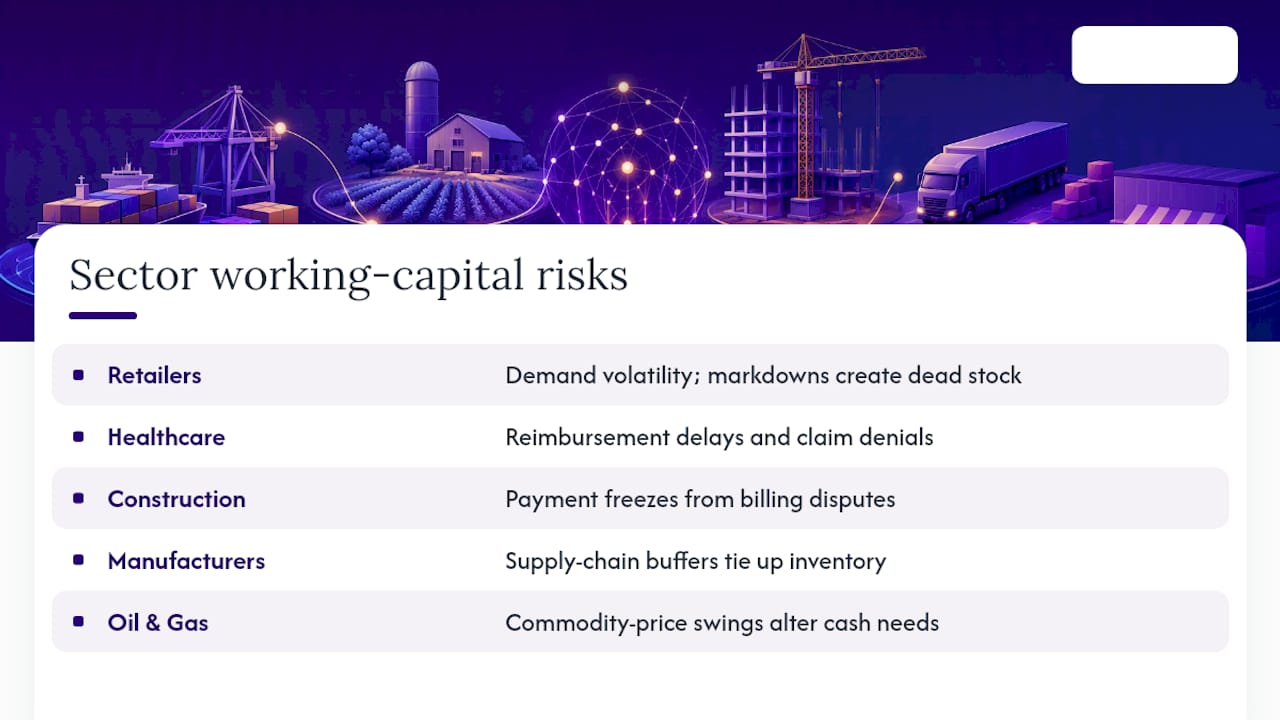
Every industry carries a working-capital risk that looks nothing like its neighbor’s. Retailers face demand volatility and markdown risk. Overstock a seasonal line and inventory sits as dead cash until it’s cleared at a loss, a problem that shows up in the balance sheet months before it hits the income statement.
Healthcare providers carry reimbursement risk that’s largely outside their control. Insurance claim denials and processing delays can stretch DSO well past the 60 or 90 day marks that would trigger alarm in most other sectors. Construction firms face the opposite problem: payment risk tied to project completion. Disputes over milestone billing or change orders can freeze cash flow mid-project, even when the underlying work is progressing on schedule.
Manufacturers and semiconductor firms face a newer risk that didn’t loom as large a decade ago: supply-chain driven inventory distortion. Building a buffer stock to guard against shortages is rational in isolation, but it also means capital sits idle on shelves for months, exposed to obsolescence if demand or technology shifts before that inventory moves. Oil and gas upstream operators deal with commodity price volatility that can swing working-capital needs dramatically within a single fiscal year, since input costs and project economics move together.
Recognizing which risk applies to a given sector changes what an analyst should flag first in a client review, and it’s rarely the same risk twice.
How Working Capital Shapes Efficiency and Profitability
The connection between working capital and profitability is not abstract. A grocery chain that shortens its inventory cycle from 45 days to 35 days frees up cash that would otherwise sit in the warehouse, and that cash can pay down debt or fund store remodels instead of sitting on shelves. The efficiency gain shows up as improved return on invested capital even before any change in gross margin.
Contrast that with a staffing agency, where the working-capital lever is almost entirely receivables. Cut DSO from 50 days to 35 days, and the freed cash can cover payroll without drawing on a line of credit, directly reducing interest expense. That’s a profitability improvement that never touches the pricing or cost structure at all.
Manufacturers show the clearest cause and effect. A company holding excess raw-material inventory ties up cash and absorbs carrying costs like storage, insurance, and obsolescence risk. Trim that inventory to match actual production velocity, and the savings drop straight to the bottom line. The reverse is just as real: a company that runs too lean on inventory risks stockouts that cost more in lost sales than the working capital it saved. Working capital, in every one of these cases, is not a balance-sheet abstraction. It’s the mechanism that determines whether a business can fund its own operations or has to borrow to keep running.
Presenting Benchmarks Without Overselling Them
Show quartiles and a sensitivity range, not a single point estimate. Clients trust a benchmark more when you document the data vintage and cohort filters you used, and less when the number arrives without context for how it was built.
— Danny
Get Granular Benchmarks Instead of Broad Sector Averages
Public datasets like Damodaran’s tables are excellent for a first pass, but they stop at the sector level. When a client needs a working-capital benchmark for a specific NAICS code, revenue band, and geography, Bizminer fills that gap with over 9,000 industry and market segments, customizable to the exact cohort an analyst is working with.

Reports export cleanly for client deliverables, and the underlying data has held up in front of government agencies and U.S. Tax Court reviewers, a level of scrutiny most benchmark sources never face. If you’re building a client-ready working-capital analysis this quarter, start with Bizminer’s market and industry research tool and pull the NAICS cohort that actually matches your target company, not the closest broad-sector proxy.
Sources
- Working Capital Ratios by Sector (US) — Aswath Damodaran (NYU)
- J.P. Morgan Working Capital Index
- 6.3 Liquidity Ratios — Principles of Finance 2e (OpenStax)
This article is general information, not a substitute for advice from a qualified financial advisor. Consult a qualified financial professional about your own circumstances before acting on anything here.