Common size analysis turns every line of a financial statement into a percentage of one base figure, so you can compare a company with its own past or with businesses of any size. On an income statement the base is net sales. On a balance sheet it is total assets. Divide each line by the base, multiply by 100, and the dollar scale drops out.
This guide shows the formulas, a worked example with both statements, how to interpret the output, how it differs from comparative (horizontal) analysis, and where it stops being enough.
TL;DR
- Common size analysis (also called vertical analysis) expresses each line item as a percentage of a base: net sales for the income statement, total assets for the balance sheet.
- The formula is (line item ÷ base amount) × 100.
- It removes size from the comparison, so a $2 million firm and a $200 million firm can be read side by side.
- Comparative analysis tracks dollar or percent change across periods. Common size shows structure within each period. Strong reviews use both.
- The percentages only mean something against a relevant peer group, so pair them with industry benchmarks of similar size.
Table of Contents
- What common size analysis shows
- The formula and the right base
- Worked example: common size income statement
- Worked example: common size balance sheet
- Step by step: how to run the analysis
- Common size vs. comparative analysis
- Comparing companies of different sizes
- Limitations to keep in mind
- Our perspective
- Get benchmarks to read your percentages against
- FAQ
- Sources
What common size analysis shows
Common-size analysis expresses financial data, including entire statements, in relation to a single base item. A common-size statement is the result: the same statement, restated so that every number is a share of that base.
The method is also known as vertical analysis, because it evaluates each line item as a percentage of a base amount for that period. Some textbooks go further and describe common-size statements as statements that show percentages and no absolute dollar amounts.
Why bother? Raw dollars hide structure. Knowing that cost of goods sold rose by $464,000 tells you little. Knowing it moved from 60% to 64% of sales tells you margin is being squeezed. Common-size work also makes trends and changes easier to spot than raw numbers do.
The formula and the right base
The calculation is the same for every line:
Common-size % = (line item amount ÷ base amount) × 100
The choice of base depends on the statement:
| Statement | Usual base | Base equals |
|---|---|---|
| Income statement | Net sales (revenue) | 100% |
| Balance sheet | Total assets | 100% |
| Balance sheet, liabilities side | Total assets, which equals total liabilities plus equity | 100% |
| Cash flow statement | Net sales or total cash from operations, depending on the question | 100% |
A common-size income statement is built by restating each line as a percentage of net sales. For the balance sheet, a vertical common-size version divides each item by the same period’s total assets. Some analysts use total liabilities as the base for liability lines, which is a recognized option. Whichever base you pick, keep it identical across periods and across the companies you compare.
Worked example: common size income statement
The figures below are hypothetical, built to show the mechanics. Take a small distributor with two years of results.
| Line item | Year 1 ($) | Year 1 (% of sales) | Year 2 ($) | Year 2 (% of sales) |
|---|---|---|---|---|
| Net sales | 2,000,000 | 100% | 2,600,000 | 100% |
| Cost of goods sold | 1,200,000 | 60% | 1,664,000 | 64% |
| Gross profit | 800,000 | 40% | 936,000 | 36% |
| Operating expenses | 560,000 | 28% | 676,000 | 26% |
| Operating income | 240,000 | 12% | 260,000 | 10% |
| Interest expense | 40,000 | 2% | 52,000 | 2% |
| Pretax income | 200,000 | 10% | 208,000 | 8% |
How to read it
Sales grew 30%, and a quick look at dollars suggests a good year: operating income rose from $240,000 to $260,000. The percentages tell a different story.
- Cost of goods sold rose from 60% to 64% of sales. Gross margin fell four points. As a rule, if this percentage had held steady while sales rose, cost of goods sold would have risen in the same proportion. It did not, so the business is paying more per dollar of sales: supplier prices, discounting or product mix are the first places to look.
- Operating expenses fell from 28% to 26%. The company is getting some scale benefit on overhead, which cushioned part of the margin loss.
- Operating margin slipped from 12% to 10%. Growth is being bought at lower profitability.
- Interest stayed at 2%. Debt cost is not the cause.
This is the core use of the income statement version: you can see how much of each sales dollar goes to each type of expense and compare that over time. A company that sells advertising or digital media would run the same exercise on its revenue and cost lines, and an agency that is tracking those percentages may also want media and advertising business accounts that keep client receipts and campaign spending organized in separate lines.
Worked example: common size balance sheet
The balance sheet version shows how capital is allocated. Using the same hypothetical company at the end of Year 2:
| Line item | Amount ($) | % of total assets |
|---|---|---|
| Cash | 150,000 | 15% |
| Accounts receivable | 200,000 | 20% |
| Inventory | 250,000 | 25% |
| Property and equipment | 400,000 | 40% |
| Total assets | 1,000,000 | 100% |
| Current liabilities | 250,000 | 25% |
| Long-term debt | 300,000 | 30% |
| Owners’ equity | 450,000 | 45% |
| Total liabilities and equity | 1,000,000 | 100% |
What it says: 60% of the assets are current (cash, receivables, inventory) and 40% are fixed. Debt, current and long-term together, funds 55% of the company and equity funds 45%.
The interesting part comes when you compare periods. OpenStax gives two useful patterns: current assets can stay at 80% of total assets while the mix inside changes, and a funding structure can shift from 55% debt and 45% equity to 60% and 40%. In our example, if inventory climbed from 20% to 25% of assets while cash dropped, you would ask whether stock is building up faster than sales. If the debt share moved the way OpenStax describes, you would ask who is carrying the risk.
Step by step: how to run the analysis
- Pick the statements and periods. Use the income statement and balance sheet for the same fiscal periods. Three to five years gives a trend.
- Choose the base and stick to it. Net sales for income lines, total assets for balance sheet lines.
- Divide each line by the base and multiply by 100. A spreadsheet column beside each dollar column does this in seconds.
- Check the totals. Assets must sum to 100%, and liabilities plus equity must also sum to 100%. A miss means a typo or a missing line.
- Compare across time. Look for lines that move more than a point or two.
- Compare against peers. Line up your percentages against companies in the same industry and size band.
- Investigate the outliers. The percentages point to a question. The answer is in the notes, the ledger or the management conversation.
Common size vs. comparative analysis
This is the question people ask most after learning the formula. The two methods answer different questions.
| Common size (vertical) | Comparative (horizontal) | |
|---|---|---|
| Question answered | What is the makeup of this period? | How much did each line change? |
| Base | One line in the same period (sales or total assets) | The same line in a base year or prior period |
| Output | Each line as % of the base | Dollar change and % change |
| Best for | Cost structure, capital structure, peer comparison | Growth, momentum, trend direction |
The CFA Institute draws the same line: vertical analysis uses same-period data, while a horizontal common-size approach compares each item with its base-year quantity. In our example, a comparative view shows that cost of goods sold grew 38.7% while sales grew 30%. The common-size view shows the same problem as a four-point margin loss, and shows it in a form you can set beside a competitor’s.
Use comparative analysis to spot what is moving. Use common size to understand what the business looks like and whether that shape is normal for its industry.
Comparing companies of different sizes
The biggest advantage of the method is that it removes size as a factor, so you can compare a small firm with a larger one, with divisions inside one company, or with industry averages. OpenStax notes it supports comparison across periods, within departments, and against firms of any size and industry averages.
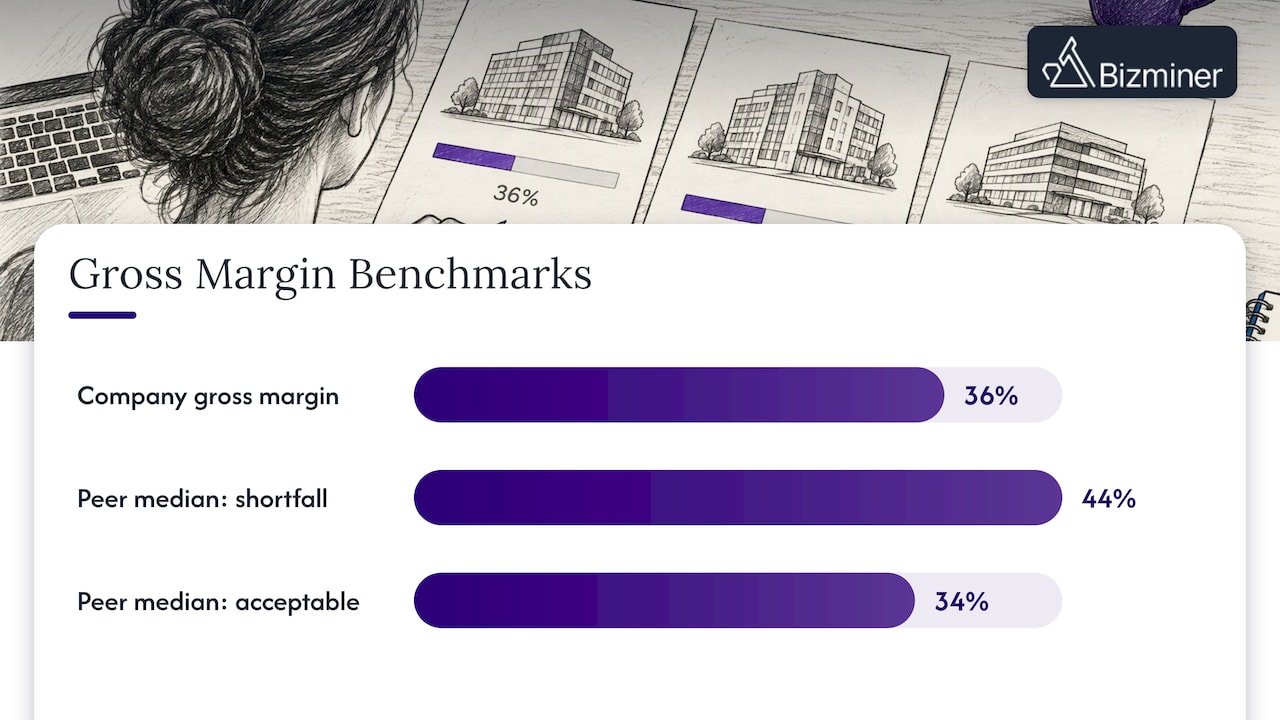
That last comparison is where most real work happens. A 36% gross margin means nothing alone. It is a problem if the peer median for similar-sized firms is 44% and perfectly fine if it is 34%. Size matters inside the peer group too, because a ten-person shop and a 500-person company in the same industry often run different cost structures. That is why we recommend choosing the right size band for industry benchmarks before you draw any conclusion.
Limitations to keep in mind
Common size analysis is a lens, and a good analyst knows what it can and cannot show:
- It is not a full conclusion. Common-size analysis on its own is unlikely to give a comprehensive answer and belongs inside a wider review of the statements. Temporary swings may not reflect lasting change.
- Small percentages can still be large dollars. A small percentage change in a large company can be a big amount. Always look at both columns.
- It ignores context. Inflation, market conditions or industry disruption sit outside the percentages.
- It is a snapshot. Vertical analysis reflects a point in time rather than a period, so read several years side by side.
- It depends on the inputs. Errors or manipulated figures distort the results, so start with statements you trust.
The practical fix is simple: add ratios and a defensible peer set. Our financial ratios glossary defines the margins, liquidity and leverage ratios that usually follow a common-size review.
Our perspective
Common size analysis is only as good as the comparison behind it. We see accountants and advisors do the arithmetic correctly and then stall on the question that matters: compared with what?
That is why we built Bizminer around granularity. Our data covers over 9,000 unique markets, segmented by industry, geography and company size, so your client’s 64% cost of goods sold can be read against businesses that actually resemble it, not a national average that blends a corner shop with a regional chain.
Our data is accepted in U.S. Tax Court and used by government agencies, and our reports are designed with larger sample sizes and detailed source lists. When a percentage has to be defended in an audit, a lending file or a valuation, the benchmark is the part that gets challenged. We think it should be the strongest part of your file.
Danny
Get benchmarks to read your percentages against
Once your client’s statements are in common-size form, the next step is the peer set. Our Industry Financial Performance report is $249 one-off per report, and our Financial Report is $349 one-off per report. Both are built to give you industry and size-banded figures to hold your percentages against. Prices are listed on our pricing page.

If you need to filter by niche, geography and business size, our granular custom analysis reports let you build the peer group first. For work that may face scrutiny, see how to apply industry comps filters that hold up, and for small-company comparisons, our company size benchmarks.
FAQ
How do you calculate a common size percentage?
Divide the line item by the base amount and multiply by 100. For an income statement the base is net sales, and for a balance sheet it is total assets. In the example above, $1,664,000 of cost of goods sold divided by $2,600,000 of sales is 64%.
What is the difference between comparative and common size analysis?
Comparative (horizontal) analysis measures how each line changed from one period to another. Common size (vertical) analysis measures each line as a share of a base within a single period. The first shows movement, the second shows structure.
What are the disadvantages of common size statements?
They are a snapshot, can hide large dollar changes behind small percentages, and ignore context such as inflation or industry disruption. They also depend on accurate source figures. Using them alongside ratios and trusted peer benchmarks addresses most of these issues.
Which base should I use for a balance sheet?
Total assets is the standard base, and total liabilities and equity equals the same figure. Some analysts use total liabilities as the base for the liability lines. Whatever you choose, apply it consistently across every period and company you compare.
Sources
- Financial Analysis Techniques, CFA Institute
- Common Size Analysis, Corporate Finance Institute
- Common-Size Financial Statements, Lumen Learning
- Mastering Common-Size Analysis, Investopedia
- 5.7 Common-Size Statements, OpenStax Principles of Finance 2e
- Vertical Analysis, Wall Street Prep
- What Is Common-Size Analysis?, Workday
- Balance Sheet Vertical Analysis, FloQast