
The best starting points for Chicago industry data are public: the Chicago Metropolitan Agency for Planning (CMAP), the Illinois Department of Employment Security (IDES), the Federal Reserve Bank of Chicago and the City of Chicago’s licensing records. They cover jobs, establishments, wages, demographics and small business credit, down to community areas and ZIP codes. They stop short of company-level financials, so lending, valuation and advisory work usually needs a second layer of benchmark data. This guide shows what each source gives you, where it runs out, and how to combine them.
TL;DR
- CMAP, IDES, the Chicago Fed and the city’s licensing tool are free, official and enough for local context: workforce, establishments, demographics and credit conditions.
- For neighborhood detail, IDES “Where Workers Work” breaks private sector employment out by Chicago neighborhoods tied to ZIP codes, using NAICS industry sectors.
- Public Chicago datasets are snapshots, often a year behind, and some rely on survey samples with wide margins of error for small communities.
- Financial ratios, margins and revenue benchmarks by industry are not in these sources. That is where a commercial benchmark platform such as Bizminer fits.
Table of Contents
- What “industry data” means for Chicago
- Free public sources worth bookmarking
- Which source answers which question
- Neighborhood and ZIP-code detail
- How current is the data, and how far can you trust it
- University libraries and commercial databases
- Our perspective: counts are not benchmarks
- Where Bizminer fits
- A working method by role
- Common mistakes with Chicago data
- FAQ
- Sources
What “industry data” means for Chicago
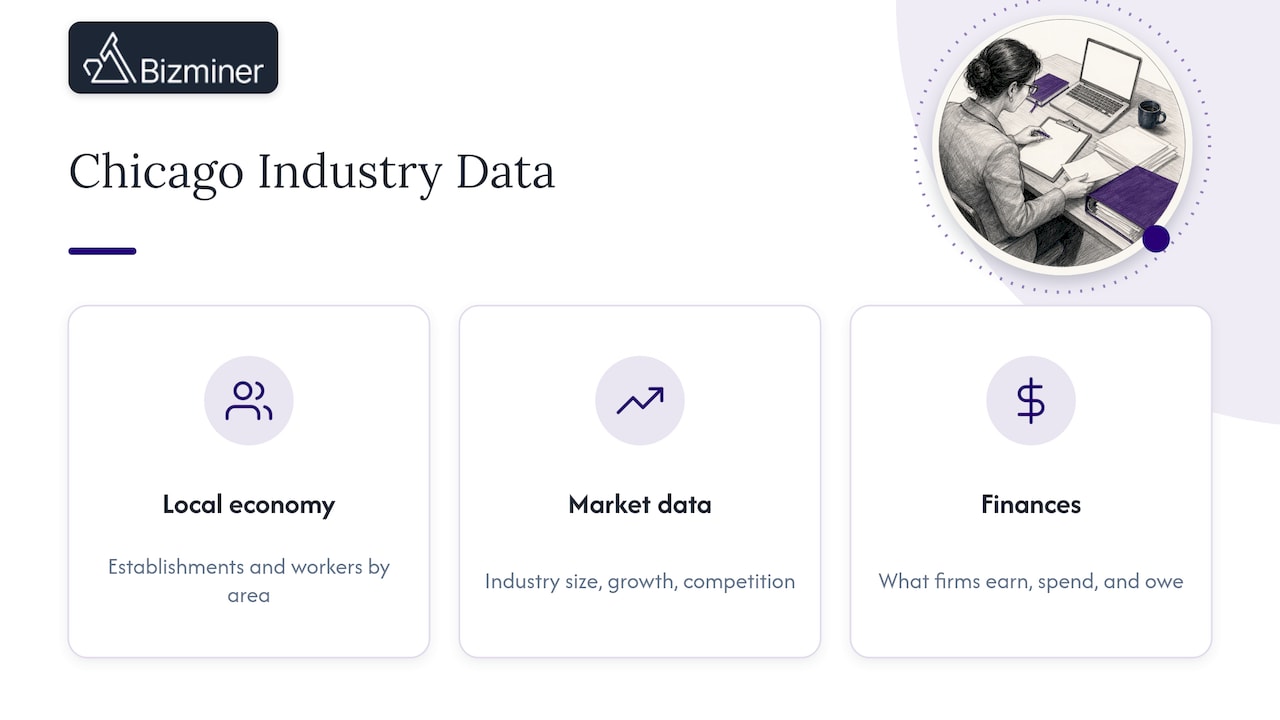
People who search this phrase want one of three things. Some want local economic context: how many establishments and workers a sector has in a county, a suburb or a neighborhood. Some want market data: size, growth and competition for an industry in the metro area. Others want financial performance: what a typical restaurant, trucking firm or dental practice earns, spends and owes.
Public agencies answer the first well, the second partly, and the third hardly at all. Knowing which question you are asking saves hours. The rest of this article follows that split, starting with the free sources and ending with where paid benchmarks earn their cost.
Free public sources worth bookmarking
CMAP: demographics, economy and land use
CMAP publishes demographic and economic data for download, and says the data and tools inform funding decisions, help communities assess local labor markets and build action plans, and support long-range transportation planning. Its Data Hub lets you search or browse by category, including demographics, economy, land use and environment.
The most useful product for geographic detail is the set of Community Data Snapshots. CMAP updates these annually for the region’s 7 counties, 284 communities and 77 Chicago community areas. If a client asks about a specific suburb or a West Side community area, this is the fastest way to a defensible population and workforce profile.
IDES: establishments, employment and wages by NAICS
The Illinois Department of Employment Security publishes the Quarterly Census of Employment and Wages. Its “Illinois at Work” report summarizes business establishments, employment levels and total wages by geographic area and NAICS industry sector each quarter.
For Chicago-specific cuts, the annual Where Workers Work report gives private sector employment totals by major NAICS sector for the six-county Chicago area, major communities and Chicago neighborhoods by ZIP code. That makes it one of the few free sources that answers a question like “how many people work in health care in this part of the city?”
Federal Reserve Bank of Chicago: local snapshots and small business credit
The Chicago Fed’s economic data page includes a Local Economic Snapshot tool. It lets you search for economic, industry and demographic data by city, county or Federal Reserve District.
For anyone in lending, the Federal Reserve’s 2025 Chartbook on Chicago Employer Firms is worth reading. It reports small business credit and employment experience for the Chicago-Naperville-Elgin metro area, based on the 2024 Small Business Credit Survey. It tells you how local firms fared when seeking financing. It does not tell you how a specific industry’s margins compare.
City of Chicago: who is licensed to operate
The Department of Business Affairs and Consumer Protection runs an interactive Business License Look-up. You can search licensed businesses by address, license type and community area. Advisors use it to check a prospect’s footprint, and economic developers use it to spot clusters of a license type in a corridor.
Which source answers which question
| Question | Best public source | Geographic detail | Limits |
|---|---|---|---|
| What does this community look like demographically? | CMAP Community Data Snapshots | 284 communities, 77 Chicago community areas | Based on American Community Survey estimates |
| How many establishments and workers are in a sector? | IDES QCEW and Where Workers Work | County, community, neighborhood by ZIP | Point-in-time records, no financials |
| How are local small firms accessing credit? | Federal Reserve chartbook | Chicago metro area | Survey-based, not industry ratios |
| Which businesses hold a city license here? | City license look-up | Address and community area | Shows licensing, not performance |
| What is the economic profile of my county or city? | Chicago Fed Local Economic Snapshot | City, county, Fed District | Broad indicators |
Neighborhood and ZIP-code detail
Neighborhood-level business data is the hardest to find, so it deserves its own section. Three routes work.
- Where Workers Work. Employment totals by NAICS sector for Chicago neighborhoods associated with ZIP codes, published annually.
- CMAP Community Data Snapshots. Profiles for each of the 77 Chicago community areas, useful when your client thinks in community areas rather than ZIP codes.
- City license look-up. A direct way to see which licensed businesses operate within a community area or at an address.
Used together, they let you say something like: this community area has this population profile, this many jobs in retail and food service, and these licensed operators. What they do not let you say is how profitable those operators are. For that you need industry financial benchmarks, covered below.
How current is the data, and how far can you trust it
Freshness and reliability are where most Chicago data projects go wrong, so read the fine print before you cite a number.
Timing. Where Workers Work is produced annually from March employment data. Its 2025 report is dated December 2025, and IDES notes that current-year data are preliminary and subject to revision. In practice, a figure you quote in late 2026 may describe March of the prior year.
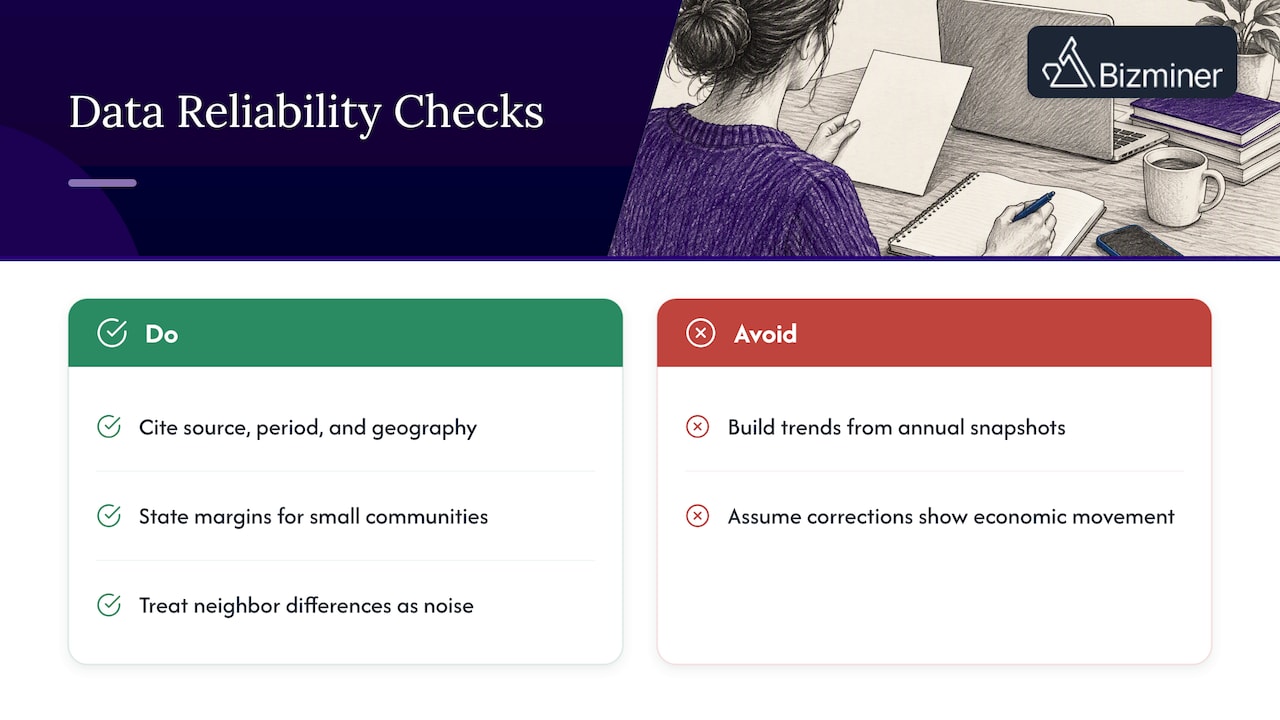
Not a time series. The same report states that it is a snapshot of establishment records at a point in time rather than a time series. IDES also explains on its QCEW page that changes over time may reflect administrative corrections rather than real economic movement. Do not build a growth trend by lining up two annual snapshots and subtracting.
Administrative records. The data come from Unemployment Insurance records in the QCEW database, so they count employers covered by that system. That is a strength for establishment counts and a limit for anything outside that system.
Survey margins. CMAP’s primary source is the most recent American Community Survey, using five-year estimates. CMAP’s snapshot documentation points users to its technical details and notes that ACS data are sample-based, with often-large margins of error for low-population communities. If you are profiling a small community, state the margin of error or treat differences between neighbors as noise.
A simple rule: cite the source, the reference period and the geography with every figure. A reviewer can then see exactly what you relied on.
University libraries and commercial databases
If you have access to a university, its business library can fill gaps. The University of Chicago’s Polsky Exchange research guide points to professional business databases for in-depth industry and company research, including commercial industry reports and company directories. Library access is usually limited to affiliates and sometimes walk-in visitors, so check each library’s policy.
Once you have pulled public files into spreadsheets, a reporting layer helps. Teams that already work in Excel often turn those downloads into live dashboards with Power BI reporting packages, so the same Chicago series refreshes without rebuilding charts each quarter.
Our perspective: counts are not benchmarks
We talk with accountants, advisors, lenders and economic developers every day, and the same gap shows up in Chicago projects. The public data tells you how many firms and workers exist. It does not tell you what a healthy firm in that industry looks like on the income statement and balance sheet.
That gap matters when someone has to defend a number. A loan officer comparing an applicant’s margins, an advisor setting a client’s targets, or a valuation analyst choosing a benchmark all need ratios segmented by industry and company size, with a sample size and a source list behind them. Our data is accepted in U.S. Tax Court and used by government agencies, and we build reports with larger sample sizes and detailed source lists because audit defensibility depends on being able to show where a figure came from.
Our practical advice is to layer the two. Use CMAP, IDES and the Chicago Fed to establish the local market: who is here, how many, and how credit is flowing. Then use industry benchmarks to judge performance within that market. If you skip the first layer, your benchmarks lack local context. If you skip the second, your local picture has no financial yardstick.
One more point from experience: pick the narrowest industry definition that still has a credible sample. A broad sector average hides the differences between, say, a bakery and a macaroni manufacturer, and a reviewer will notice.
— Danny
Where Bizminer fits
Bizminer covers more than 9,000 markets segmented by industry, geography and company size, with financial benchmarks, market reports, company-level reports and prospect lists. Our market and industry research pages show the depth available for a given NAICS code, and the custom report builder lets you filter by niche segment, geography and business size.
One-off reports are published at these prices on our pricing page:
- Industry Financial Performance, Industry Market and Company Profile: $249 per report.
- Financial Report, Market Report, Valuation Report and Company Report: $349 per report.
- Prospect lists: $0.65, $0.60 or $0.55 per record across Tiers 1 to 3.
Subscriptions and custom API feeds are available, but their prices are not published, so see the pricing page for details.
A working method by role
Accountants and valuation analysts
Start with the industry and size band that matches the client. Pull the benchmark with its sample size and source list, then use IDES data to confirm the local industry exists at scale and CMAP data to describe the community. In disputes, the documentation trail matters as much as the number.
Lenders
Use the Federal Reserve’s Chicago chartbook for the credit environment among local small firms, then compare an applicant’s ratios with industry norms for its size. The first tells you about conditions, the second about the borrower.
Business advisors and small business development centers
Use the license look-up to see who operates in a corridor, Where Workers Work for sector employment by ZIP code, and benchmarks to set realistic revenue and margin targets. Our prospecting tools for advisors and prospect list builder are there when the work turns to finding clients.
Economic developers, non-profits and academic users
CMAP’s snapshots and Data Hub carry most of the load for local development strategy. Benchmarks help you judge whether a target industry is financially viable before you recruit it. For wage questions, see how we turn BLS wage averages into benchmarks.
Common mistakes with Chicago data
- Mixing geographies. The six-county Chicago area, the seven-county CMAP region and the Chicago-Naperville-Elgin metro area are different footprints. Check the boundary before comparing figures.
- Treating snapshots as trends. Annual establishment snapshots can shift because of record corrections.
- Ignoring margins of error. ACS estimates for small communities can swing widely.
- Using a broad NAICS sector. The more general the code, the less the benchmark describes your client.
- Skipping the citation. Always record source, date and geography.
FAQ
Where can I find free industry data for Chicago?
Start with CMAP’s Data Hub and Community Data Snapshots for demographics and economy, and IDES for establishments, employment and wages by NAICS sector. The Chicago Fed’s Local Economic Snapshot adds city and county indicators. All are official and free to use.
Is there ZIP-code-level business data for Chicago?
Yes, in part. The IDES Where Workers Work report gives private sector employment by major NAICS sector for Chicago neighborhoods associated with ZIP codes. The city’s license look-up adds licensed businesses by address and community area.
How often is Chicago industry data updated?
It depends on the source. CMAP updates its Community Data Snapshots annually, IDES publishes QCEW summaries quarterly, and Where Workers Work is annual, based on March data. Current-year figures are often preliminary and subject to revision.
Can public data replace paid industry benchmarks?
Not for financial analysis. Public sources describe employment, establishments and demographics, but they do not give industry margins, ratios or revenue benchmarks by company size. Lenders, valuation analysts and advisors usually pair public data with a benchmark source.
Sources
- CMAP: Demographic & Economic Data
- CMAP Data Hub
- CMAP: Community Data Snapshots
- IDES: Quarterly Census of Employment & Wages
- IDES: Where Workers Work
- IDES: Where Workers Work 2025 report
- Federal Reserve Bank of Chicago: Economic Data
- 2025 Chartbook on Chicago Employer Firms
- City of Chicago Business Licensing
- UChicago Library: Business Research Resources