A custom benchmarking report compares one company’s financials against a peer group you define yourself: by industry code, geography and size. A generic industry average does none of that. The report is only as good as three choices: the business question, the peer group and the source of the data. This guide walks through each choice, shows what to put on the page, and explains when a tailored report is worth paying for.
TL;DR
- A custom benchmarking report lets you set the peer group (industry, region, revenue band) instead of accepting a one-size-fits-all average.
- Start with the business question, pick a handful of metrics that answer it, and record the sample size and source of every figure.
- The most common failures are unnormalized comparisons and peer groups chosen to flatter the subject.
- If the report may be challenged by a lender, an auditor or a court, the data source and method matter as much as the numbers.
- Bizminer offers single reports at $249 or $349 each, plus a subscription and API feeds, across more than 9,000 markets.
Table of Contents
- What makes a benchmarking report “custom”
- Start with the business question
- Choose a peer group you can defend
- Normalize before you compare
- What goes into the report
- Who uses custom benchmarking reports, and for what
- Where the data comes from, and why it matters
- A worked example
- Perspective: what we see in customer reports
- Build it yourself or buy a report
- Custom reports with Bizminer
- Common mistakes to avoid
- FAQ
- Sources
What makes a benchmarking report “custom”
A standard benchmark gives you one number per ratio for a broad sector. A custom report changes three things.
- The peer group. You choose the industry at a detailed level, the geography and the company size band, so the comparison set resembles the subject.
- The metrics. You select the ratios that answer your question rather than reading a 50-line table.
- The presentation. You decide what the reader sees first, and how the findings tie back to a decision.
Practitioners describe the trap well: many organizations are data-rich but insight-poor, and a government benchmarking study stresses focusing on the right data for specific performance questions instead of piling up tangential information. Customization is the tool for that. It is not a license to add more columns.
Start with the business question
Before opening any data source, write the question in one sentence. Examples:
- Is this restaurant’s prime cost out of line with similar restaurants in its region?
- Does a loan applicant’s debt service coverage look typical for firms of its size?
- What is a defensible margin range for a valuation of a small dental practice?
- Which local industries are growing enough to justify a development grant?
The question decides everything downstream. A lender cares about liquidity, leverage and coverage. A business advisor looking for growth levers cares about gross margin, labor cost and sales per employee. A nonprofit mapping local development cares about how many firms exist, how big they are and how they are growing.
The most useful structure for the finished report follows the same logic: state the question, summarize the findings, show the most important comparisons, and end with the recommended action. Lead with the answer. Put methodology and caveats in a section the reader can check, not in the way.
Choose a peer group you can defend
The peer group is where a custom report succeeds or fails. Too broad, and the subject is compared with companies that do not resemble it. Too narrow, and the sample is so small that one outlier moves the result.
Use this order:
- Industry. Start with the six-digit NAICS code that matches what the company actually sells. If the company straddles two codes, benchmark against both and say so. Our guide to NAICS benchmarks explains how to match a business to a code.
- Size. Filter by revenue band or employee count. A $400,000 firm and a $40 million firm in the same code have different cost structures.
- Geography. Use a state or metro area when local wages, rents or demand drive the result. Use national data when the industry is not local.
- Sample size. Record how many companies sit behind each figure. Treat small cohorts as directional rather than precise.
Avoid the favorable report card
Practitioners warn that benchmarking is often used to validate what an organization already believes: reference groups and filters get chosen to produce a flattering result rather than to find real gaps. The same research notes that stakeholders reject findings they perceive as filtered, however rigorous the math.
The fix is procedural. Decide on the filters before looking at the subject’s numbers. Write them down. If you later widen or narrow the group, record why. A reader who sees the criteria first will trust the conclusion.
Normalize before you compare
Benchmarking is not a simple apples-to-apples exercise. An MIT research paper on benchmarking best practices advises against assuming that organizations can be compared directly. A highly automated operation and a labor-heavy one can both be efficient, and still look very different on a single ratio.
Three habits help:
- Use a family of measures. One metric rarely tells the truth. Pair gross margin with operating margin, and revenue per employee with payroll as a share of revenue.
- Convert to per-unit figures (per employee, per location, per dollar of revenue) when business models differ inside the peer group.
- Read the distribution. Compare the subject with the median and the quartiles, not only the average. A company at the 70th percentile on cost is in a very different place from one at the 20th, even if both sit “above average.”
The goal, as the AICPA guidance on benchmarking tools frames it, is a strategic tool for measuring and improving effectiveness. A gap only matters once you understand what drives it.
What goes into the report
A clean custom benchmarking report has seven parts. For a three-to-six-page deliverable, this is a reasonable skeleton.
| Section | What it contains | Why it matters |
|---|---|---|
| Question and scope | One sentence on the decision the report supports | Keeps the reader focused |
| Peer group definition | NAICS code, size band, geography, sample size | Makes the comparison checkable |
| Headline findings | The two or three biggest gaps or strengths | Gives busy readers the answer |
| Metric comparison | Subject vs. median and quartiles for 8 to 12 ratios | Shows the evidence |
| Drivers | Likely reasons behind each gap | Turns numbers into insight |
| Actions | Prioritized next steps with an owner | Makes the report useful |
| Sources and method | Where the data came from, dates, caveats | Supports defensibility |
The drivers section is the one most often skipped. Research on benchmarking practice argues that the point of analyzing the data is to identify gaps, understand the reasons behind them, and prioritize what to act on. A table of ratios with no explanation is a data dump.
For examples of how these sections look in practice, see our benchmarking report examples.
Who uses custom benchmarking reports, and for what
Accountants and advisors
Accounting firms use tailored benchmarks to turn a routine financial statement review into advice. Showing a client that its payroll ratio sits well above peers of the same size is a conversation starter that a bare set of statements is not. Our pages on adding same-day market benchmarks to custom financial reports and ways accountants can use financial benchmarking to drive revenue go deeper on that workflow.
Lenders
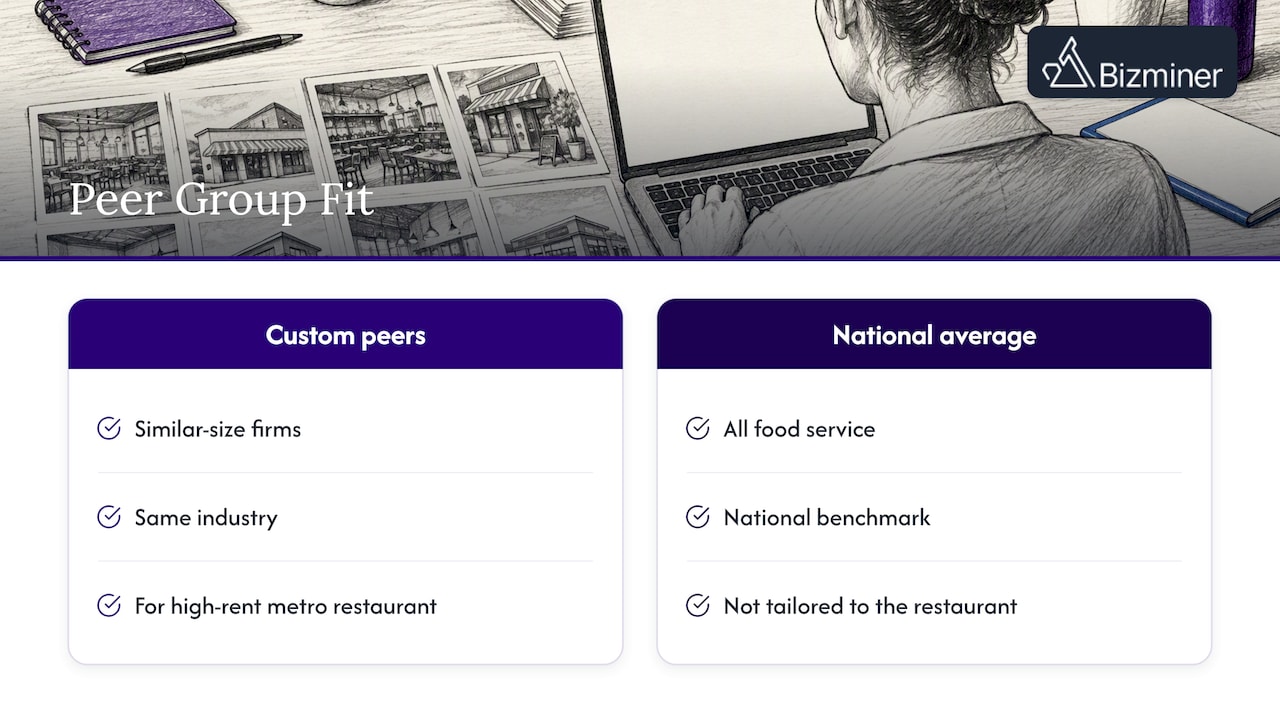
Credit analysts compare an applicant’s ratios with firms of similar size in the same industry. A custom peer group cuts the noise: a restaurant in a high-rent metro should not be judged against the national average for all food service. The sample size is part of the credit file, so it belongs in the report.
Valuation and tax work
When a report supports a valuation, a compensation study or a tax position, someone may challenge it. The IRS’s job aid on reasonable compensation says courts favor a market approach, and that such an approach relies on industry surveys and comparable data. It also notes that this data needs an expert to explain it before a court gives it significant weight.
That tracks with the rules of evidence. Federal Rule of Evidence 702 requires expert testimony to rest on sufficient facts, reliable principles and methods applied reliably. Rule 703 allows experts to rely on data of a type reasonably relied upon in their field. In practice: disclose the source, the sample and the method, so your expert can explain them. If a dispute is likely, ask your attorney or valuation specialist what the particular forum expects.
Small business support and economic development
The SBA says its network of more than 900 Small Business Development Centers offers no- or low-cost help with business planning, financial analysis and market research. Advisors in that network, along with nonprofits and local development groups, often need local, industry-level comparisons to show a client how a plan stacks up. Our local market analysis guide covers that use.
Academic programs
Finance and entrepreneurship instructors use real industry data so students practice on realistic peer groups rather than textbook averages. Academic licenses exist for that purpose.
Where the data comes from, and why it matters
There are four broad types of source for benchmark data:
- Free public summaries. Fine for a first-pass check, but typically broad and rarely filterable.
- Lender-oriented statement studies. Strong for credit work, with a defined industry and size structure.
- Association or trade surveys. Deep on one sector, but often limited to members and not always comparable across industries.
- Granular commercial databases. Built to be filtered by industry, geography and size.
Our page on where to find reliable industry ratio sources compares these types in more detail. The question to ask of any source is the same: can I see the sample size, the date and the method? Bizminer publishes a description of where its data comes from, built from public sources turned into usable information through a proprietary process.
A worked example
Suppose an advisor is preparing a client, a regional HVAC contractor with about $3 million in revenue, for a bank meeting. The advisor follows these steps.
- Write the question. Do the contractor’s margins and leverage look reasonable for a firm of its size in its state?
- Define the peer group. Pull the matching NAICS code, a revenue band around the client’s size, and the client’s state. Note the sample size.
- Select metrics. Gross margin, operating margin, current ratio, debt to equity, and sales per employee. That is a family of five, not one.
- Compare to the distribution. The client’s gross margin is near the median, but its operating margin sits in the bottom quartile.
- Find the driver. Payroll as a share of revenue explains most of the difference.
- Recommend. Review crew scheduling and overtime before the meeting, and have an explanation ready for the lender.
The numbers here are illustrative, but the sequence is how a report earns its fee: it ends with something the client can do.
Perspective: what we see in customer reports
We built Bizminer around one conviction: granularity is the product. A national average for all retail tells you almost nothing about a specialty bicycle shop in a mid-sized city. The reports that help our customers most filter down to niche segments, a region and a business size, and they show the sample behind each figure.
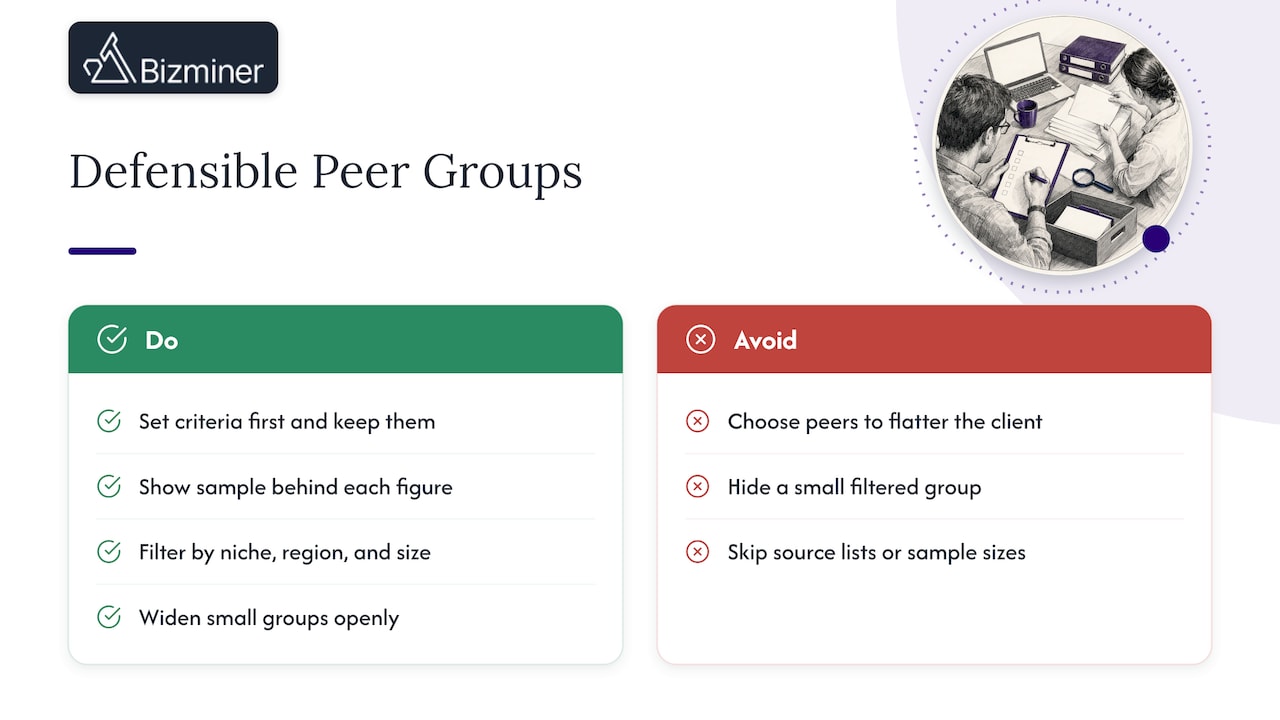
We also see how benchmarks get misused. The temptation to choose a peer group that makes the client look good is real, and it backfires the moment a lender or reviewer asks why that group was chosen. Our advice is to set the criteria first and keep them. If the filtered group is too small, say so and widen it openly.
Finally, our data is accepted in U.S. Tax Court and used by government agencies. That is why we push so hard on source lists and sample sizes in every report: when the work has to be defended, the paper trail is the point.
— Danny
Build it yourself or buy a report
You can assemble a custom benchmark from free public tables and a spreadsheet. It works for a one-off, low-stakes comparison, and it costs time. The tradeoffs show up when you need many clients, narrow segments or a defensible source trail.
| Factor | DIY from public tables | Purchased custom report |
|---|---|---|
| Industry detail | Often limited to broad sectors | Detailed NAICS-level segments |
| Size and geography filters | Rarely both | Combined filters |
| Sample size disclosure | Varies | Included |
| Time per report | Hours | Minutes |
| Defensibility | Depends on your documentation | Source lists included |
If you benchmark several clients a month, software pays for itself in time. Our overview of what financial benchmarking software does and the benefits of financial benchmarking software lay out the case. For a primer on the discipline itself, see what financial benchmarking is.
Custom reports with Bizminer
Bizminer covers more than 9,000 markets, segmented by industry, geography and company size. You can buy individual reports without a subscription:
- Industry Financial Performance, Industry Market and Company Profile: $249 per report
- Financial Report, Market Report, Valuation Report and Company Report: $349 per report
- Prospect lists: $0.65, $0.60 or $0.55 per record, depending on tier
The subscription and the customizable API feed do not have published prices. If you work with multiple clients, they are the options to look at. See current pricing, or explore how our granular analysis reports are built.
Common mistakes to avoid
- Benchmarking once and filing it. Performance changes. Rerun the comparison each year, or each quarter for fast-moving businesses.
- Using one metric. A single ratio hides trade-offs. Use a family of measures.
- Ignoring sample size. A beautiful chart built on twelve companies is a hint, not a finding.
- Skipping the drivers. Without the why, there is no action.
- Hiding the method. Reviewers trust what they can check.
- Comparing across mismatched models. Normalize first.
For trend context to pair with the comparison, our market trend analysis guide is a good next step, and the industry financial benchmarks playbook and small business benchmarks guide cover the ratios themselves.
FAQ
What is a custom benchmarking report?
It is a comparison of a company’s financial or operating results against a peer group you define, usually by industry code, size and location. Unlike a standard industry average, you control the filters. That makes the comparison more relevant, as long as you document the choices.
How big should the peer group sample be?
There is no universal threshold, but larger is more reliable, and small cohorts should be treated as directional. Always record how many companies sit behind each figure. If a narrow filter leaves too few firms, widen it and state that you did.
How often should I update a benchmarking report?
Benchmarking should not be a one-off task. Rerun it at least annually, and sooner when your client’s business changes or the market shifts. Comparing year over year also shows whether a gap is closing.
Can a benchmarking report be used in a tax or valuation dispute?
It can support the work, but the data must be explained by a qualified expert, and the rules of evidence require reliable data and methods. Choose a source that discloses its method and sample, and consult your attorney or valuation professional about what your forum requires.
Sources
- IRS Reasonable Compensation Job Aid for Valuation Professionals
- Federal Rule of Evidence 702
- Federal Rule of Evidence 703
- SBA: Small Business Development Centers
- Serving the American Public: Best Practices in Performance Measurement
- Tools and Techniques for Effective Benchmarking Studies, AICPA guidance
- Where does Bizminer get its data?