
For current Los Angeles industry data, go straight to five sources: the Los Angeles County Economic Development Corporation (LAEDC) for cluster forecasts, the Bureau of Labor Statistics for CEW and LAUS series, EDD for wage tables, FRED for downloadable time series, and Census/DataUSA for demographic cross tabs. The 2026 signal: employment growth has moderated after 2025 disruptions, with gains concentrated in healthcare, aerospace pockets, and trade throughput rather than spread broadly. Pull the CEW and LAUS series first, then order a custom Bizminer benchmark for anything county data cannot break down by NAICS code or size band.
TL;DR:
- Employment growth in Los Angeles is expected to be moderate in 2026, with sectors like healthcare and aerospace leading the recovery, while trade employment remains flat due to automation and consolidation.
- Key industries such as aerospace, biosciences, entertainment, healthcare, and trade dominate the regional economy, but their growth patterns vary significantly in output and employment.
- Data accuracy requires careful handling of NAICS revisions, seasonality, and separating jobs from people, with benchmarks tailored to industry specifics for precise analysis.
- Long-term shifts show a decline in manufacturing and aerospace jobs, with trade and logistics expanding in output but not in employment due to technological changes.
- Decision-makers should focus on granular industry benchmarks and analyze sector-specific demographic, wage, and policy trends to identify sustainable growth opportunities.
Table of Contents
- Snapshot: Top Clusters and the Current Employment Picture in Los Angeles County
- What Short-Term Trends Should Analysts Factor Into 2026 Forecasts?
- How Do You Access and Harmonize LA Industry Datasets?
- Location Quotients, Benchmarking, and When to Go Beyond Public Data
- How Has the Los Angeles Industry Base Changed Over Time?
- How Does LA Compare to California and National Industry Benchmarks?
- Which Demographic Factors Shape LA’s Industry Labor Markets?
- What Do Wage and Income Patterns Look Like Across Sectors?
- How Do Infrastructure Projects and Policy Shifts Affect LA Industries?
- How Should Analysts Forecast LA Industry Growth Beyond 2026?
- What Should Decision-Makers Prioritize When Reading This Data?
- Get Granular Los Angeles Industry Benchmarks Built for Your Use Case
- Sources
Snapshot: Top Clusters and the Current Employment Picture in Los Angeles County
Los Angeles County’s economy runs on a handful of clusters that punch well above their headcount in output and influence. The LAEDC’s industry clusters framework identifies five that dominate regional planning conversations:
- Aerospace, Defense & Space: concentrated in El Segundo and the Antelope Valley, with specialized subsegments attracting fresh capital even as broader manufacturing employment declines.
- Biosciences: a smaller but fast-growing cluster tied to research institutions and a deepening base of clinical and lab-support jobs.
- Entertainment: film and television production, still the county’s signature industry, though permit activity has been uneven since 2025.
- Healthcare & Social Assistance: the single largest source of net new jobs in the region over the past two years.
- Trade & Logistics: anchored by the ports, which together move roughly 40% of all U.S. containerized waterborne cargo, according to LAEDC.
That last point deserves a second look, because it contains the county’s most counterintuitive labor trend right now. Port throughput keeps climbing, but logistics employment isn’t climbing with it. Automation, larger vessel calls, and warehouse consolidation mean more cargo moves through fewer payroll hours. Healthcare, by contrast, is adding jobs at a rate almost no other sector matches, driven by an aging population and continued expansion of outpatient and long-term care capacity. If you’re building a 2026 employment model for Los Angeles, treat “growth” and “output” as two different questions. Trade is growing in dollars. Healthcare is growing in bodies. Aerospace is growing in neither uniformly, but in tight, high-value pockets that a countywide average will hide.
What Short-Term Trends Should Analysts Factor Into 2026 Forecasts?
The county’s 2025 was rough by several measures, and the effects are still working through the data. Trade volatility, supply chain strain, and environmental events all left marks on employment series that a surface read would miss.
LAEDC’s 2026 forecast describes continued but moderated employment growth entering 2026, following those 2025 disruptions. That word, moderated, is doing real work. It means the recovery is real but slower than a simple trend line from 2023 would predict, and analysts extrapolating pre-2025 growth rates into their 2026 models will overshoot.
Two structural constraints sit underneath that moderation. Housing affordability keeps squeezing where workers can afford to live relative to where the jobs are, lengthening commutes and shrinking the effective labor pool for lower-wage clusters like logistics and hospitality. Workforce mobility, tied to that same housing pressure, shows up in project timelines that stretch longer than they used to, particularly in construction and healthcare facility expansion.
Sector-specific notes worth tracking through 2026: film permit activity has stabilized rather than rebounded sharply, port throughput keeps rising while logistics payroll keeps shrinking, and aerospace and defense investment stays concentrated in specific hubs rather than spreading countywide. None of these are noise. They’re the shape of the recovery, and any forecast that treats them as temporary blips will miss the structural story underneath.
How Do You Access and Harmonize LA Industry Datasets?
Getting clean, comparable Los Angeles data takes more than downloading a spreadsheet. NAICS codes get revised, geographic boundaries shift, and payroll counts get confused with labor force counts more often than anyone likes to admit.
- Pull CEW and LAUS first. Both are available as CSV downloads or through BLS’s API, and together they give you employment by industry and unemployment by geography, the two anchor series for almost any LA analysis.
- Check your NAICS vintage. The Census Bureau updates NAICS periodically, and a series built on 2017 codes won’t map cleanly onto 2022 definitions without a crosswalk. Document which vintage you’re using before you merge anything.
- Separate jobs from people. CEW counts jobs by employer payroll; LAUS counts people in the labor force. A worker with two part-time jobs shows up once in LAUS and twice in CEW, which matters if you’re computing per-capita anything.
- Handle seasonality and revisions deliberately. Decide upfront whether you want seasonally adjusted or raw series, and note that BLS revises recent months as more employer reports come in.
- Normalize and compute your trend metrics. Once your base series are clean, calculate location quotients and rolling growth rates rather than comparing raw counts across time periods with different baselines.
Pro Tip: Keep a one-page data dictionary for every LA dataset you build, listing the source, vintage, and whether it counts jobs or people. Six months later, you’ll thank yourself.
Location Quotients, Benchmarking, and When to Go Beyond Public Data
Location quotient math is simple enough to run in a spreadsheet, and it answers a question raw employment counts can’t: is this industry actually concentrated here, or just large because the county itself is large? BLS’s own methodology divides a local industry’s employment share by its national share. An LQ above 1.1 signals real regional specialization worth flagging in a report; anything close to 1.0 just means LA looks like the country as a whole.
Benchmarking gets harder once you move past a single ratio. Peer selection matters, size bands matter, and normalizing by establishment count versus payroll dollars can flip a conclusion entirely.
- Compare against peer counties of similar population and industry mix, not just the state or national average.
- Segment by size band; a five-person shop and a 500-person plant in the same NAICS code tell different stories.
- Decide once, and document, whether you’re normalizing by establishments, employment, or revenue.
Public series stop being enough once a client, lender, or court needs benchmarks broken out by NAICS code, ZIP code, and size band simultaneously. That’s the gap Bizminer’s custom industry benchmarks are built to close.
Public data tells you what happened at the county level. A custom benchmark tells you what happened to businesses that actually look like your client’s.
How Has the Los Angeles Industry Base Changed Over Time?
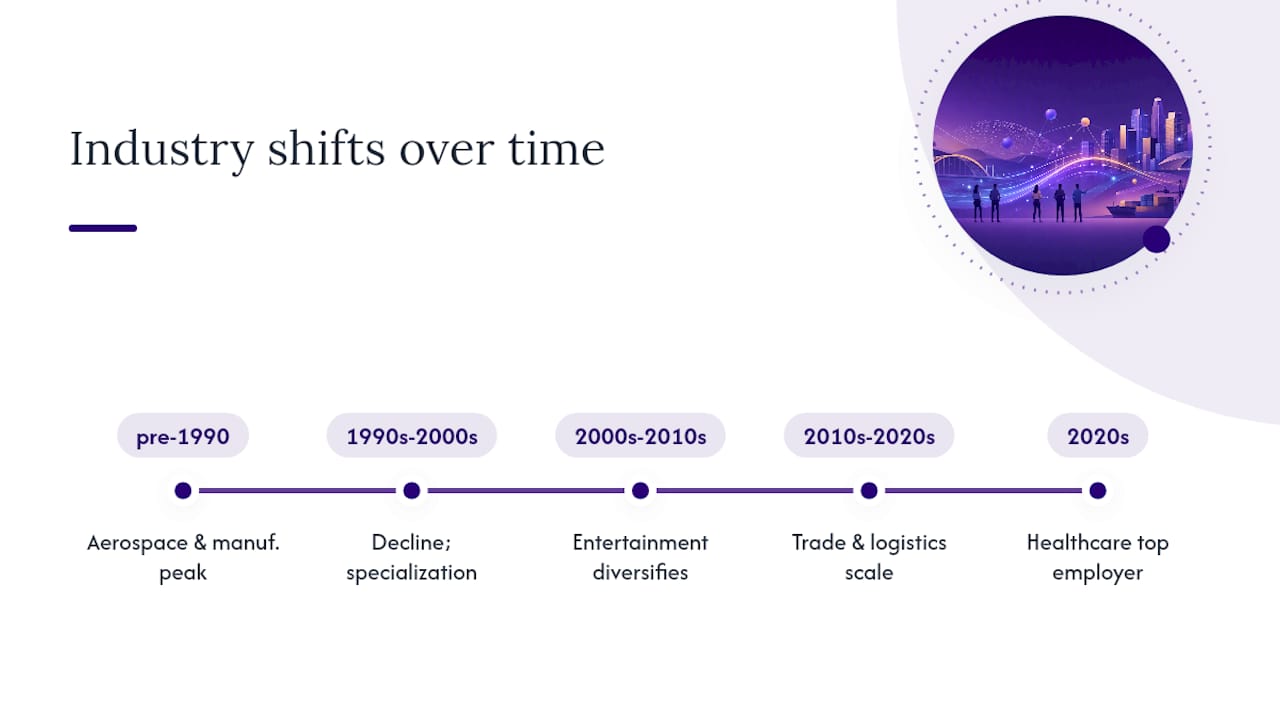
Los Angeles built its modern economy on manufacturing, aerospace defense contracts, and entertainment, and the last three decades reshaped all three. Aerospace employment peaked decades ago and never returned to those levels, even as the specialized, high-value end of the sector, think satellite components and defense electronics, kept attracting capital in hubs like El Segundo.
Manufacturing broadly followed a similar arc: fewer total jobs, but the surviving establishments increasingly specialized and export-oriented rather than the mass-production base the county once had. Entertainment stayed dominant but diversified, adding streaming production and post-production work to a base that used to run almost entirely on traditional film and network television.
The structural shift that matters most for today’s analysts is the rise of trade and logistics as a scale-defining cluster, driven by decades of growth in containerized shipping through the ports. FRED’s county-level establishment series captures this arc cleanly, showing decades of shifting establishment counts across industries without the noise of month-to-month employment volatility. Healthcare’s rise from a supporting sector to the county’s leading job creator is more recent, tracking an aging regional population and a buildout of outpatient facilities that accelerated over roughly the past ten years. None of these shifts happened in a straight line, and any long-run model needs to account for the specific decade each turn took hold rather than assuming a steady trend.
How Does LA Compare to California and National Industry Benchmarks?
Los Angeles County rarely moves in lockstep with statewide or national numbers, and the gaps themselves are diagnostic. When county employment growth lags the state average, it usually points to LA-specific drags: housing costs pushing workers to the Inland Empire, or logistics automation offsetting port growth in ways that don’t show up in less trade-dependent counties.
The trade and logistics concentration is a genuine national outlier. No other metro area handles a comparable share of containerized cargo, which means LA’s logistics numbers should never be benchmarked against a generic national logistics average; the scale and capital intensity are structurally different.
Entertainment tells the opposite story: LA is the benchmark, and comparing it to national film and television figures is nearly meaningless since the county holds an outsized share of the industry’s total employment.
Healthcare and biosciences are where LA tracks closer to statewide and national patterns, since demographic aging and healthcare demand growth are broad trends rather than LA-specific ones. When you’re building comparisons, EDD’s state-level tables and BLS’s national series both work as sanity checks, but only for clusters where LA doesn’t already define the benchmark. For aerospace and trade, build your own regional baseline rather than importing a national one that doesn’t reflect the county’s concentration.

Which Demographic Factors Shape LA’s Industry Labor Markets?
Age, education, and ethnicity all shape which clusters can actually staff their growth plans, and Census/DataUSA cross tabs make this visible in ways raw employment counts don’t.
Healthcare’s job growth runs into an aging workforce problem from both directions: more elderly residents need care, but a meaningful share of the existing healthcare workforce is itself approaching retirement age, tightening the pipeline just as demand rises.
Education levels split cleanly by cluster. Biosciences and aerospace’s specialized subsegments draw heavily on workers with advanced degrees, concentrated in specific neighborhoods near research institutions and aerospace hubs, while trade and logistics rely on a much broader base of workers without four-year degrees, many commuting in from more affordable areas outside the county core.
Los Angeles County’s ethnic diversity also maps unevenly onto industry clusters, a pattern shaped by decades of immigration history, neighborhood formation, and industry location decisions rather than any single recent cause. Entertainment and biosciences workforces look different demographically from logistics and manufacturing workforces, and any workforce development program built without that context risks solving the wrong problem for the wrong cluster. Analysts building labor supply models should pull Census/DataUSA breakdowns before assuming a single countywide demographic profile applies evenly across clusters.
What Do Wage and Income Patterns Look Like Across Sectors?
Wage data tells a story employment counts alone can’t: which clusters are growing because they pay well, and which are growing despite paying poorly. EDD’s OEWS wage tables and BLS’s Occupational Employment Statistics both break wages down by detailed occupation, and the spread between clusters is wide.
Aerospace and biosciences occupations skew toward the higher end of the county’s wage distribution, reflecting the specialized education and certification those jobs require. Healthcare wages split sharply by role, with physicians and specialized clinicians earning well above the county median while home health aides and support staff often earn near it, a gap that matters enormously for workforce retention in a high-cost region.
Trade and logistics wages have historically lagged other major clusters on a per-job basis, even as the sector’s overall economic output has climbed. That combination, rising output paired with flat or declining employment and modest wage growth, is exactly the productivity story analysts need to flag when a client or policymaker assumes cargo volume translates directly into local income growth. It often doesn’t.
When you’re building a wage-based competitiveness case for a cluster, pull occupation-level detail rather than an industry average; a single NAICS code can span occupations with wildly different pay, and averaging them hides the actual labor market signal.
How Do Infrastructure Projects and Policy Shifts Affect LA Industries?
Major infrastructure investment and policy decisions ripple through the county’s industry mix in ways that show up in the data years after the initial announcement. Port modernization projects, aimed at handling larger vessels and moving cargo faster, are a direct driver behind the throughput growth showing up in trade data even as logistics employment declines. The efficiency gains are the point, but they mean job creation from port investment increasingly shows up in construction and technology roles during the build phase, not in permanent logistics headcount afterward.
Housing policy shifts factor in more indirectly but just as powerfully. Permit activity increases documented in regional forecasts through 2026 matter for industry data because they shape whether workers in lower-wage clusters can afford to live near their jobs, which in turn affects labor supply for logistics, retail, and hospitality employers across the county.
Defense spending and federal contracting decisions have an outsized effect on the aerospace cluster specifically, given its concentration around a handful of major contractors and their supply chains. A single contract award or cancellation can move employment numbers in El Segundo or the Antelope Valley in ways that wouldn’t register as a blip in a countywide average. Analysts tracking aerospace should watch federal contracting announcements alongside employment data, since the lag between an award and its employment effect often runs a year or more.
How Should Analysts Forecast LA Industry Growth Beyond 2026?
Forecasting Los Angeles industry growth past 2026 means combining trend extrapolation from clean historical series with judgment about which structural shifts are temporary and which are permanent. FRED’s long-run establishment data provides the trend baseline; LAEDC’s forecast work adds the narrative judgment about capital investment and policy direction that a pure statistical model can’t capture on its own.
The clusters likeliest to keep growing share a common trait: they combine specialized labor with genuine capital investment, rather than relying on countywide population growth alone. Aerospace’s high-value subsegments, biosciences, and healthcare all fit that pattern. Trade and logistics will likely keep growing in output while its employment growth stays flat or negative, a decoupling forecasters should model explicitly rather than assume away.
The biggest forecasting risk isn’t picking the wrong growth rate. It’s applying one growth rate to a cluster that actually contains two very different stories, aerospace’s overall decline masking specialized-segment growth being the clearest example in the county right now. Build cluster forecasts at the subsegment level wherever your data allows it, and treat any single countywide growth number with real skepticism.
What Should Decision-Makers Prioritize When Reading This Data?
The data keeps pointing to the same tension: clusters adding jobs and clusters adding output aren’t always the same clusters. Decision-makers who chase headline growth numbers without checking workforce pipeline and housing capacity underneath them will misjudge where incentives or investment actually pay off.
Granular benchmarks matter more than countywide averages here, especially when advising a client or structuring a local incentive package. Near-term volatility from 2025’s disruptions is real, but it shouldn’t obscure which clusters have durable, long-term competitive advantages versus which are riding a temporary bounce.
— Danny
Get Granular Los Angeles Industry Benchmarks Built for Your Use Case
Public data gets you the county-wide trend. It won’t get you a benchmark broken out by NAICS code, ZIP code, and size band, which is exactly what a lender, municipal planner, or attorney usually needs. Bizminer builds custom market and industry reports across more than 9,000 markets, with the granularity to compare a specific Los Angeles aerospace subcontractor or logistics operator against real peers rather than a countywide average.

A loan underwriter evaluating a mid-size logistics operator in the ports corridor, for instance, needs peer financial ratios at the size-band level, not a countywide employment count. Bizminer’s data is designed to provide benchmarks that hold up under scrutiny rather than just look reasonable in a slide deck. If your next report needs that level of detail, start with a custom Bizminer report built around the exact NAICS codes and geography your analysis requires.
Sources
Each source covers a different slice of the picture, and picking the wrong one wastes hours reconciling numbers that were never meant to match.
- LAEDC Releases the 2026 Economic Forecast | Los Angeles County Economic Development Corporation
- Number of Private Establishments for All Industries in Los Angeles County, CA (ENU0603720510) – FRED
- Los Angeles-Long Beach-Santa Ana, CA Economy at a Glance – BLS
- Los Angeles County, California – Labor Market Information
Use LAEDC for the story, BLS and EDD for the numbers behind it, FRED for the chart, and Census/DataUSA for who the numbers actually describe.