A market data API integration delivers auditable, NAICS and geography filterable industry benchmarks, company profiles, valuation inputs, and prospect lists suitable for advisory, lending, and research workflows. It is not a stock quote feed or a crypto ticker; it is a pipeline connecting public and proprietary datasets so accountants, lenders, and researchers can defend their numbers. One provider built specifically for this scope is Bizminer.
TL;DR:
- The integration should deliver metadata alongside data, such as measurement units and reporting periods, to ensure numbers are properly defendable in client or regulatory settings.
- Public sources like Census CBP, Economic Census, ABS, and SEC filings each serve distinct roles, with SEC data covering nearly two decades of public-company filings from 2009 to 2026.
- Proper mapping of establishment and registrant data requires durable identifiers and provenance tracking to prevent misinterpretation of ratios and benchmarks.
- Building a staged, well-defined process with validation and error handling ensures the pipeline produces trustworthy data, especially when handling schema changes or API downtime.
- Pricing for public sources is free but requires investment in engineering, while commercial providers offer reports and custom APIs at tiered or per-record costs, with licensing terms critical for compliance.
Table of Contents
- What Should a Market Data API Integration Deliver?
- Which Public Data Sources Belong in Your Integration?
- How Do You Map Establishment Data to Registrant Data?
- How Do You Build a Market Data API Integration Step by Step?
- What Validation Checks Catch Bad Benchmark Data?
- Where Does This Integration Actually Get Used?
- How Do You Secure API Keys and Data in Transit?
- How Should You Handle API Errors and Downtime?
- How Do You Optimize Performance for Large Data Volumes?
- What Do Market Data APIs Cost, and How Is Licensing Structured?
- The Trade-Offs Nobody Puts in the Sales Deck
- How Bizminer Fits Into Your Data Integration Plan
- Sources
- FAQ
What Should a Market Data API Integration Deliver?
Before you write a line of code, decide what the integration needs to hand back to the people using it. Most professional use cases boil down to a short list of outputs, each tied to a specific job.
- Industry benchmarks — ratio tables (margins, turnover, liquidity) by NAICS code and geography, used to compare a client against its peer group.
- Company profiles — normalized financial statements and operating metrics for a specific business or public filer.
- Valuation inputs — comparable multiples, growth rates, and industry risk premiums that feed discounted cash flow or market approach models.
- Prospect lists — filtered rosters of businesses by size, location, and industry for business development or loan pipeline building.
- Exportable reports — CSV, Excel, or PDF outputs that plug into existing advisory templates without reformatting.
Each output needs metadata riding alongside it: the unit of measurement, the reporting period, the accounting basis (cash versus accrual), and the sample scope behind any average or ratio. Skip that metadata and you get numbers nobody can defend in front of a client, a loan committee, or a judge.
Which Public Data Sources Belong in Your Integration?
Four government sources cover most of what a serious integration needs, and each does a different job.
- County Business Patterns (CBP) returns establishment counts, employment, first-quarter and annual payroll, and legal-form data at NAICS codes from 2 to 6 digits, filterable down to state, county, MSA, ZIP, and congressional district. It is the workhorse for market sizing and prospect segmentation.
- Economic Census runs every five years and functions as the official statistical benchmark for industry revenue, establishment structure, and products and services. Treat it as the yardstick against which proprietary benchmarks should be checked.
- Annual Business Survey (ABS) adds firm-level characteristics: sales-size classes, years in business, employment-size categories, and ownership demographics. This is what turns a generic industry list into a usable prospect filter.
- SEC Financial Statement Data Sets provide as-filed numeric facts pulled from XBRL filings, covering data from 2009 through March 2026. These support public-company comparables, but the SEC itself warns the sets can contain extraction or compilation errors.
Statistic Callout: SEC Financial Statement Data Sets span filings from 2009 through March 2026, giving analysts nearly two decades of as-filed public-company numbers to build peer comparisons on, provided the filing provenance travels with every figure.
How Do You Map Establishment Data to Registrant Data?
The hardest technical problem in this whole exercise is not pulling data. It’s making sure two very different populations don’t get treated as if they’re the same thing.
Census data counts establishments: physical locations, sometimes multiple per company. SEC data counts registrants: legal entities that file with the agency, often a single parent covering hundreds of locations. Blend them carelessly and you get a benchmark ratio that looks precise and means nothing.
- Anchor every record to a durable identifier: CIK for SEC filers, LEI where available, NAICS for industry classification, and standard geographic codes for location.
- Document an internal identity layer that maps company names and subsidiaries to those identifiers, so a rebrand or acquisition doesn’t silently break your joins.
- Never present an establishment-level statistic as if it were a company financial ratio unless you’ve explicitly documented how the two populations relate.
- Attach provenance to every value: source, accession or filer ID, period end, unit, and whether the figure is reported, estimated, normalized, or missing.
The Federal Register’s final rule implementing the Financial Data Transparency Act pushes exactly this direction, favoring machine-readable schemas and the LEI as a common nonproprietary identifier across regulatory data.
Pro Tip: Build your identity-resolution layer before you build your reporting layer. Teams that reverse the order end up rebuilding half their pipeline once they discover a “company” in their prospect list is actually four SEC filers sharing a parent name.
How Do You Build a Market Data API Integration Step by Step?
A staged rollout keeps engineering effort focused and avoids the common failure mode of ingesting everything before anyone has defined what “done” looks like.
- Define the use cases first. Decide whether you’re building benchmarks, valuation inputs, prospect lists, or all three, since each pulls different fields from different sources.
- Map identifiers and taxonomies. Settle on NAICS levels, geography granularity, and entity identifiers before writing retrieval code.
- Implement authentication and retrieval. Most public APIs use key-based auth; SEC endpoints follow a RESTful JSON pattern with no guaranteed refresh cadence or SLA, so build polling logic that doesn’t assume daily updates.
- Handle pagination, rate limits, and retries. Use exponential backoff on failed calls and make retrieval idempotent so a retry doesn’t double-count a record.
- Store raw responses before transforming anything. Keep the original payload and its metadata untouched; transform into a separate analytical layer.
- Normalize units, periods, and taxonomies in that analytical layer, documenting every mapping decision.
- Validate against source documents using a small sample before anything ships to a client-facing report.
- Expose reports, exports, and monitoring alerts only after validation passes.
Pro Tip: Cache aggressively on Census and ABS endpoints, which update infrequently, but treat SEC data as freshness-sensitive and build a schema-drift alert. Filers occasionally change XBRL tags between quarters, and a silent schema change is how bad numbers slip into a client report.
What Validation Checks Catch Bad Benchmark Data?
Building the pipeline is half the job. Proving the output is trustworthy is the other half, and it’s the half most teams shortcut.
Keep every raw filing reference and API request trace, including accession numbers, so any figure in a report can be traced back to its exact source. Pull a small sample of companies or establishments and manually check reported values against original filings or Census tables. Distinguish suppressed cells from true zeros: the Census Bureau’s own guidance on handling small-cell data warns that treating a suppressed value as zero can badly distort a benchmark average.
Statistic Callout: A NBER working paper on firm-level data found that large commercial databases are not automatically nationally representative. Selection and delivery choices baked into how a database is compiled can bias results, which is why representativeness testing belongs in your QA checklist, not just your source documentation.
Where Does This Integration Actually Get Used?
The abstractions matter less than what shows up on someone’s desk Monday morning. Four scenarios cover most professional demand.
- An accountant pulls a NAICS by geography ratio table into a CSV and drops it straight into a client advisory report, comparing gross margin against the local peer group.
- A business advisor filters ABS and CBP data by sales bracket, employee count, geography, and years in business to build a prospect list for a new service line.
- An analyst blends normalized SEC statement rows with private-company benchmarks to build comparable multiples for a valuation report.
- A lender or portfolio manager sets up monitoring that flags when a borrower’s peer benchmark shifts or a prospect crosses a qualification threshold.
Each of these depends on the same underlying discipline: clean identifiers, preserved provenance, and metadata that travels with every number.
How Do You Secure API Keys and Data in Transit?
Authentication gets a key or token issued once. Security is what happens to that credential and the data behind it every day after.
Store API keys in a secrets manager, not in application code or a configuration file committed to version control. Rotate keys on a fixed schedule and immediately if a key is ever exposed in a log file or shared repository, which happens more often than teams like to admit. Scope each key to the minimum permissions it needs; a reporting service that only reads benchmark data should not hold a key that can also modify records.
Encrypt data in transit using TLS on every connection, including internal calls between your ingestion layer and your analytical layer, not just the outward-facing API calls. Encrypt sensitive data at rest, particularly anything tied to a named company or individual pulled from prospect-list filters, since that data can carry the same sensitivity as customer records even though it originates from public sources.
Separate credentials by environment. A staging key should never touch production data, and a production key should never be reused in a test script that a developer runs locally. Log access to financial data endpoints separately from general application logs, so a security review can answer “who pulled this company’s data and when” without wading through unrelated traffic.
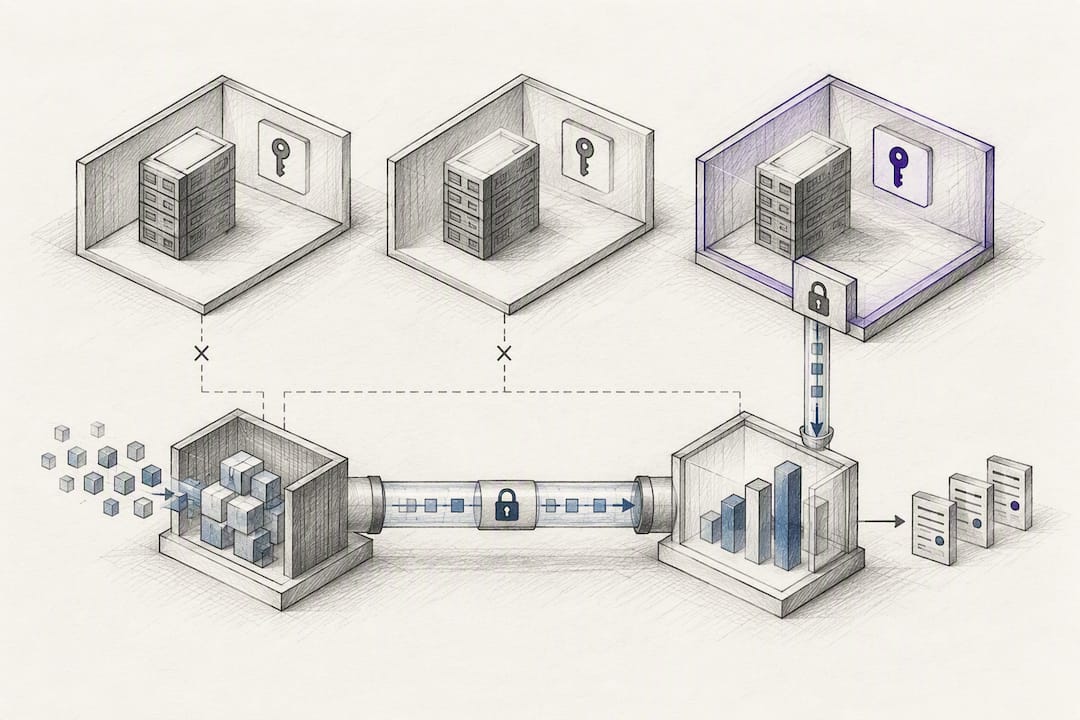
For teams handling regulated client data (loan files, tax work papers), map your key-management practice against whatever compliance framework already governs that data, whether that’s SOC 2 controls or an internal audit standard. The API integration doesn’t get a security exemption just because its source data is public. A prospect list built from public Census fields is still personally identifiable once it’s tied to a named business owner in your CRM.
How Should You Handle API Errors and Downtime?
Every one of these public APIs will fail occasionally, and a pipeline that doesn’t expect that will produce silently wrong reports instead of loud, obvious ones.
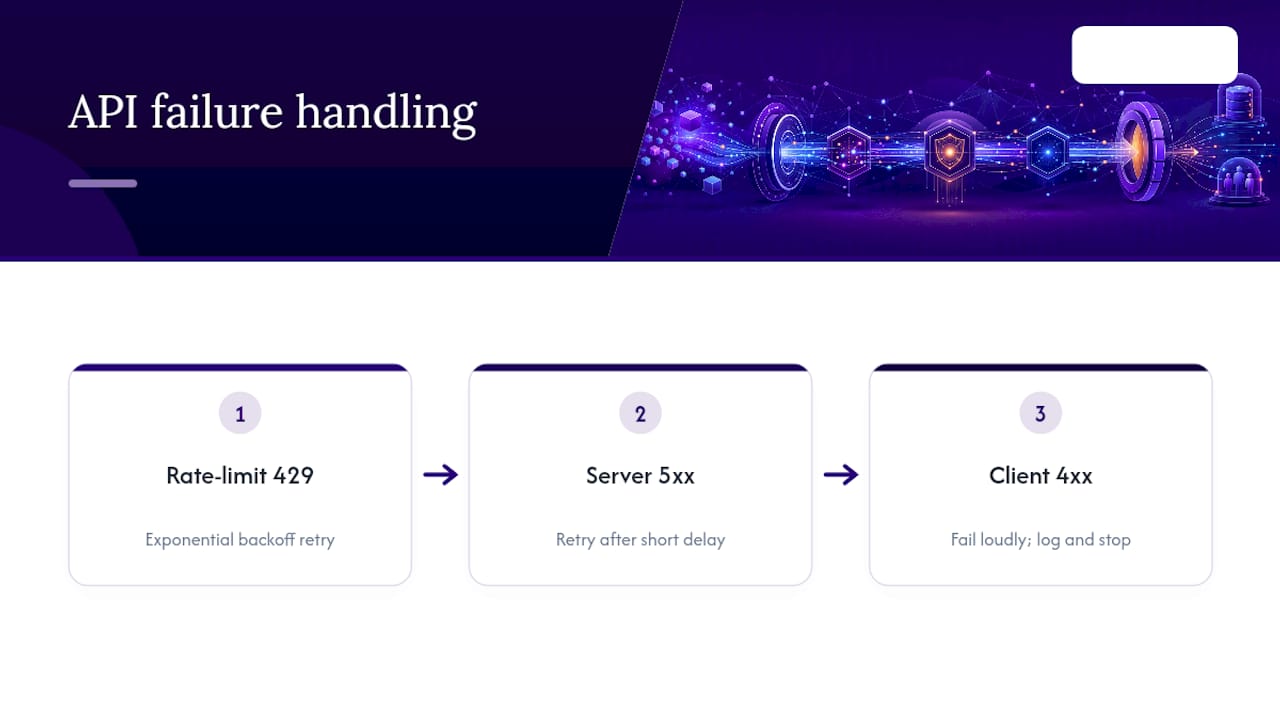
Build distinct handling for the three failure types you’ll actually see. Rate-limit errors (HTTP 429) need exponential backoff, not an immediate retry that just gets rejected again. Server errors (500-range) usually resolve on retry after a short delay. Client errors (400-range, malformed query parameters) will never resolve on retry and need to fail loudly into a log rather than looping forever.
Monitor for schema drift separately from monitoring for downtime. An endpoint can return a successful response with a changed field name or a dropped column, and that failure mode is more dangerous than an outage because nothing alerts you. Run automated checks that compare the shape of each day’s response against an expected schema, and alert when a field disappears, a type changes, or a value falls outside a historically normal range.
Set up dead-letter handling for records that fail validation after retrieval. Don’t drop them silently and don’t let them block the rest of the batch; route them to a queue a human reviews. Track a freshness indicator for every dataset in your integration, since Census data updates on a predictable annual or five-year cycle while SEC filings arrive continuously and unevenly. A dashboard that shows “last successful pull” per source catches a quiet failure long before a client asks why last quarter’s benchmark looks identical to the quarter before.
Log every failed and retried call with enough context (endpoint, parameters, timestamp, response code) to reconstruct what happened without re-running the query against production.
How Do You Optimize Performance for Large Data Volumes?
CBP alone covers millions of establishment records across thousands of NAICS and geography combinations. Pulling that volume efficiently is a different problem than pulling a single company profile.
Use incremental sync instead of full reloads wherever the source supports it. Most Census and SEC endpoints let you filter by period or last-modified date, so a nightly job should pull only what changed rather than re-downloading an entire dataset. Reserve full bulk reloads for scheduled events, like an annual Economic Census refresh, where a complete resync is actually justified.
Batch your queries around the natural grouping of the data. Requesting all NAICS codes for one geography in a single call, rather than one call per code, cuts request overhead dramatically on CBP and ABS endpoints. Parallelize carefully. Running concurrent requests speeds up a bulk pull, but every one of these APIs enforces rate limits, so uncoordinated parallel calls just trigger throttling and slow you down more than a sequential pull would.
Index your normalized analytical layer on the fields you actually filter by in production: NAICS code, geography level, and period. A benchmark query that scans an unindexed table of millions of establishment rows will time out under real client load even if the ingestion pipeline runs fine.
Cache aggressively on data that changes rarely. Economic Census figures are stable for five years; there’s no reason to hit that endpoint more than once per release cycle. Reserve your performance budget for the sources that actually update often, like SEC filings.
What Do Market Data APIs Cost, and How Is Licensing Structured?
Pricing for this category splits into a few recognizable models, and understanding which one you’re buying into matters as much as the sticker price.
Public government sources like CBP, the Economic Census, ABS, and SEC data are free to query, but “free” doesn’t mean “free of engineering cost.” You still pay in developer time to build and maintain the pipeline, map identifiers, and validate output, and that cost scales with how many sources you combine.
Commercial vendors typically charge per report, per record, or through a subscription that bundles API access with pre-built benchmarks and reports. Bizminer, for instance, prices individual outputs directly: a Company Profile, Industry Financial Performance report, or Industry Market report each run $249 one-off, while a Financial Report, Market Report, Valuation Report, or Company Report each run $349 one-off. Prospect list records price by tier, from $0.55 to $0.65 USD per record one-off depending on volume. Customizable API feeds and full subscription plans are priced on request rather than published, since scope varies by the number of markets and the depth of integration a firm needs.
Licensing terms matter beyond price. Check whether a vendor’s license permits redistribution inside a client-facing report, whether it restricts internal-only use, and whether cached or stored data has a retention limit. A license built for occasional lookups can quietly become the wrong fit once you’re running automated benchmarks across hundreds of prospects a month.
The Trade-Offs Nobody Puts in the Sales Deck
Every one of these integrations trades freshness against coverage: the broadest datasets update the slowest, and the fastest-moving ones cover the narrowest slice of companies. Normalization always costs more engineering time than the initial data pull, and teams that budget for ingestion but not for reconciliation get burned first. Treat your data contracts as versioned, monitor for schema drift the way you’d monitor uptime, and keep raw filing evidence on hand, because a benchmark that can’t be traced back to its source won’t survive a court challenge or a regulator’s question. Build outputs around how people actually work, in Excel, in a CSV export, or through a report template, not around what’s technically elegant to expose.
— Danny
How Bizminer Fits Into Your Data Integration Plan
There are providers specialized in assembling Census, ABS, and SEC feeds for benchmarks, covering many unique markets with customizable API feeds, granular NAICS and geography filters, prospect list tiers, and report formats designed for advisory, lending, and valuation work.

That granularity matters most when your output has to hold up under scrutiny. Bizminer’s data has been accepted in U.S. Tax Court and is used by government agencies, which is the kind of provenance bar most in-house integrations spend months trying to reach on their own. If you’re building prospect lists for a lending pipeline or benchmark reports for client advisory work, check Bizminer’s pricing for the report and prospect-list tiers, or schedule a subscription demo to see the API feed and reporting templates in action.
Sources
Public sources like CBP, the Economic Census, and SEC filings are free and authoritative, but combining them into usable benchmarks still requires identity resolution, normalization, and validation work. Many firms use public data to validate a commercial provider’s benchmarks rather than replace them entirely.
- County Business Patterns (CBP) API — U.S. Census Bureau
- Economic Census API — U.S. Census Bureau
- Annual Business Survey (ABS) API — U.S. Census Bureau
- Financial Statement Data Sets — U.S. Securities and Exchange Commission
- Federal Register: Final joint rule implementing FDTA data standards
FAQ
What Is the Difference Between Establishment and Registrant Data?
Establishment data, like Census CBP, counts physical business locations, while registrant data from the SEC counts legal entities that file reports, often covering many establishments under one filer. Mixing the two without explicit mapping produces ratios that look precise but misrepresent the underlying population.
Does Bizminer Offer a Customizable API Feed?
Yes, Bizminer offers a customizable API feed covering a large number of markets, filterable by NAICS code and geography, alongside standard report formats. Pricing for the API feed is available on request through Bizminer’s pricing page.
How Much Do Bizminer’s Reports and Prospect Lists Cost?
Standard reports like a Company Profile or Industry Market report run $249 one-off, while a Valuation Report or Financial Report runs $349 one-off, all listed on Bizminer’s pricing page. Prospect list records price between $0.55 and $0.65 USD per record one-off depending on the tier.
How Do You Handle Suppressed or Missing Data Cells?
Suppressed cells hide values to protect confidentiality and must be flagged separately from true zeros or fields that were never reported, following Census Bureau guidance on small-cell handling. Treating a suppressed value as zero in a benchmark average will distort the result and undermine the report’s credibility.