Loan underwriting data means the company financials, industry benchmarks, and comparative reports lenders use to test whether a borrower can repay a loan from cash flow. Its primary job is running the debt service coverage ratio (DSCR) against sourced industry benchmarks so an underwriter can set loan structure, pricing, and covenants that survive review. Sources like Bizminer supply the NAICS-level comparisons examiners expect, echoing the OCC’s interagency guidance on complete, current financial documentation.
TL;DR:
- Most lenders require a minimum DSCR of 1.25x, while SBA programs set a minimum of 1.15x to 1.25x, depending on loan size and guarantor structure.
- Industry benchmarks use NAICS-specific median and quartile ratios to evaluate a borrower’s financials within their sector.
- Underwriters standardize financial statements, add back discretionary items, and conduct stress tests, ensuring ratios are comparable across similar-sized firms.
- Automated tools handle routine data pulls and ratio calculations, but human judgment remains essential for assumptions and contextual risk analysis.
- Examiners demand complete, sourced documentation supporting ratio judgments, industry comparisons, and assumptions, with data privacy and fair lending compliance strictly enforced.
Table of Contents
- What Data Goes Into a Commercial Loan File?
- What Metrics and Benchmarks Do Underwriters Rely On?
- How Do You Collect and Normalize Underwriting Financials?
- How Does Underwriting Data Shape the Credit Memo?
- What Do Examiners Expect for Documentation?
- Where Does Alternative Data Fit in Underwriting?
- How Are Automated Tools Changing Underwriting Analytics?
- What Compliance and Privacy Rules Apply to Underwriting Data?
- Author Perspective: Why Granular, Court-Acceptable Benchmarks Matter
- Pull the Right Bizminer Report for Your Next File
- Sources
- FAQ
What Data Goes Into a Commercial Loan File?
A defensible underwriting file combines borrower-specific financials with third-party benchmarks that put those numbers in context. Neither works alone. A borrower’s tax return tells you what happened; an industry comparison tells you whether it’s normal.
The reports that matter most:
- Industry financial performance reports show median and quartile ratios by NAICS code, so a 22% gross margin reads as strong or weak depending on the sector.
- Company profiles compile a target’s financial history, ownership, and credit signals for a fast risk snapshot.
- Spreads convert raw financial statements into a standardized ratio format that a credit committee can scan in seconds.
- Trend and market reports track industry growth or contraction, which matters when a five-year term loan needs a five-year outlook.
- API-fed data lets loan origination systems pull benchmarks automatically instead of manual lookups on every file.
Peer selection depends on matching NAICS code and revenue or asset size, since a $2 million landscaping company and a $40 million one carry entirely different leverage norms. Beyond benchmark reports, request the borrower’s primary documents directly: three years of business tax returns, year-end and interim financials, six to twelve months of bank statements, and current accounts receivable and payable aging schedules.
What Metrics and Benchmarks Do Underwriters Rely On?
Cash flow coverage sits at the top of every commercial credit analysis, but leverage and liquidity ratios decide whether that coverage holds up under stress. The core ratio set:
- DSCR (net operating income divided by total debt service): the primary repayment test for nearly every commercial loan type.
- Global DSCR: DSCR calculated across all business and guarantor debt combined, catching over-leverage a single-entity DSCR would miss.
- Debt/EBITDA: measures how many years of earnings it would take to pay off total debt.
- Debt-to-worth: compares total liabilities to owner equity, a quick leverage gauge.
- Current and quick ratios: short-term liquidity, especially relevant for working-capital lines.
- Cash conversion cycle: how long cash is tied up in inventory and receivables before it converts back to cash.
- Interest coverage: EBIT divided by interest expense, isolating debt-servicing ability from principal repayment.
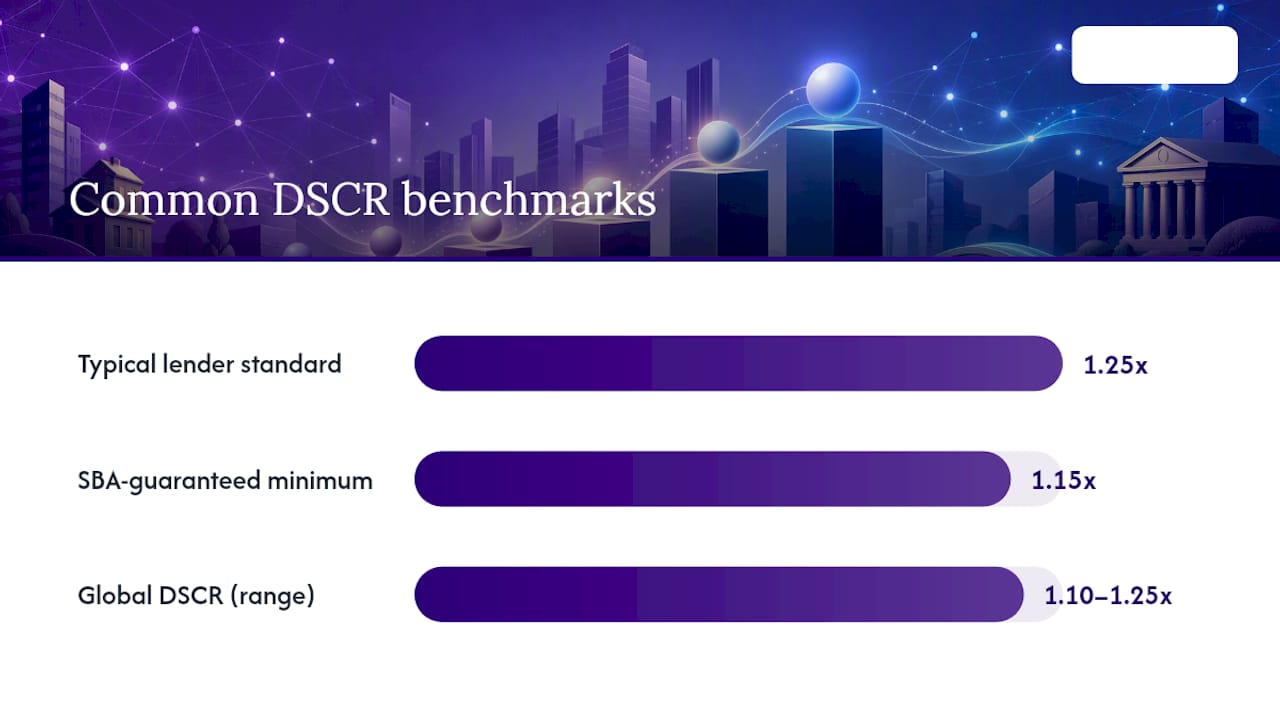
Benchmark callout: Lenders commonly apply a 1.25x DSCR as their internal underwriting standard, while SBA-guaranteed loan programs set a 1.15x minimum on loans above certain thresholds, and global DSCR often needs to land in the 1.10x to 1.25x range depending on guarantor structure. Treat these as policy conventions rather than fixed regulatory floors.
Which ratio dominates depends on loan type. Commercial and industrial (C&I) lending is cash-flow-first, weighing DSCR and leverage against the borrower’s operating history before collateral ever enters the conversation. Commercial real estate underwriting leans on DSCR and debt yield, tied to feasibility and sensitivity analysis under interagency CRE lending standards. Asset-based lending shifts the focus to working capital turnover and how quickly collateral could actually be liquidated.
Peer benchmarking only works when it’s same-industry, same-size. Comparing a $500,000 restaurant’s current ratio to an all-industry average tells you almost nothing useful, since credit analysis ratio sets are built to be read against a matched peer group, not a generic benchmark.
How Do You Collect and Normalize Underwriting Financials?
Raw financial statements rarely arrive underwriting-ready. Getting from a borrower’s tax return to a clean spread takes a consistent sequence, not a one-off cleanup job,
- Collect source documents: tax returns, CPA-prepared or internal financials, bank statements, and AR/AP aging.
- Spread the financials into a standardized ratio format so every borrower’s numbers sit in the same structure for comparison.
- Reconstruct operating cash flow, adding back non-cash and discretionary items like depreciation, owner compensation, or one-time expenses.
- Reconcile to bank statements, cross-checking that reported revenue and cash positions actually match deposit activity, a step standard underwriting workflows treat as non-negotiable.
- Map results to industry peers by NAICS code and size band to flag any ratio that’s an outlier.
- Run a stress test, typically a 10% reduction in cash flow, to confirm DSCR still clears the lender’s floor under pressure.
Every add-back needs a paper trail. If you’re normalizing owner salary or a one-time legal settlement out of EBITDA, attach the invoice, the agreement, or the payroll record that justifies it.
A borrower sitting at 1.30x can drop below your 1.25x floor with a modest revenue dip, and you want to know that before the committee meeting, not after.*
How Does Underwriting Data Shape the Credit Memo?
A credit memo’s job is to let someone who never met the borrower reach the same conclusion you did. That means leading with numbers, not narrative.
Put these front and center:
- Headline DSCR and global DSCR, both current and trailing three-year trend.
- Leverage position (Debt/EBITDA, debt-to-worth) against the matched industry peer range.
- Liquidity metrics (current ratio, cash conversion cycle) showing whether working capital can absorb a slow quarter.
- Industry trend context, flagging if the sector is expanding, flat, or contracting.
- Top two or three risks, stated plainly, with the mitigant tied to each.
From there, ratio results translate directly into structure. Weak liquidity might mean a shorter tenor or a borrowing-base structure instead of a term loan. Leverage above peer norms might call for a personal guarantee, additional collateral, or a stepped-down covenant schedule as debt amortizes.
A workable sequence looks like this: compute the core ratios, apply the stress test, draft a recommended structure (amount, tenor, rate, collateral), then set covenant triggers, minimum DSCR maintenance, and a reporting schedule, such as quarterly financials or annual tax return updates, that lets you monitor the file after closing. Tools that quantify how much benchmark variance could cost in earnings at risk help turn a soft “this looks weak” into a number the committee can actually price.
What Do Examiners Expect for Documentation?
Bank examiners aren’t grading style. They’re checking whether a file’s conclusions are traceable and whether every assumption has a source behind it.
Expect scrutiny on: a complete file matched to loan size and complexity, comparative industry data supporting any ratio judgment, documented assumptions behind every projection, current collateral valuation, and evidence of periodic portfolio review. The OCC’s exam guidance is explicit that files should be as complete as practical given the loan’s size, not padded for its own sake.
Build your audit trail as you go: keep the source document list, bank reconciliation, sensitivity table, and the final covenant and reporting schedule together in one file. Citing benchmarks from a source with documented NAICS methodology rather than an anecdotal comparable is what turns a judgment call into a defensible one when an examiner asks why.
Where Does Alternative Data Fit in Underwriting?
Financial statements and tax returns still carry the underwriting decision, but alternative data fills in the gaps between year-end filings. Transaction-level bank data shows revenue volatility a static balance sheet can’t, catching a business with three strong months propping up nine weak ones. Point-of-sale and merchant processing data offers a near real-time proxy for revenue trends between annual statements.
Behavioral data, payment timing on trade credit, utility payment history, even the consistency of payroll runs, adds texture to the qualitative side of underwriting without replacing the cash-flow math. None of it substitutes for a proper DSCR calculation. It supplements the primary analysis, particularly useful for newer businesses that lack three years of clean financials to spread.
The risk with alternative data is treating it as equivalent to audited or tax-return-based financials. It isn’t. Use it to flag questions worth investigating, not to override what the core spread and industry benchmark comparison already show. A borrower whose bank deposits look choppy but whose tax returns and industry position are solid deserves a follow-up question, not an automatic decline. The reverse is also true: clean-looking transaction data can’t rescue a borrower whose fundamental leverage sits well outside peer norms.
How Are Automated Tools Changing Underwriting Analytics?
Automated underwriting systems have taken over the mechanical parts of the job: pulling financial statement data into spreads, flagging ratios outside policy thresholds, and running the stress test automatically instead of by hand in a spreadsheet. That speed matters most on smaller-dollar commercial loans where manual spreading used to take hours per file.
Machine learning models add pattern detection that manual review tends to miss. A model trained on thousands of prior loans can flag subtle combinations, a shrinking current ratio paired with slowing receivables turnover, that individually look fine but together predict stress. These tools are increasingly used to score files for a first pass before a credit analyst ever opens the folder.
What automation hasn’t replaced is judgment on the assumptions behind a projection or an add-back. An algorithm can compute DSCR instantly once the inputs are clean, but deciding whether a one-time gain belongs in adjusted EBITDA still takes a human who understands the business. The strongest workflows use automated tools and analytics to handle volume and consistency, then route anything outside policy thresholds to a credit analyst for the judgment calls a model shouldn’t be making alone. Treat automated scoring as a triage step, not a final answer.
What Compliance and Privacy Rules Apply to Underwriting Data?
Commercial loan files carry sensitive financial data, tax identification numbers, bank account details, and often personal financial statements from guarantors, which puts data handling under real regulatory weight. Fair lending rules require underwriting criteria to be applied consistently across similarly situated borrowers, which is part of why documented, sourced benchmarks matter more than an underwriter’s gut feel. A judgment call that isn’t traceable to a benchmark or policy standard is harder to defend in a fair lending review.
Data retention and access controls matter just as much as the underwriting math. Borrower financials, bank statements, and guarantor personal information need restricted access within the institution and a retention schedule that matches regulatory recordkeeping requirements, not an indefinite hold. When third-party data providers feed into underwriting systems via API, that data-sharing relationship needs its own privacy and security review, since the institution remains accountable for how borrower data is stored and used regardless of where the report originated.
The compliance upside of using sourced, third-party industry benchmarks instead of internal comparables built from a lender’s own loan book: it keeps the standard applied consistently across borrowers and reduces the chance that pricing or approval decisions reflect internal bias built into prior deal history.

Author Perspective: Why Granular, Court-Acceptable Benchmarks Matter
Court-accepted, NAICS-segmented benchmarks cut down on approval exceptions because they give a committee a documented reason to say yes instead of an educated guess. I’ve seen too many credit memos lean on a comparable the underwriter half-remembers from a deal three years back. That’s not a benchmark. Prioritize sourcing you can defend under questioning over anecdote every time, even when the anecdote feels right.
— Danny
Pull the Right Bizminer Report for Your Next File
Bizminer maps directly onto the data needs covered above, without forcing you to piece together benchmarks from scattered sources. Pull an Industry Financial Performance report to get NAICS-matched peer ratios before you spread a single statement, or run a Company Profile when you need a fast risk snapshot on a prospective borrower. For deals that need a fuller picture, a Financial Report or Valuation Report adds the depth a committee memo demands.

If your file needs something more specific than a standard report covers, a custom report built to your exact criteria can pull the NAICS segment, size band, and geography that actually matches your borrower. Start with Bizminer’s pricing page to see report and subscription options, and pull your first benchmark before your next credit committee deadline.
Sources
- OTS Exam Handbook: Loan Analysis and Underwriting
- Comptroller’s Handbook: Commercial Real Estate Lending
- SBA DSCR & Underwriting Benchmarks by Industry (2026)
- C&I Lending: How Banks Underwrite a Commercial & Industrial Loan – LenderAnalyzer
FAQ
What Is Loan Underwriting Data?
Loan underwriting data refers to the company-level financials and industry benchmark reports lenders use to judge a borrower’s repayment ability and set loan terms. It includes spreads, DSCR calculations, leverage ratios, and comparative NAICS-segmented industry data, all pulled together to support a credit decision.
What DSCR Do Lenders Typically Require?
Most commercial lenders target a DSCR of 1.25x as an internal underwriting standard, while SBA-guaranteed programs set a minimum DSCR slightly above 1.10x on loans above certain thresholds. These are policy conventions rather than fixed regulatory rules, so the exact floor can shift by lender and loan type.
How Do Underwriters Verify a Borrower’s Financials?
Underwriters reconcile reported financials against bank statement activity and accounts receivable and payable aging schedules, a step standard workflows treat as essential before any ratio calculation. This catches discrepancies between what a borrower reports and what actually moved through their accounts.
How Much Does a Bizminer Industry Report Cost?
Bizminer’s Industry Financial Performance and Company Profile reports are each $249 per report as a one-off purchase, while Financial, Market, Valuation, and Company Reports are available as paid reports, with pricing details available on their website. Prospect lists are priced per record, and current pricing for all options is listed on Bizminer’s pricing page.
Why Do Examiners Care About Comparative Industry Data?
Examiners expect underwriting conclusions to be traceable to sourced, comparative data rather than an underwriter’s informal judgment, per interagency exam guidance. Using a documented industry benchmark instead of an anecdotal comparable makes a file’s conclusions defensible during review.