A defensible peer group is a purpose-driven set of comparators chosen after defining a clear compensation philosophy, not a list borrowed from last year’s proxy season. The immediate next step: pick your primary size metric (usually revenue or market cap), then run analytical screens to build a core group of roughly 12 to 20 companies. Document every judgment call as you go.
TL;DR:
- A purpose-driven peer group should be built based on the company’s compensation philosophy and relevant size and industry criteria, not last year’s list.
- Different peer groups serve pay benchmarking, performance measurement, or valuation purposes, requiring distinct selection criteria and judgment.
- The initial peer list should be sourced from proxy disclosures, industry databases, and benchmarking datasets, then refined through size, business model, and talent competition filters.
- Final peer groups should be narrow, well-matched, and aligned with the company’s size metrics, maintaining a size of 12 to 20 companies for meaningful comparisons.
- Regular annual updates are recommended, with immediate review triggered by major events like mergers, IPOs, or sudden size changes, supported by thorough documentation.
Table of Contents
- What Does Peer Group Selection Actually Involve?
- How Should Compensation Philosophy Shape Peer Choices?
- Which Criteria and Screens Build a Defensible Peer List?
- How Do You Build the Initial Peer Pool Step by Step?
- How Do You Refine and Finalize the Group?
- What Governance and Disclosure Standards Apply?
- When Should You Update Your Peer Group?
- What’s a Practical Checklist for This Quarter?
- Why Granular Benchmarking Data Strengthens Peer Selection
- What Do Practitioners Consistently Get Wrong?
- Get Committee-Ready Benchmarking Data Without Building It Yourself
- Sources
What Does Peer Group Selection Actually Involve?
Peer group selection means matching your comparator set to the question you’re answering, and the question changes what “good” looks like. A benchmarking peer group supports pay-level decisions: what should the CEO earn relative to similar roles at similar companies? A performance peer group, often used for relative total shareholder return (TSR) awards, needs price and return data over a defined period, so its membership criteria can differ sharply from a pay-benchmarking set.
Valuation comparables serve a third purpose entirely. When you’re pricing a business or a division using multiples, you need companies with similar margin structure, growth rate, and capital intensity, regardless of whether they’d ever appear on an executive pay peer list. A comparable-company valuation approach separates economic fit from financial-risk fit, and that discipline carries over to compensation work.
None of these peer groups replace judgment. Statistical screens narrow the field; a human being still has to decide whether a company that clears every filter is genuinely comparable.
How Should Compensation Philosophy Shape Peer Choices?
Your compensation philosophy comes before your peer list, not after it. If the committee’s stated goal is to target the 50th percentile for base pay and the 75th for total compensation tied to performance, that objective determines whether you lean toward larger, aspirational peers or a tighter comparator set that mirrors your current scale.
Companies chasing scarce technical talent sometimes justify including peers larger than their own revenue base, on the theory that pay competition is driven by talent markets, not just size. That’s a defensible position, but only if the committee minutes say so explicitly. Guidance on constructing a compensation peer group treats philosophy as the starting input, with analytical screens and qualitative judgment layered on top. Skip that step and every later choice looks arbitrary to a proxy advisor or an auditor asking why.
Which Criteria and Screens Build a Defensible Peer List?
Start with industry classification, usually GICS, then layer size filters based on what actually drives pay levels in your sector. Revenue works well for most industries; asset-heavy sectors like banking or insurance often need total assets instead; capital markets and biotech frequently rely more on market capitalization or enterprise value.

ISS applies its own size constraints, generally using revenue or asset multipliers between roughly 0.4x and 2.5x of the subject company, combined with market-cap buckets, and typically expects a resulting group of at least 12 companies, with the ceiling shifting by how tightly the GICS codes match. Building your screens with those parameters in mind avoids a mismatch when a proxy advisor runs its own analysis against your disclosure.
Beyond industry and size, a few more screens matter:
- Talent competition: include companies that compete for the same executive talent pool, even if their size profile differs slightly.
- Reverse peers: check who lists you as a peer; asymmetry (they include you, you exclude them) invites scrutiny.
- Peers-of-peers: review the peer lists of your initial candidates to surface comparators you might have missed.
- Proxy-advisor lists: treat ISS and Glass Lewis peer constructions as a cross-check, not a template to copy wholesale.
How Do You Build the Initial Peer Pool Step by Step?
Assembling a workable long list is mostly a data-sourcing exercise before it’s an analytical one. Pull candidate companies from proxy filings (DEF 14A peer disclosures), ISS and Glass Lewis peer methodology outputs, industry classification databases, and commercial benchmarking datasets that track financials at the segment level.
- Seed the long list from proxy peer disclosures, GICS/NAICS codes, and industry benchmark databases like Bizminer’s industry financial benchmarks.
- Apply the size filter using your chosen primary metric, keeping candidates within a reasonable multiple of your own scale.
- Apply a business-model filter to remove companies that clear the size test but operate a fundamentally different business (a diversified conglomerate segment versus a pure-play competitor, for example).
- Run the talent-competition check and flag any reverse-peer mismatches.
- Sanity-check for anomalies: recent acquisitions, one-time accounting charges, or companies with too little public financial history to generate reliable multiples.
- Label each survivor core, secondary, or context-only based on how closely it matches on the metrics that matter most to your philosophy.
That last step matters more than practitioners often admit. Treating every candidate as equally weighted, rather than tiered, is one of the more common reasons a peer group looks arbitrary under scrutiny.
How Do You Refine and Finalize the Group?
Once the long list is built, measure dispersion, not just averages. Calculate where your company falls relative to the group on revenue, market cap, and whichever metric ties most directly to the pay element you’re benchmarking. The goal is landing near median on most of those measures, not just one convenient metric.
When revenue and market cap point in different directions, use the metric most closely tied to the compensation element in question. Revenue tends to drive pay-level decisions; market cap matters more for equity-based awards, per Pearl Meyer’s peer group construction guidance.
On group size, the Equilar 500 analysis found that peer groups of 16 to 18 companies were the most common among large companies, at about 29.6%, with 13 to 15 members next at 21.6%. Aim for a core of 12 to 20; below that, one outlier skews every percentile.
What Governance and Disclosure Standards Apply?
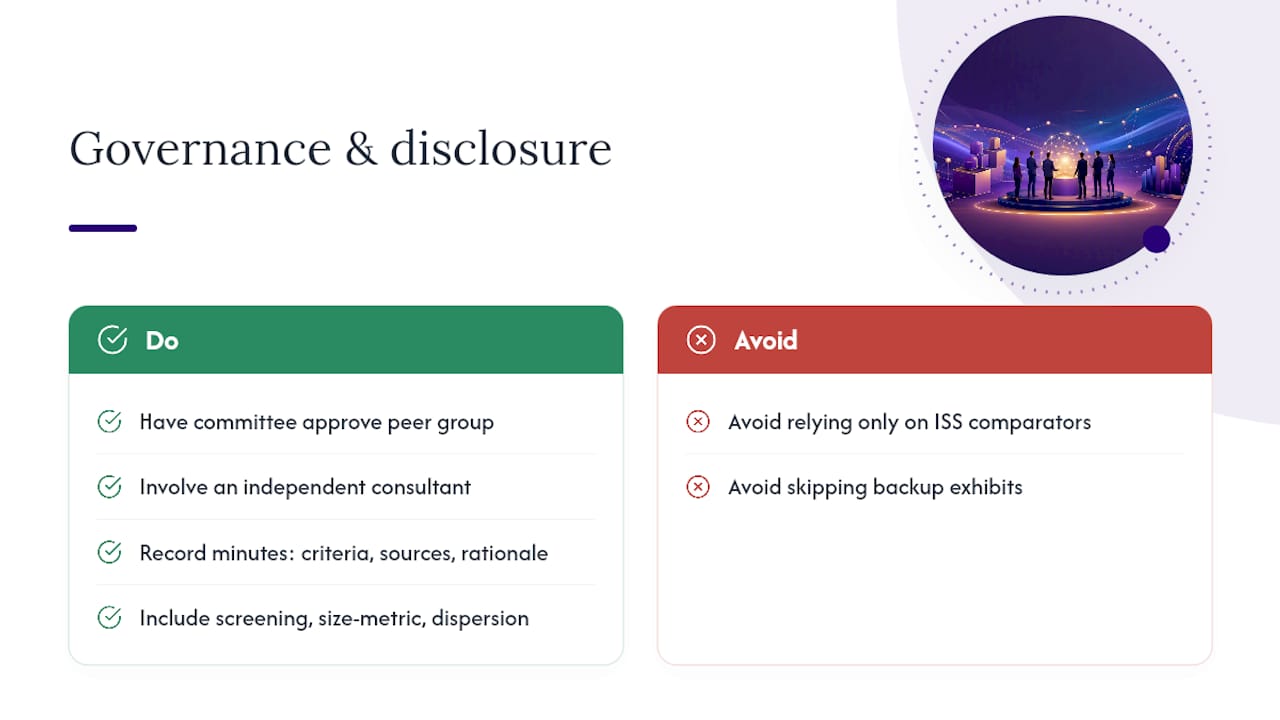
The compensation committee, not management alone, should approve the final peer group, typically with input from an independent compensation consultant. That approval needs a paper trail: committee minutes recording the criteria applied, the data sources used, and a stated rationale for every inclusion and exclusion, especially the judgment calls that don’t follow purely mechanical screens.
Proxy disclosure under Item 402 expects clarity on how peers were chosen and used. Since ISS builds its own comparator groups on a fixed schedule and compares them against your disclosed list, understanding ISS’s methodology ahead of filing avoids surprises during proxy season. Committee materials should include the screening criteria, the size-metric rationale, and dispersion statistics as backup exhibits, not just the final list.
When Should You Update Your Peer Group?
Refresh the peer group annually as standard practice, ideally timed to avoid a mismatch with ISS’s own construction cycle. ISS typically builds its peer groups each December for meetings held on or after February 1, so aligning your internal refresh with that window reduces year-over-year noise in comparisons.
Certain events warrant an immediate look regardless of the calendar: a major acquisition or divestiture, an IPO or spin-off that changes your size profile, or a peer’s sudden growth or decline that pulls the group’s median out of range. Document every change with the same rigor as the original selection, and communicate the rationale to the committee before, not after, the next proxy cycle.
What’s a Practical Checklist for This Quarter?
Run through these steps to get committee-ready before your next review cycle:
- Document the compensation philosophy in writing, including target percentile and pay mix priorities.
- Choose the primary size metric for screening (revenue, market cap, or assets, depending on sector).
- Run initial industry and size screens to build the long list.
- Apply business-model and talent-competition filters to cut the list to a workable size.
- Assign core, secondary, and context-only labels to remaining candidates.
- Run dispersion analysis and confirm the subject company sits near median.
- Draft the committee memo documenting criteria, sources, and rationale for exclusions.
- Schedule the next annual refresh, timed around ISS’s construction window.
Pro Tip: Keep a standing document that logs every peer added or dropped, with a one-line reason for each change. When a proxy advisor or auditor asks why a company left the list three years ago, that log saves you from reconstructing the logic from memory.
Why Granular Benchmarking Data Strengthens Peer Selection
Dispersion problems usually trace back to thin or inconsistent data, not bad judgment. Bizminer’s benchmarking data spans over 9,000 industry and local markets, and its reports have been accepted as evidence in U.S. Tax Court, which speaks to how granular financial detail holds up under scrutiny.
Custom reports built on that dataset give committees reproducible outputs. A consistent benchmarking methodology means the same screening logic produces the same result next year, which matters when a proxy advisor asks how a number was derived. Local and segment-level benchmarks also help refine talent-competition checks, particularly for private or thinly traded peers where public filings alone leave gaps.
What Do Practitioners Consistently Get Wrong?
The three mistakes that keep showing up: copying a competitor’s peer list wholesale instead of running independent screens, padding the group to look thorough rather than keeping it tight and genuinely comparable, and skipping documentation on the judgment calls that a mechanical screen can’t make for you.
A compact, well-matched core beats a long list every time. Write down the reasoning, even for the calls that feel obvious in the moment.
— Danny
Get Committee-Ready Benchmarking Data Without Building It Yourself
The workflow above depends on data quality at every step, and that’s usually where committees run out of time, not judgment. Granular financial benchmarks across more than 9,000 industry and local markets are available, so you can pull comparator financials, dispersion inputs, and talent-market context without stitching together data from scattered filings.
Custom reports built through Bizminer’s analysis tools come with a documented benchmarking methodology, which means the numbers you hand the committee are reproducible if a proxy advisor or auditor asks how they were derived. If your current comparator data leaves gaps for private peers or thin public-company history, that’s exactly where granular local benchmarks fill the space. Start by pulling a market and industry research profile for your subject company’s sector to see what a committee-ready benchmark exhibit actually looks like before your next review cycle.
Sources
- Peer group selection trends among the largest U.S. companies
- ISS peer group methodology and guidance
- Constructing a compensation peer group