
Asset-light services and software consistently report the highest profit margins, while grocery and general retail sit at the bottom, largely because of capital intensity and pricing power. Comparing sectors only works when you hold margin type constant across the comparison. For the underlying numbers, BEA and FRED remain the most reliable public starting points, with custom datasets filling in the industry-level detail those tables leave out.
TL;DR:
- Use gross margin for pricing and direct costs, operating margin for core efficiency after lease and R&D adjustments, and net margin mainly for valuation.
- Grocery net margins frequently fall below 3%, while general retail often ranges from 2% to 5%; compare grocery firms with grocery peers, not broad retail.
- Narrow benchmarks by NAICS code, firm size, geography, business model, and recent years, then report the median and interquartile range instead of relying on averages.
- Profitability gaps between top performers and typical firms have widened; use scenario analysis for sectors facing cyclical or commodity risks rather than a static margin.
Table of Contents
- Margin Types and Why Comparability Matters
- Typical Margin Bands Across Major Industry Groups
- What Drives Margin Differences Across Industries
- Recent Trends in Corporate Profits and Industry Dispersion
- How to Build a Defensible Profitability Benchmark
- What a Trustworthy Industry Dataset Needs to Show
- Segmenting Industries for More Relevant Benchmarks
- Putting Profitability Trends to Work in Real Decisions
- What Analysts Should Keep in Mind
- Get Industry-Specific Benchmarks Built for Your Use Case
- FAQ
- Sources
Margin Types and Why Comparability Matters
Gross margin measures revenue minus the direct cost of goods sold. Operating margin (often shown as EBIT margin) subtracts overhead, salaries, and other operating costs, giving a cleaner view of core business efficiency. Net margin goes further, deducting interest, taxes, and one-time items, which makes it the most complete figure but also the most exposed to financing choices that have nothing to do with operational performance.
Raw comparisons break down fast once you cross industries. A retailer that leases most of its stores looks weaker on operating margin than a competitor that owns its real estate, even if the underlying businesses perform the same. Software companies that expense heavy research and development, or pay staff partly in stock, can show depressed margins that don’t reflect cash economics.
- Use gross margin to compare pricing power and cost structure.
- Use operating margin, adjusted for leases and R&D, for apples-to-apples operational benchmarking.
- Use net margin mainly for valuation work, where financing and tax effects matter.
Typical Margin Bands Across Major Industry Groups
Margin ranges vary enough by sector that a single “good margin” number is close to meaningless without context.
- Software and technology: typical net margins often run from the high teens to the high 20s percent range, with mature SaaS businesses sometimes reporting higher once growth spending slows.
- Healthcare products (pharmaceuticals, medical devices): typically mid-teens to high 20s percent, reflecting patent protection and regulatory barriers to entry.
- Financials (banks, insurers): net margins are structurally different from product businesses, commonly in the 15 to 25 percent range, but comparisons here need sector-specific ratios rather than standard gross margin.
- Manufacturing: typically single digits to low double digits, varying heavily with capital intensity and commodity input costs.
- General retail: often in the 2 to 5 percent net margin range, driven by thin pricing and high competitive intensity.
- Grocery: among the thinnest margins of any sector, frequently below 3 percent net, due to low pricing power and high volume dependence.
- Hospitality and leisure: wide swings, often mid-single digits in normal years but highly sensitive to occupancy and discretionary spending cycles.
- Construction: generally low single digits on net margin, reflecting project risk, fixed-bid pricing, and labor cost exposure.
- Transportation: low single digits to high single digits, depending heavily on fuel costs and asset utilization.
These bands hide real variance within each group. Enterprise system software and consumer SaaS carry different cost structures despite both falling under “software.” Cyclical sectors like construction and transportation also see bands shift meaningfully with the economic cycle, and commodity-exposed manufacturers can swing from strong to negative margins within a few quarters based on input price moves.
What Drives Margin Differences Across Industries
Several structural factors explain why one industry consistently outperforms another on profitability, beyond simple supply and demand.
- Capital intensity: Businesses with heavy fixed-asset requirements, like manufacturing or transportation, need higher revenue just to cover depreciation and financing costs.
- Market concentration and strategic investment: Industries where a few firms account for most market share often sustain higher margins, but strategy research finds that concentration alone doesn’t explain profitability gaps; strategic investment intensity in R&D and advertising, along with firm-level efficiency differences, matter just as much.
- Import competition: Sectors exposed to global supply chains, such as food processing, often see domestic price-cost margins compressed by foreign competition and multinational pricing pressure, according to research on U.S. food processing.
- Revenue model: Recurring-revenue businesses (subscriptions, licensing) tend to post steadier, often higher margins than transaction-driven businesses that compete order by order.
Recent Trends in Corporate Profits and Industry Dispersion
Aggregate corporate profits have moved higher in several recent quarters. BEA data shows corporate profits before and after tax rising through 2024 into 2026, and the FRED corporate profits after tax series reported corporate profits at a seasonally adjusted annual rate near $3.88 trillion in the second quarter of 2026, giving a concrete benchmark for tracking aggregate profit levels over time.
That headline number tells only part of the story. An academic analysis of U.S. profit rates documents that the distribution of firm-level profitability has widened steadily since the 1980s, meaning the gap between top performers and the median firm within an industry has grown. A rising aggregate profit figure can mask a shrinking middle, where a smaller group of firms captures a larger share of industry profit while many others tread water or lose ground.
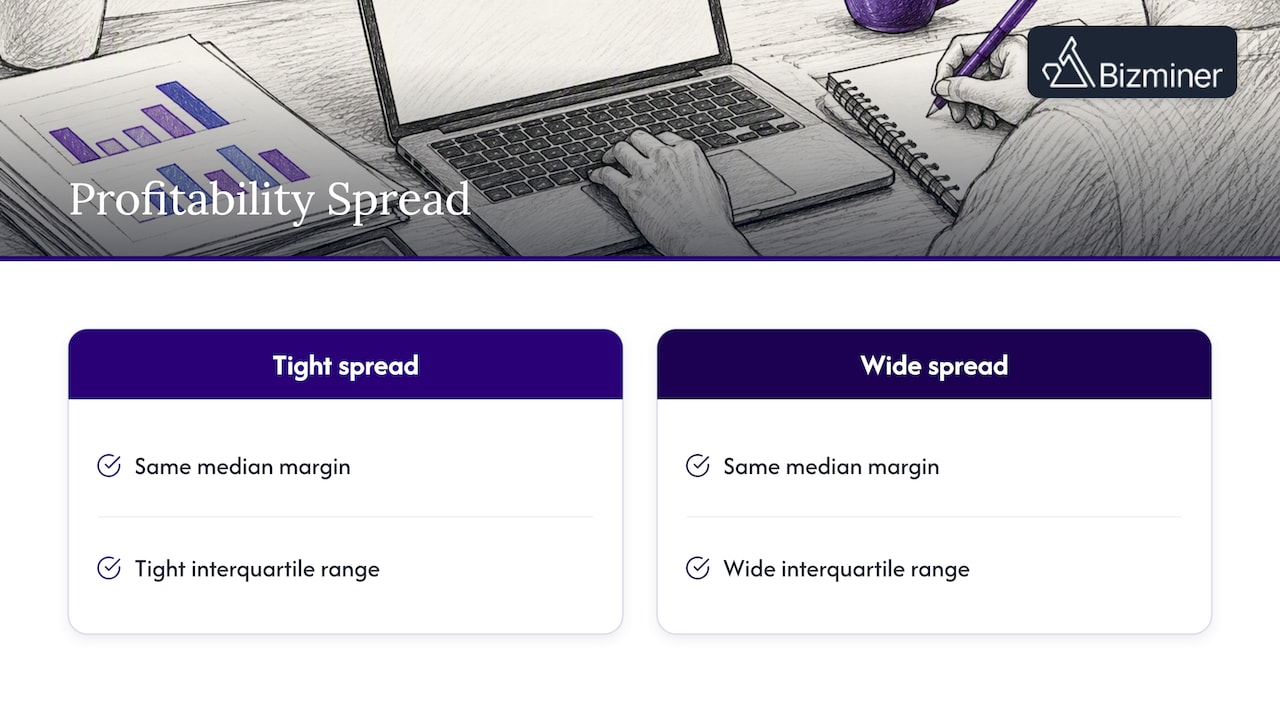
For anyone using these figures to size up an industry, the practical implication is to never rely on a single average. A median gives you the typical firm’s experience, while the interquartile range shows how much that typical experience actually varies. An industry with a healthy median margin but a wide spread is a very different proposition than one with the same median and a tight spread, even though a quick glance at aggregate numbers would show them as identical.
How to Build a Defensible Profitability Benchmark
Building a benchmark that holds up in advisory work, lending decisions, or litigation takes more than pulling one number off a database.
- Choose your margin type and reporting basis first. Decide whether gross, operating, or net margin fits the job, and confirm whether your data source uses GAAP figures or has made its own adjustments.
- Filter by NAICS code, firm size band, and year range. Broad industry averages mix firms of very different scale; narrowing the sample improves relevance.
- Adjust for leases and R&D where it matters. Capital-intensive or innovation-heavy sectors need these adjustments to avoid comparing businesses with fundamentally different cost treatments, a point also made in practitioner margin datasets.
- Normalize one-time items and report median plus interquartile range, not just a mean, since skewed distributions make averages misleading.
- Commission a custom report or API feed when you need a sample large enough, and documented enough, to survive scrutiny in a valuation dispute or court filing.
Our practical playbook on building industry benchmarks walks through each of these filters in more depth.
Pro Tip: When a sector shows a wide gap between mean and median margin, report both figures side by side rather than picking the one that looks better.
What a Trustworthy Industry Dataset Needs to Show
A defensible dataset documents its sample size, sources, and NAICS alignment, and lets you adjust for items like leases or R&D rather than forcing a one-size-fits-all number. We built our industry financial profiles and industry market profiles around granular data drawn from reliable public and private sources, covering more than 9,000 unique markets.
Segmenting Industries for More Relevant Benchmarks
A single NAICS code often lumps together businesses with little in common. “Software publishers” covers everything from enterprise infrastructure vendors to small consumer app studios, and their margin profiles rarely match. Getting a benchmark that actually informs a decision means segmenting further than the headline code.
Geography is one useful cut, since labor costs, local competition, and regulatory burden shift margins even within the same industry. Firm size is another: a five-person consulting shop and a 500-person firm in the same NAICS code face different overhead ratios, access to credit, and pricing leverage. Revenue band segmentation catches this even when employee count doesn’t tell the full story, since some businesses scale revenue without scaling headcount.
Business model is a segmentation axis that general industry codes miss entirely. Within “retail trade,” a subscription-box retailer and a traditional discount store carry fundamentally different cost structures and margin ceilings, even if both get classified the same way for statistical purposes. Separating recurring-revenue models from transaction-driven ones inside a broader code produces a benchmark that actually resembles the business you’re evaluating.
Vintage matters too. An industry’s margin structure from five years ago may not reflect current competitive dynamics, particularly in sectors reshaped by new entrants or supply chain shifts. Segmenting by recent year ranges, rather than blending a decade of data into one average, keeps a benchmark current. The goal across all of these cuts is the same: narrow the comparison group until it looks enough like the business or industry question in front of you that the resulting numbers are decision-useful, not just descriptive.
Putting Profitability Trends to Work in Real Decisions
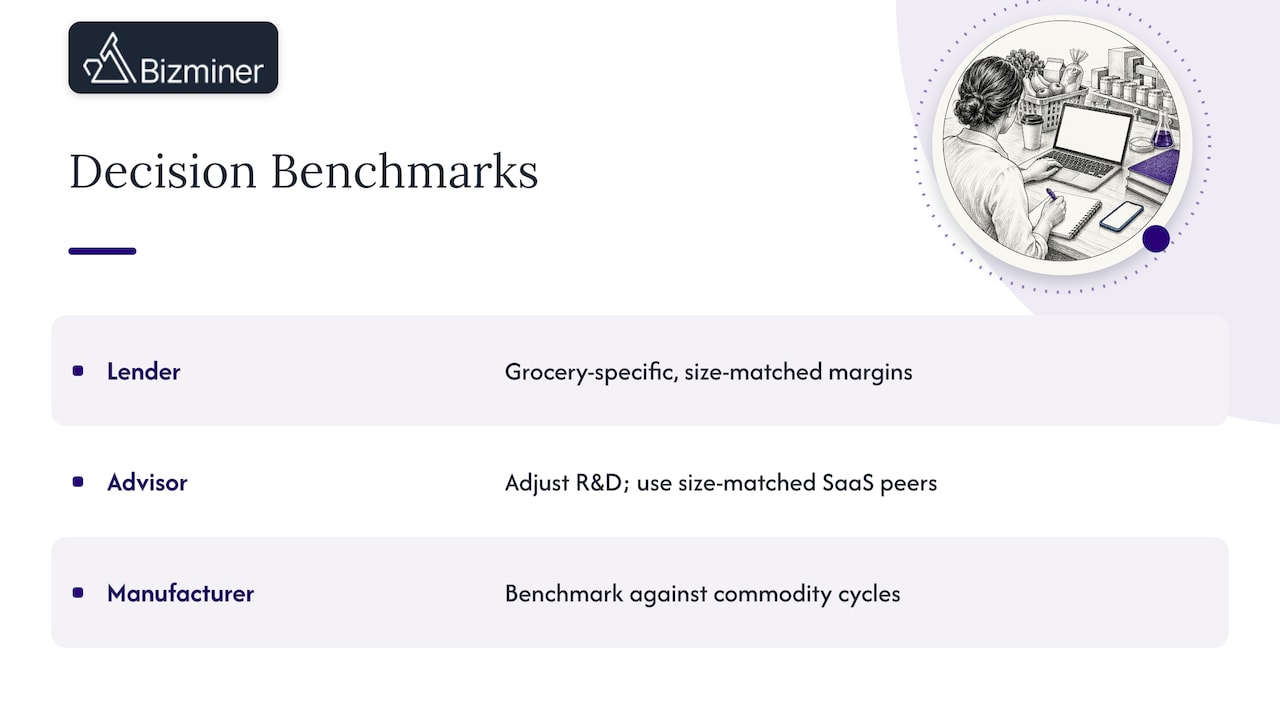
A lender evaluating a loan application for a regional grocery chain gains little from a generic retail margin figure. Grocery margins sit near the bottom of all major sectors, so a figure built from broader retail data would overstate what a healthy grocery operator should earn, potentially leading to an unrealistic repayment assumption. Narrowing the comparison to grocery-specific, size-matched data changes the risk read entirely.
A business advisor valuing a software company for an acquisition faces the opposite problem: raw operating margins for “technology” as a category swing widely depending on whether the sample includes capital-intensive systems vendors or asset-light SaaS firms. Adjusting for R&D treatment and filtering to a size-matched SaaS peer set produces a margin figure that actually supports a valuation multiple, rather than one skewed by firms with completely different cost structures.
A manufacturer assessing whether its margin compression is company-specific or industry-wide needs a benchmark that accounts for commodity cycles. If input costs have risen across the entire sector, a margin decline reflects market conditions rather than a controllable problem, which changes the strategic response from “cut costs” to “wait out the cycle or pass through pricing.” In each case, the decision only improves once the benchmark matches the specific segment, size, and time period the business actually operates in, rather than a broad sector label.
What Analysts Should Keep in Mind
Benchmarks fail when they report only a central number. A median margin without its interquartile range hides whether an industry is stable or increasingly split between winners and laggards, a pattern that’s only grown more pronounced over time. Run scenario analysis for cyclical or commodity-exposed sectors instead of trusting one static figure. Report dispersion, not just the midpoint, and treat every benchmark as a starting point for judgment rather than a verdict.
— Danny
Get Industry-Specific Benchmarks Built for Your Use Case

When a generic sector average won’t cut it, we build reports around your actual filters: NAICS code, firm size, geography, and year range. Our Industry Financial Performance reports and Company Profile reports start at $249 per report, with Financial Report, Market Report, and Valuation Report options at $349 per report, plus custom API feeds for ongoing data needs. Every report draws on the same granular data accepted in U.S. Tax Court and used by government agencies, so the numbers hold up when it counts. Check current pricing or start with a custom analysis report built around your exact benchmark question.
FAQ
Is a 20% Profit Margin Good for a Company?
Whether 20% is strong depends entirely on the sector: it’s a healthy result for software or healthcare products, where typical net margins often fall in that range or lower, but it would be exceptional for grocery or general retail, where margins frequently sit below 5%. Always compare the figure against that specific industry’s typical band rather than a flat universal standard.
What Is Revenue Trend Analysis?
Revenue trend analysis tracks how a company’s or industry’s revenue moves over multiple periods to identify growth, decline, or seasonal patterns. It’s typically paired with margin analysis, since rising revenue alongside shrinking margins can signal pricing pressure or rising costs that a revenue figure alone would miss.
Which Industries Tend to Be Most Profitable?
Asset-light sectors with strong pricing power, like software and certain healthcare products, tend to post the highest net margins due to low marginal costs per additional sale and durable competitive barriers such as patents. Capital-intensive and highly competitive sectors like grocery, general retail, and construction tend to sit at the opposite end.
What Is the Difference Between Profit and Revenue?
Revenue is the total amount a business brings in from sales before any costs are subtracted. Profit is what remains after costs, expenses, and taxes are deducted, and it comes in different forms (gross, operating, net) depending on which costs have already been removed.
Sources
- Corporate Profits — Department of Commerce (BEA) (ECONI 2026)
- CPATAX — Corporate Profits After Tax with IVA and CCAdj (FRED)
- Profitability of industries and firms over time — JSMA / Emerald
- Stylized facts on the evolution of profit rates in the U.S. — AEA conference paper