
Industry comps data is a set of financial metrics and valuation multiples drawn from comparable companies, used to benchmark performance, price a business, or evaluate competitive position. The right first move is never to pull a multiple off a spreadsheet: it is choosing your peer filters and locking a measurement date, since multiples shift with market conditions. From there, sources like Aswath Damodaran’s data files, SEC filings, and purpose-built platforms provide the raw material.
TL;DR:
- Build peer groups around industry, size, growth, business model, geography, and fiscal period; label widened secondary peers and exclude distressed or acquisition targets.
- Use EV/EBITDA for peers with different debt loads, P/E only among similarly leveraged companies, and EV/Sales when earnings are thin, negative, or unstable.
- Remove one time charges and gains, align fiscal periods, and flag companies with negative earnings; use medians or trimmed means to limit outlier effects.
- Present the 25th to 75th percentile multiples as a valuation range, then explain adjustments for faster growth, customer concentration, or stronger margins.
- Record the measurement date beside every multiple, retain raw inputs and sources, and keep an adjustment log so reviewers can trace each valuation.
Table of Contents
- Core metrics and multiples in industry comps data
- Selecting a peer group: concrete criteria and filters
- Normalizing and adjusting peer data
- From multiples to an implied valuation: interpretation and sensitivity
- Mini-workflow: step-by-step example applying industry comps data
- Making comps defensible: sample size, provenance, and methodology
- What busy practitioners should do next
- Getting audit-defensible comps data without building it from scratch
- FAQ
- Sources
- Primary sources for verifying comps data and methodology
Core metrics and multiples in industry comps data
Most comps work rests on a handful of multiples, each suited to a different question. EV/EBITDA strips out capital structure differences and works well for capital-intensive sectors. P/E reflects equity value directly, so it only makes sense when you are comparing companies with similar leverage. EV/Sales helps when earnings are thin or negative, and revenue per employee or margin benchmarks round out an operational picture.
- EV/EBITDA: best for comparing operating performance across companies with different debt loads.
- P/E: useful for equity-level comparisons among similarly leveraged peers.
- EV/Sales: a fallback when EBITDA or earnings are negative or unstable.
- Revenue per employee and margins: operational benchmarks that reveal efficiency gaps peers’ headline multiples can hide.
Market conditions move these multiples constantly. As of January 2026, the total U.S. market excluding financials shows an average EV/Sales multiple of 3.46x, a figure that will look different six months from now, which is exactly why the measurement date belongs next to every multiple you cite.
Selecting a peer group: concrete criteria and filters
A defensible comps set starts with filters applied in a consistent order, not a loose list of “similar” companies.
- Industry classification: match NAICS or SIC codes as closely as the data allows.
- Size band: filter by revenue or market capitalization within a reasonable multiple of the target.
- Growth profile: separate high-growth names from mature ones; blending them skews multiples.
- Business model: a subscription company and a project-based firm rarely belong in the same set.
- Geography and fiscal period: align currency exposure and reporting calendars before comparing figures.
Primary peers should share most of these traits tightly; secondary peers can widen the set when the primary group is too small, but they need a noted caveat. Exclude distressed firms, companies mid-acquisition, or those reporting under different accounting frameworks, since each distorts a multiple in ways a median cannot fix on its own.
Pro Tip: Keep a short exclusion log noting which companies you dropped and why: it turns a judgment call into a documented decision.
Normalizing and adjusting peer data
Raw peer financials are rarely comparable as reported. Nonrecurring items, different fiscal year-ends, and varying capital structures all need adjustment before a multiple means anything.
- Strip one-time charges, gains, and restructuring costs from EBITDA and earnings.
- Rebase figures to a common fiscal period when peers close their books at different times.
- Convert equity multiples to enterprise-value multiples when leverage varies across the set.
- Exclude or flag negative-earnings companies rather than forcing a P/E that does not exist.
- Use medians or trimmed means instead of a simple average to reduce the influence of outliers.
Document every adjustment in a visible log. Analysts building peer sets from SEC filings typically compute enterprise-value multiples using consistent measurement dates and sources, which is the standard your own workpapers should match.
From multiples to an implied valuation: interpretation and sensitivity
Once the peer set is clean, applying a multiple is simply arithmetic, but the interpretation step is where judgment matters most.
- Take the peer median multiple (say, an EV/EBITDA of 8x) and apply it to the target’s adjusted EBITDA (say, $5 million), giving an implied enterprise value of $40 million.
- Build a range using the 25th and 75th percentile multiples instead of a single point estimate, since peer dispersion is almost always wide enough to matter.
- Adjust the implied value up or down based on specific features, like faster growth, customer concentration, or a stronger margin profile than the peer median.
A single number invites false precision. A range with a documented rationale for where the target sits within it survives scrutiny far better.
Mini-workflow: step-by-step example applying industry comps data
A compact workflow keeps the process repeatable across engagements.
- Set the objective and measurement date: decide whether this is a valuation, a benchmarking exercise, or competitor research, and lock the date you are pulling data as of.
- Build peer filters: apply industry, size, growth, and geography criteria from the selection step above.
- Collect and clean data: pull filings or report data, then normalize for nonrecurring items and fiscal timing.
- Compute medians and apply multiples: calculate the peer median EV/EBITDA and apply it to the target’s adjusted metric.
Illustrative example: if cleaned peer data shows a median EV/EBITDA of 7.5x and the target’s normalized EBITDA is $3 million, the implied enterprise value lands near $22.5 million before any premium or discount adjustment.
Pro Tip: Save the raw pull, the adjustment log, and the final calculation in one file: reviewers want to trace a number back to its source in minutes, not hours.
Making comps defensible: sample size, provenance, and methodology
A number without context invites questions. Damodaran’s methodology notes stress that sample size, currency handling, and inclusion choices all shape an industry average, and SEC filings consistently pair every multiple with a measurement date.
- Keep a source list naming where each peer figure came from.
- Retain the raw inputs, not just the computed ratios.
- Describe every adjustment in plain language a reviewer can follow without asking.
FASB’s Invitation to Comment on Financial KPIs signals growing attention to how metrics like EBITDA get defined and disclosed, which makes documented methodology more valuable, not less.
What busy practitioners should do next
The priority is simple: build a tight, defensible peer set first, document every adjustment as you make it, and present findings as ranges rather than single numbers. That discipline matters more than any single data source. From there, run the mini-workflow above on your next engagement and keep the adjustment log as a standing habit.
— Danny
Getting audit-defensible comps data without building it from scratch
Pulling and normalizing peer data by hand works, but it takes time most practitioners don’t have on a billable engagement. We built customizable industry financial performance reports covering over 9,000 markets, segmented by geography, size, and NAICS code, so you can get a granular benchmark set without assembling it filing by filing.

Industry financial performance and financial report products run $249 to $349 per report; the data is accepted in U.S. Tax Court and used by government agencies, which matters when a benchmark needs to hold up under review. For teams that need comps refreshed on a schedule, our market data API feeds directly into existing models. Start with our pricing page to find the report or feed that fits your next engagement.
This article is general information, not a substitute for advice from a qualified financial advisor. Consult a qualified financial professional about your own circumstances before acting on anything here.

FAQ
What does “comps” mean in investment banking?
In investment banking, “comps” refers to comparable company analysis, a relative valuation method that uses the financial metrics and trading multiples of similar public companies to estimate a target’s value. Analysts typically rely on SEC filings and market data as of a specific measurement date to build these comparisons.
What are examples of financial data used in comps analysis?
Financial data used in comps analysis includes revenue, EBITDA, net income, enterprise value, share price, and shares outstanding, which combine to form multiples like EV/EBITDA and P/E. These figures typically come from public filings, market data providers, or specialized industry reports.
What is an industry analysis?
An industry analysis examines the financial performance, competitive structure, and trends within a specific sector, often using peer benchmarks to assess where a company stands relative to others. It typically draws on metrics like margins, growth rates, and valuation multiples gathered from comparable companies.
What are the top valuation methods analysts use?
The three most common valuation methods are comparable company analysis (comps), discounted cash flow analysis, and precedent transaction analysis. Comps rely on current peer multiples, while discounted cash flow models a company’s projected cash flows, and precedent transactions look at prices paid in similar past deals.
How often should industry comps data be updated?
Industry comps data should be refreshed whenever market conditions shift meaningfully or at minimum each reporting quarter, since multiples like EV/Sales change as market averages move. Keeping a documented measurement date with each pull makes it easy to track when an update is due.
Sources
Three categories of sources cover most practitioner needs, and each comes with tradeoffs in cost, update frequency, and audit defensibility.
- Aswath Damodaran data files (valuation multiples, 2026)
- SEC filing example describing comparable company analysis
- FASB: Stakeholders invited to share views on financial key performance indicators
The tradeoff is predictable: free sources are broad but coarse, while commercial providers trade a price tag for granularity and documented methodology that holds up when a bank, court, or client asks how you got the number.
Primary sources for verifying comps data and methodology
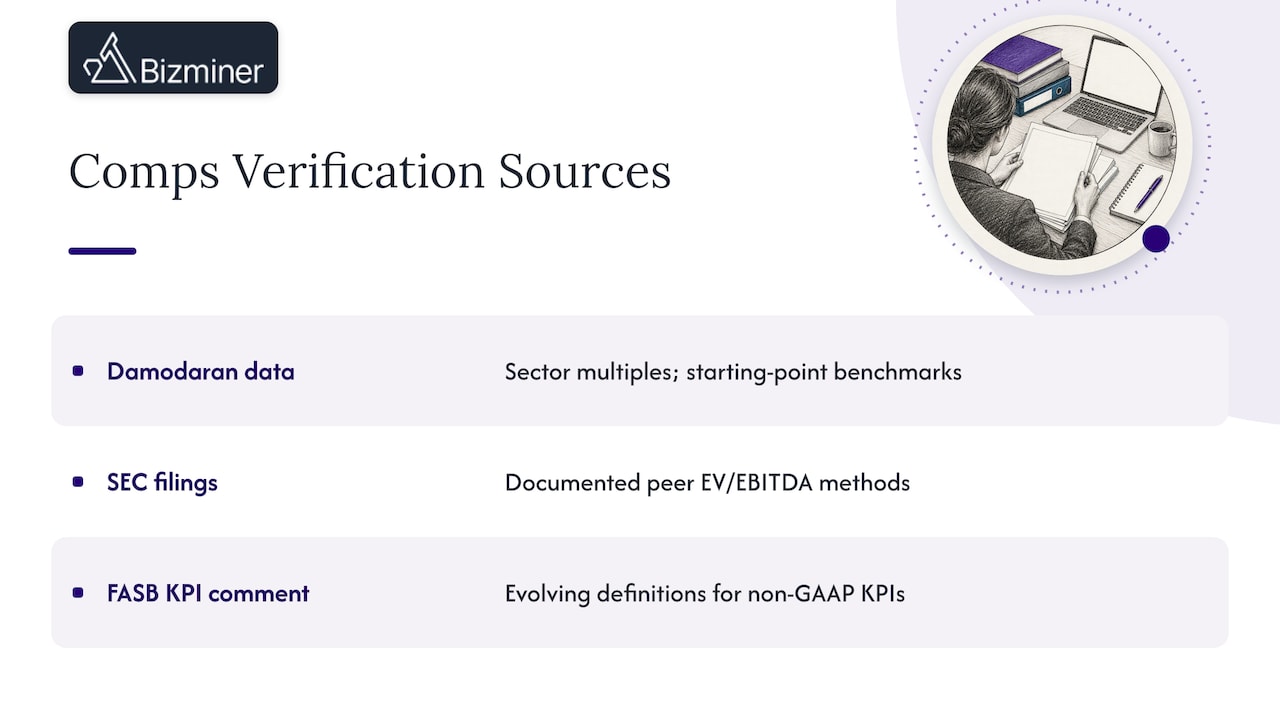
A few sources let you check the numbers and methodology behind any comps analysis directly. Damodaran’s data files publish current market multiples by sector, updated regularly, while his broader commentary explains how to treat those benchmarks as starting points rather than final answers.
SEC filings offer a second layer of verification. A representative filing exhibit shows exactly how banks tabulate peer EV/EBITDA multiples in real merger opinions, which is useful for seeing documented methodology in practice rather than in the abstract.
On the standards side, FASB’s Invitation to Comment on Financial KPIs is worth tracking if your work leans on non-GAAP metrics like adjusted EBITDA, since clearer definitions are likely to affect how benchmarking reports present those figures going forward.
For readers building out a broader benchmarking practice beyond company comps, this guide to portfolio benchmarking covers techniques for constructing reference benchmarks across asset types. And when you need a practical gateway to pull granular, customizable industry reports directly, our valuation multiples reference guide is a useful starting point.