
Market data for due diligence is the evidence that turns conviction into a defensible valuation: a triangulated TAM/SAM/SOM, a growth trajectory, customer unit economics such as LTV/CAC and churn, and competitive concentration measured with the Herfindahl-Hirschman Index. Check private claims against public baselines from the Economic Census and QCEW. Then convert every finding into a valuation input or a deal term.
TL;DR:
- Build TAM, SAM, and SOM with at least two independent methods, reconcile scope gaps, and choose the central case using the most verifiable evidence.
- Reconcile customer revenue to the general ledger, then test cohorts, contracts, deposits, concentration, and customer references before relying on retention or lifetime value estimates.
- Sum squared percentage point market shares; an HHI above 1,800 or a merger increase above 100 points signals competitive risk, but regulators also weigh other evidence.
- Separate market growth, share gains, pricing, and churn in valuation sensitivities, then tie disputed assumptions to price adjustments, holdbacks, or achievable earnout milestones.
- Test private market claims against Economic Census and QCEW baselines; QCEW’s quarterly updates provide fresher employment, establishment, and wage trends between census releases.
Table of Contents
- Why market data decides go or no-go
- Which market metrics deal teams should request first
- Sizing the market: top-down, bottom-up and demand-side builds
- Customer evidence: what to request, how to validate it, what to flag
- Competitive structure, HHI and what regulators look at
- Turning market evidence into valuation inputs
- A market-data checklist and timeline for the deal team
- How our data supports each checklist step
- Combining qualitative evidence with market numbers
- Tailoring market data reports to the deal at hand
- Using visuals and dashboards to carry the diligence story
- What case studies of market-driven diligence teach
- Deal-team perspective: where diligence goes wrong
- How we can help your deal team
- FAQ
- Sources
Why market data decides go or no-go
Market evidence does a different job at each decision point in a deal. At the screening stage it tells you whether the opportunity is large enough to matter. At the valuation stage it sets the growth curve, the share ramp and the margin envelope you feed into a model. At the structuring stage it tells you which risks belong in price, in an earnout or in a walk-away condition. After signing, it shapes integration plans, because a market that is shrinking calls for a different integration plan than one that is expanding.
The evidence changes the shape of the revenue bridge as well as its size. A management bridge that attributes next year’s growth to “market expansion” is only credible if an outside baseline supports it. Investors tend to push diligence quickly past aggregate market size toward granular revenue bridges that split performance by customer segment, churn and pipeline, as industry transaction disclosures show. Market data is only useful when you map it onto the operating reality of the target.
Market data is decisive in a few recurring situations:
- Small addressable markets: if the SAM barely exceeds the target’s current revenue, the growth story depends on share gains that rarely materialize.
- Rapid decline or disruption: a shrinking category or a new entrant with a different cost structure can invalidate a historical growth rate.
- Concentrated competition: when two or three rivals hold most of the market, pricing power and customer switching become the central questions.
- Rolled-up or fragmented industries: the gap between a target’s share and the market leader’s share defines how much consolidation upside is realistic.
Internal metrics dominate in other situations. A mature subscription business with stable cohorts and long contracts is better judged on its retention tables than on a market memo. Market data then plays a supporting role: it confirms the ceiling, not the trajectory.
Plan for market evidence to appear in several deliverables: the market memo (the verdict and the reasons), the databook (reconciled market-size evidence with sources), the quality-of-earnings bridge (where market assumptions meet reported results), and the sensitivity cases that show what happens to value when the market behaves differently than the base case. If a deliverable contains a growth assumption without a market reference, it is incomplete.
Which market metrics deal teams should request first
Define each metric tightly before you collect it, because loose definitions are where diligence arguments start.
- TAM (total addressable market): annual revenue available if every potential buyer of the category purchased from you. In a deal timeframe, anchor it to an official industry revenue figure and state the NAICS scope.
- SAM (serviceable addressable market): the portion of TAM the target can actually reach given its product, geography, channel and price point.
- SOM (serviceable obtainable market): the share of SAM the target can realistically win in the forecast period, tied to its capacity and sales motion.
- CAGR and penetration: growth rate of the market and the percentage of potential customers already served. A high penetration rate with slowing CAGR signals saturation.
- Unit economics: ARPA (average revenue per account), gross margin contribution, LTV/CAC, net revenue retention and cohort churn. These show whether each new customer adds or destroys value.
Separate lead indicators from lagging ones. Pipeline coverage, new-logo win rates, pricing changes and establishment openings lead. Reported revenue, headcount and market share lag, sometimes by a full year. Teams get misled when they extrapolate a lagging figure as if it were a forecast.
The common misreads are consistent. Aggregate growth hides cohort decay. A strong LTV/CAC computed on a handful of early, hand-sold customers does not describe the next thousand. And a SOM built top-down from a percentage of TAM is an assumption, not evidence, unless a bottom-up build supports it.
Investors consistently weigh these ratios over headline growth because they expose whether the model is sustainable. As the same disclosure review notes, revenue bridges and unit economics such as LTV/CAC and net retention matter more than aggregate growth alone, because they reveal how durable the business model really is.
Sizing the market: top-down, bottom-up and demand-side builds
No single sizing method survives scrutiny on its own. Build at least two independently and reconcile them.
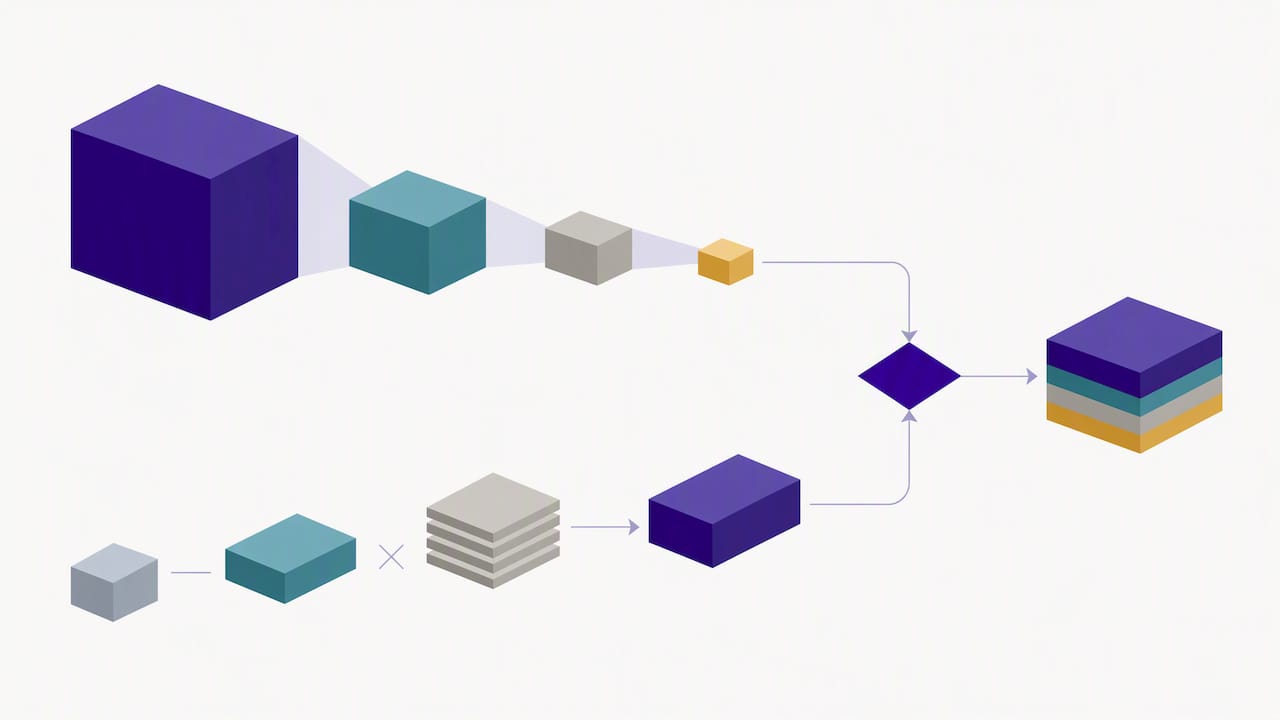
Top-down. Start with industry revenue from the Economic Census for the relevant NAICS codes. Narrow it to the serviceable segment by removing geographies, customer types and price tiers the target does not serve. Then apply a penetration assumption that you can defend with an observable analog: the share a comparable company reached in a comparable period, not a round percentage.
Bottom-up. Start from verified facts about the target: customer counts, average price, usage rates and contract terms. Multiply out to a revenue figure for the next period, then extend the logic using the number of reachable prospects. Prospect lists help here, because a count of qualified accounts in the serviceable segment gives you a ceiling that does not depend on anyone’s top-down percentage.
Demand-side and supply-side builds. A demand build estimates how many buyers need the product and how often they purchase. A supply build sums the capacity or revenue of the known competitors. When the two disagree sharply, the gap usually points to an unmeasured segment or an overstated competitor.
A sequence that fits a deal timeline:
- Define the market boundary in writing, with NAICS codes, geography and customer type.
- Build the top-down TAM and SAM from official revenue data.
- Build the bottom-up SOM from customer, price and capacity facts.
- Build one demand-side or supply-side cross-check.
- Compare the three results, explain each gap, and pick a central case with a stated rationale.
Triangulation rules matter more than the arithmetic:
- Expect the methods to differ. Treat agreement within a modest band as confirmation and a wide gap as a diligence finding, not a rounding problem.
- When a gap appears, investigate the definitions first. Mismatched scope between the methods causes more variance than bad data does.
- Choose the central case on the most verifiable method, not the most flattering one, and show the others as the range.
- Keep every assumption in a formula-driven model. Data-room requests should include formula-driven Excel models rather than PDFs so analysts can run sensitivity tests on growth assumptions and reconciliations.
A sizing that cannot be flexed in a spreadsheet is a narrative. A sizing that can be flexed, with every input sourced, is evidence.
Customer evidence: what to request, how to validate it, what to flag
Customer data is where market claims either become real or fall apart. Ask for the following early, because the target needs time to assemble it:
- A complete customer list with revenue by customer for at least three years
- Cohort tables showing retention and expansion by signup period
- Contract terms, renewal dates, termination rights and pricing escalators
- Concentration metrics: revenue share of the top one, five and ten customers
- Win and loss records with reasons, and the pipeline by stage
Management’s exhibits are claims until cross-checked. Compare the customer list against accounts receivable and payable aging, trace a sample of revenue to bank deposits, read a sample of signed contracts, and speak to a handful of customers directly. Customer reference calls are also where the qualitative signals appear: whether customers would be upset to lose the product, and whether they would pay more for it. Insist on working Excel models with live formulas, not static PDFs, so you can change retention or pricing and watch the output move.
Pro Tip: Ask for revenue by customer reconciled to the general ledger before you read anything else. If the two do not tie, every downstream metric is suspect.
Red flags to watch for:
- One customer or a small group accounting for a large share of revenue
- Cohorts that look healthy in aggregate but decay within each vintage
- Renewals clustered in a single quarter
- Revenue recognized ahead of delivery or contract signature
- Discounting that rises as the sales cycle lengthens
Segmentation also feeds the go-to-market assumptions in your model. If the target’s best customers sit in one segment and one geography, a plan that assumes uniform national expansion is unsupported. Map each segment’s retention, price and acquisition cost, then ramp market share segment by segment. A ramp that follows observed sales capacity is believable. A ramp that follows a straight line to a target percentage is a wish.
Competitive structure, HHI and what regulators look at
Concentration tells you how much pricing power exists and how much antitrust scrutiny a deal may draw. The standard tool is the Herfindahl-Hirschman Index: square each firm’s market share (in percentage points) and sum the results. A monopoly scores 10,000.
Under the 2023 Merger Guidelines, the agencies examine market structure, barriers to entry and multiple analytical frameworks, and they may focus on whichever frameworks are most relevant to the industry. Concentration thresholds are one input among several.
Markets with an HHI above 1,800 are treated as highly concentrated, and a merger-driven increase of more than 100 points is a significant signal of competitive risk under Guideline 1, which describes a presumption of concern absent convincing rebuttal evidence.
Choose your share proxy deliberately. The agencies explain that market shares can be measured with revenues, unit sales, number of users or capacity, and the choice should reflect the competitive realities of the market. Revenue suits differentiated products with varied prices. Units suit commodity goods. Customer counts or capacity may suit services where contracts differ widely in size.
Collect the qualitative evidence that confirms or rebuts what the numbers say:
- Recent entry and exit events, including who failed and why
- Switching costs: contract lock-in, integration effort, retraining and data migration
- Barriers to entry such as sunk costs, licensing and regulatory requirements
- Whether customers can credibly substitute another product
Market share is a snapshot. Regulators examine customer substitution and switching costs to judge whether customers are actually locked in, and practitioners watch barriers to entry and recent entry or exit because historical shares can mislead when competitive dynamics are shifting fast. If your target operates across borders, consider the legal side early: this guide to merging with or acquiring an Israeli company shows the kind of jurisdiction-specific timing and approval issues that can slow a closing.
Turning market evidence into valuation inputs
Market data feeds a valuation through a short list of inputs:
- Growth curve: the central-case market CAGR, applied to the segments the target serves, fading toward a long-run rate
- Share ramp: the path from current share to the SOM, tied to sales capacity and observed win rates
- Pricing envelope: the range of realistic prices given competitor offerings and switching costs
- Margin envelope: gross and contribution margins consistent with peer ranges and wage benchmarks
- Terminal assumptions: whether the market can support the share and margin at the end of the forecast
Design the revenue bridge so market risk and execution risk are visible separately. One bar shows what happens if the market grows at the central case and the target holds share. A second shows the effect of gaining or losing share. A third isolates pricing. When an investment committee sees these split, it can decide whether it is buying the market, the management team or both.
At a constant revenue multiple, enterprise value falls by 20%. A one-point share change moves value as much as a sizable change in the discount rate, which is why share ramp deserves its own sensitivity table.
Present sensitivities as a grid of market growth against share outcome, with the base case marked and the walk-away threshold shaded. Then state in one sentence what each corner of the grid means for price or structure. A grid with no stated decision attached is a chart, not a recommendation.
A market-data checklist and timeline for the deal team
Run the work in a fixed order so that the highest-value evidence arrives first. This is a sample cadence; compress or stretch it to fit the data room.
- Market-size sources. Commercial lead requests the target’s cited market studies and builds an independent NAICS-based baseline from the Economic Census and QCEW.
- Customer roster with revenue. Finance analyst requests the customer revenue file and reconciles it to the general ledger.
- Cohort tables and pricing lists. Commercial analyst requests retention cohorts, current and historical price lists, and discount records.
- Competitor revenue proxies. Analyst assembles share estimates by revenue, units or customers, and computes HHI for the relevant market.
- Documented assumptions and formula-driven models. Deal lead requires every forecast driver in a live Excel model with source notes.
- Bottom-up validation. Analyst builds the SOM from verified customers and prospect counts, then reconciles it with the top-down figure.
- Customer calls and cross-checks. Commercial lead completes reference calls and ties a sample of revenue to bank deposits and contracts.
- Sensitivity scenarios. Valuation lead finalizes base, upside and downside cases and the market-versus-execution bridge.
The minimum defensible output is short: a one-page market memo with the verdict and the evidence, a databook with reconciled market-size sources and every figure traceable, and sensitivity scenarios tied to valuation. If time runs out, protect those three. Our own market data due diligence checklist lays out the same request items in a form you can adapt to your data room.
How our data supports each checklist step
We offer customizable market and company reports, prospect lists and an API feed across markets segmented by industry, geography and company size. Our data is used in business valuation, and we state that it is accepted in U.S. Tax Court and used by government agencies. Reports list their sources and sample sizes, which helps when you need to show an investment committee exactly where a benchmark came from.
How our products map to the checklist:
- Market Report and Industry Financial Performance support the TAM, SAM and SOM work and the margin and pricing envelopes. The Market Report is $349 per report and Industry Financial Performance is $249 per report, per our pricing page.
- Company Report supports customer and competitor checks, including revenue and financial profiles of rivals.
- Prospect Lists support bottom-up validation by counting reachable accounts in the serviceable segment.
- API feed lets the deal team refresh databooks automatically instead of re-pulling tables by hand.
Sample exhibits that fit a databook include an industry benchmark page for the target’s NAICS code, a competitor financial profile set and a prospect count by geography and size band. Our industry pages show how an industry-level view is laid out, so you can judge whether the format suits your memo.
Combining qualitative evidence with market numbers
Numbers describe the market. Qualitative evidence explains whether the target can capture it. Practitioner summaries of SEC filings note that the most effective diligence goes beyond financial audits to include customer attachment, defensibility of market position and sustainability of unit economics, and these factors often determine deal outcomes.
The practical method is to attach a qualitative finding to every quantitative claim. If the model assumes strong gross retention, the customer calls should say why customers stay. If the market memo shows a fragmented competitor set, interviews with former employees and channel partners should explain whether that fragmentation is stable or about to consolidate. Where the two disagree, trust neither until you find the reason. A retention rate that looks strong while customers describe the product as replaceable is a warning that the number is a lagging indicator of a loyalty that has already eroded.
Structure the qualitative work so it can be compared. Use the same short interview guide for every customer and channel contact, score the answers on a fixed scale, and record verbatim quotes next to the score. Group findings by the same segments used in the cohort tables. A quote that explains why one segment churns, sitting directly beside that segment’s churn rate, is more persuasive in an investment committee than a page of either on its own.
Document what you could not verify. A short list of open questions, each tied to the valuation line it affects, gives the committee an honest sense of residual risk and gives the negotiation team specific protections to ask for.
Tailoring market data reports to the deal at hand
A generic industry report rarely answers a specific deal question. Customize it by scope, size band, geography and time.
- Scope: choose the NAICS codes that match the target’s actual revenue mix, not the code on its tax filing. A target that earns revenue in three activities needs three scoped views.
- Size band: benchmark the target against companies of similar revenue. A small operator compared with industry-wide averages dominated by large firms will look worse than it is.
- Geography: adjust for the regions where the target sells. A national average hides local competition, wage levels and demand patterns.
- Time: include enough years to cover a full cycle so that a strong or weak recent year does not distort the baseline.
Context changes what matters most. In a growth equity deal, tailor toward market growth, penetration and customer acquisition economics. In a carve-out or roll-up, tailor toward fragmentation, peer margins and the cost-to-serve differences between segments. In a distressed purchase, tailor toward the downside: peer leverage, failure rates and the speed at which capacity leaves the market.
Our custom analysis reports are built around this kind of filtering, with industry, geography and company size as the main levers. Whatever source you use, specify the filters in the request and write them into the databook, so a reader can tell exactly what population each benchmark describes. A benchmark without its filters is not reproducible, and a number that cannot be reproduced does not belong in a valuation.
Using visuals and dashboards to carry the diligence story
A good chart shortens the path from evidence to decision. A poor one hides the assumption that matters. Choose a small set of visuals and make each answer one question.
- Market-size reconciliation chart: top-down, bottom-up and demand-side estimates side by side, with the chosen central case marked. It answers whether the methods agree.
- Cohort retention heat map: vintages down the side, months across the top. It shows at a glance whether newer customers behave like older ones.
- Concentration view: customer revenue share as a ranked bar, and competitor share with the HHI printed beside it.
- Revenue bridge waterfall: market growth, share change, price and churn as separate steps, so the committee sees where the forecast comes from.
- Sensitivity grid: market growth against share outcome, with the walk-away line visible.
A dashboard earns its place when it is built on the same live model as the databook, so a changed assumption updates every view at once. A static screenshot of last week’s numbers invites argument about which version is current. Label units and sources on every chart, state the date of the data, and keep the color scheme consistent so that the same segment has the same color on every page. Avoid decorative charts. If a visual does not change what the committee would decide, cut it and use a sentence instead.
For an automated refresh, an API feed into the databook keeps benchmark panels current without manual re-pulls, which matters when the data room runs for weeks and the market keeps moving.
What case studies of market-driven diligence teach
This article cites no named client case studies, and we will not invent any. Instead, here are the patterns that documented diligence work and regulatory guidance describe, which you can test against your own deals.
Pattern one: the market ceiling. A buyer’s forecast assumed continued share gains. A top-down check against official industry revenue showed that the target’s planned revenue would exceed a realistic share of its serviceable market within a few years. The finding did not kill the deal; it moved the price and shifted part of the consideration into an earnout tied to the share milestones management had promised.
Pattern two: the cohort surprise. Aggregate retention looked excellent. Cohort tables revealed that retention in recent vintages was materially worse, concealed by a long tail of loyal early customers. Reframing the model on recent cohorts changed the lifetime value assumption and the acquisition spend the buyer was willing to underwrite.
Pattern three: the concentration problem. A merger between two firms looked attractive on cost synergies. An HHI calculation on a revenue-share basis showed that the combined firm would cross the concentration thresholds described in the Merger Guidelines. Early recognition let the parties plan for a longer review and consider remedies instead of discovering the issue after signing.
In each pattern the market data did not produce the decision. It reframed a question the deal team could then answer with evidence. When you write your own case notes after a deal, record the assumption the data challenged, the exhibit that did the challenging and the term that changed as a result. That log becomes the most useful training material your team owns.
Deal-team perspective: where diligence goes wrong
Most failed diligence is not a shortage of data. It is misplaced trust. The three traps I see most are accepting a top-line growth rate nobody has validated against an outside baseline, glossing over customer concentration because the largest customer “has been with them forever,” and accepting static PDFs in place of working models, which makes honest sensitivity testing impossible.
My stance: market data is a negotiation tool as much as a valuation tool. A defensible finding that the market supports less share than management projects gives you a concrete reason to restructure price, not just a feeling that the number is high.
- Reconcile revenue by customer to the ledger before reading any market analysis.
- Build the SOM bottom-up first, then see whether the top-down view agrees.
- Convert every disputed assumption into a term: a price adjustment, a holdback or an earnout.
Pro Tip: Tie earnouts to market-share or retention milestones that your own data says are achievable but management’s plan treats as certain. If management believes the plan, the earnout costs them nothing.
— Danny
How we can help your deal team

If your checklist needs market evidence quickly, we built our reports for exactly that job. Our Market Report and Industry Financial Performance reports give you benchmarks for sizing and margins. Our Company Report covers customer and competitor checks, and our prospect lists support bottom-up validation. For automated databooks, we offer a customizable API feed. Pricing for each report is on our pricing page.
- Review our market data due diligence checklist and adapt it to your data room
- Request a custom databook through our custom report page
- Build a bottom-up account count with our prospect list builder
Tell us the NAICS codes, geography and size band for your target, and we will show you which reports fit.
This article is general information, not a substitute for advice from a qualified financial advisor. Consult a qualified financial professional about your own circumstances before acting on anything here.
FAQ
What is due diligence for a company?
Due diligence is the structured investigation a buyer or investor runs before closing a deal, covering financial, commercial, legal and operational facts. Its purpose is to confirm what the seller has claimed and to find risks that should change price or terms. Commercial due diligence focuses on the market, customers and competition.
How do I analyze market data in a deal?
Define the market boundary first, then build the size from at least two independent methods and reconcile the gap. Test private claims against public baselines such as the Economic Census, then convert findings into growth, share and margin inputs with sensitivity tables.
Who pays for due diligence?
Each side typically pays its own advisers and internal costs, and the buyer bears most of the work because the buyer is the party verifying. Who funds particular third-party reports is a matter of negotiation, and the answer can differ by deal and by agreement.
What is the legal definition of due diligence?
There is no single legal definition that applies across contexts, and the meaning depends on the statute, contract or standard in question. In a transaction it generally refers to the reasonable investigation a party performs before relying on information. For a specific legal obligation, consult the governing statute or a qualified attorney.
Sources
Public data will not replace private evidence, but it gives you an independent baseline to test private claims against. Public sources provide useful independent baselines.
The Economic Census is the official five-year benchmark for business and industry data. It reports establishment counts, employment, payroll and revenue by 6-digit NAICS code, and it covers eighteen in-scope sectors. The industry tables are available in formatted layouts with xls, csv and ZIP downloads, and full datasets are available over FTP, so you can query by NAICS code and geography.
The BLS Quarterly Census of Employment and Wages fills the gap between census years. It is updated quarterly, covers over 95 percent of U.S. jobs, and reports employment, establishments and wages. Use it to see whether a market is adding or losing establishments and whether wage pressure is building.
A repeatable workflow looks like this:
- Justice
Pro Tip: Save the exact query parameters next to every extract. When an investment committee member asks where a number came from, a reproducible pull ends the discussion in one slide.
Census and BLS outputs are baselines, not answers. Combine them with private datapoints, such as management’s customer data and pricing, to get a current view. Seek paid or privileged sources when NAICS definitions are too coarse for the niche, when you need company-level financials, or when you need data fresher than the latest census year. For labor-cost assumptions in margin work, our guide to BLS average wages by industry shows how to turn raw wage series into defensible benchmarks, and for regional adjustments our walkthrough of location quotient analysis explains when a regional concentration ratio changes the picture.