The single most useful cash flow benchmark is the cash conversion cycle, or CCC, and the fastest path to better cash performance is comparing your CCC to industry quartiles rather than a single average. Cash flow benchmarks are the reference ranges that show how your collections, inventory and payables stack up against peers. Compute your CCC, pull your sector’s quartile data, and run a gap analysis before touching a single process.
TL;DR:
- Calculate CCC as DIO plus DSO minus DPO, and use trailing twelve month figures with rolling three month averages to separate seasonality from emerging trends.
- Hackett’s top 1,000 U.S. public nonfinancial companies averaged a CCC of 37 days; top quartile firms beat median performers on DSO by 18 days.
- Prioritize the weakest component: address excess inventory when DIO drives the gap, collections when DSO leads, and avoid relying on stretched supplier terms.
- Set 90, 180, and 365 day milestones; collections changes can shift DSO within a quarter, while inventory improvements often take two to three quarters.
- Use a precise NAICS peer set and account for size and business model, because smaller firms often have higher CCCs than larger companies in the same sector.
Table of Contents
- 1. Core Cash Flow Metrics and the Formulas Behind Them
- 2. What Good Cash Conversion Cycles Look Like by Industry
- 3. Turning Benchmark Gaps Into a Prioritized Action List
- 4. Setting Realistic Targets and Tracking the Right KPIs
- 5. How to Apply Granular Industry Benchmarks in Practice
- 6. Where Cash Flow Benchmarks Fall Short
- 7. Author Perspective: What Actually Moves the Needle
- How We Help You Benchmark With Confidence
- FAQ
- Sources
1. Core Cash Flow Metrics and the Formulas Behind Them
Before comparing yourself to anyone, you need the four numbers that drive the comparison. These calculations form the backbone of almost every cash flow benchmark you will encounter.
- DSO (Days Sales Outstanding): (Accounts Receivable ÷ Total Credit Sales) × Number of Days
- DIO (Days Inventory Outstanding): (Average Inventory ÷ Cost of Goods Sold) × Number of Days
- DPO (Days Payable Outstanding): (Accounts Payable ÷ Cost of Goods Sold) × Number of Days
- CCC (Cash Conversion Cycle): DIO + DSO minus DPO
A shorter CCC means cash returns to the business faster. Free cash flow margin (free cash flow divided by revenue) and operating cash flow as a percentage of revenue serve as complementary checks, since a company can improve its CCC while still generating weak absolute cash if margins are thin.
For measurement, use trailing twelve months (TTM) figures to smooth out seasonality, and pair them with rolling three-month averages when you need to spot a trend forming before it shows up in the annual number. Monthly tracking catches problems early; TTM tracking tells you whether the fix is actually working.
2. What Good Cash Conversion Cycles Look Like by Industry
A single “good” CCC number does not exist. Deloitte recommends benchmarking to quartiles within your own industry rather than chasing a universal target, because a 20-day CCC is unremarkable for a software business and exceptional for a manufacturer carrying raw materials and finished goods inventory.
- Software and services businesses often post CCCs near zero or negative, since subscription billing collects cash before costs are incurred.
- Retailers typically sit in a moderate range, driven mostly by inventory turns rather than receivables.
- Manufacturers tend to run the longest cycles, with inventory and extended receivables terms both adding days.
The gap between top performers and the median is often the most instructive number of all. The Hackett Group’s 2025 Working Capital Survey found an average CCC of 37 days among the top 1,000 U.S. publicly traded nonfinancial companies, with an 18-day DSO gap separating top-quartile and median performers. That gap alone represents a meaningful share of the $1.7 trillion the survey estimates is trapped in excess working capital across these companies.
Interquartile ranges within a single sector can be wide, which is why choosing the correct NAICS peer set matters more than finding a single textbook target. A company benchmarked against the wrong peer group will chase a number that was never realistic to begin with.
3. Turning Benchmark Gaps Into a Prioritized Action List
Once you know where you sit against your peer quartiles, the real work is deciding what to fix first.
- Compute your CCC and place it against your industry’s median and top-quartile figures.
- Decompose the gap into its DSO, DIO and DPO components to see which lever is doing the most damage.
- Root-cause each component: check receivables aging for collection slippage, inventory turns for overstock or dead stock, and supplier terms for unused negotiating room.
- Prioritize durable fixes over fragile ones. Research on working capital improvement shows that inventory optimization tends to produce more sustainable cash gains than stretching supplier payment terms, which can strain vendor relationships and quietly erode goodwill.
A company with a large DIO gap and a small DSO gap should start in the warehouse, not the collections department. A company with the reverse pattern should tighten credit terms and dunning cadence before touching inventory at all.
Pro Tip: Run the diagnostic on a rolling basis, not just once a year. A quartile gap that looks minor in January can compound into a cash shortfall by the third quarter if the root cause goes unaddressed.
4. Setting Realistic Targets and Tracking the Right KPIs
Benchmarks are only useful once they become targets with deadlines attached. A practical framework sets milestones at 90, 180 and 365 days, aiming to close a defined share of the gap to the next quartile at each checkpoint rather than demanding an overnight fix.
- 90 days: Validate root causes and launch the first operational change, typically in collections or inventory.
- 180 days: Measure the first meaningful shift in DSO or DIO and adjust the plan based on what moved.
- 365 days: Reassess your position against the current quartile data, since peer benchmarks shift year to year.
Track CCC, DSO, DIO, DPO, free cash flow margin and operating cash flow as a percentage of revenue monthly, and report the full set quarterly to leadership. Improvement magnitudes vary by lever: inventory fixes often take two to three quarters to show up fully, while collections process changes can move DSO within a single quarter if aging and dunning get real attention.
5. How to Apply Granular Industry Benchmarks in Practice
Generic averages rarely hold up under scrutiny from a lender, a board, or opposing counsel. That is where granular, NAICS-level data earns its keep.
- Granular coverage across more than 9,000 markets lets you match your exact NAICS code instead of settling for a broad sector average.
- Court-accepted data means our benchmarks have been accepted in U.S. Tax Court, which matters when a cash flow analysis needs to survive outside scrutiny.
- Customizable reporting lets you export the peer set, sample size and period alongside the numbers, so the benchmark carries its own provenance.
A practical workflow looks like this: pick the precise NAICS code, pull the median and quartile figures for CCC and its components, reconcile any differences caused by accounting policy or seasonality, then run the gap analysis described above and export the report for a client meeting or audit defense.
Accountants, business advisors and corporate finance teams use this same sequence to spot cash traps, build forecasting assumptions, and support valuation work with a peer set that holds up to review.
Our NAICS-level working capital benchmarks are built for exactly this kind of defensible comparison.
6. Where Cash Flow Benchmarks Fall Short
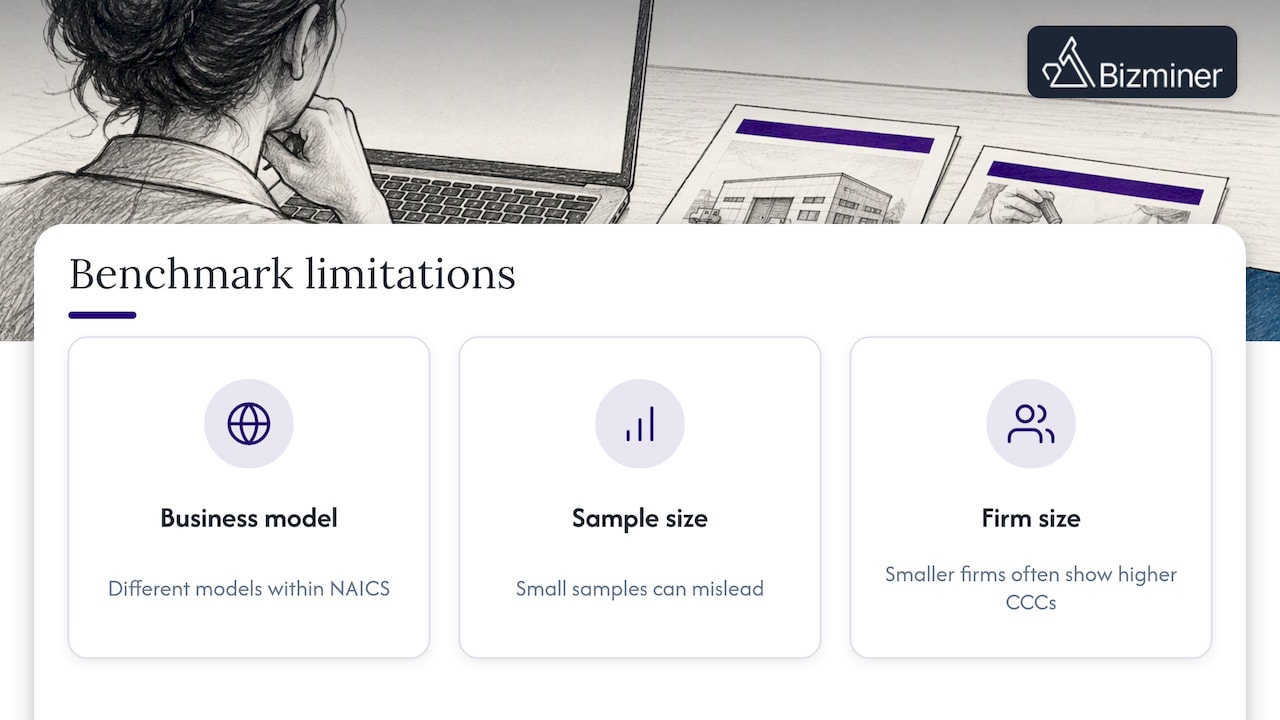
Benchmarks tell you where you stand, not why you got there. A company with a CCC above the median is not automatically mismanaged. It might be a deliberate strategy, such as offering longer payment terms to win larger contracts, or a temporary state tied to a recent product launch that is still working through inventory.
Industry classification itself is a limitation. Two companies sharing a NAICS code can have meaningfully different business models, customer mixes or geographic footprints, and a benchmark built on too small a sample can mislead rather than inform. KPMG’s sector analyses note that smaller companies typically report higher CCCs than large firms in the same sector, which means a small business should weight its comparison accordingly rather than measuring itself against enterprise peers.
Timing matters too. Benchmarks reflect a specific period, and working capital trends can shift with interest rates, supply chain conditions or demand cycles. A quartile figure pulled during a period of unusual supplier friction may not represent a normal year.
Finally, a benchmark is a diagnostic starting point, not a verdict. The gap analysis still requires a root-cause check before any lever gets pulled, since the same DSO gap can stem from weak credit policy in one company and a single large disputed invoice in another.
7. Author Perspective: What Actually Moves the Needle
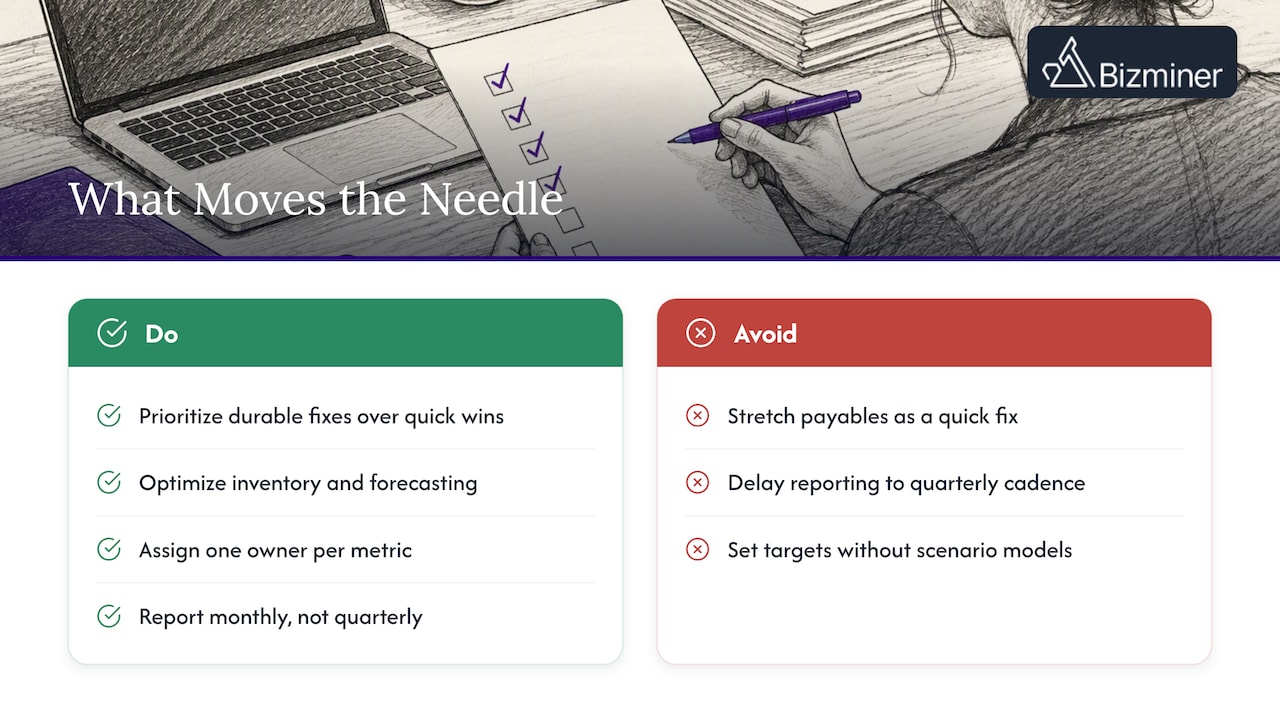
The benchmarking exercise is easy. The follow-through is where most teams lose the thread. I favor durable fixes, inventory optimization and better forecasting, over the quick win of stretching payables, because the quick win tends to create supplier friction that costs more than it saves within a year or two.
Assign one owner per metric with a monthly reporting cadence, not a quarterly one, so a slipping DSO gets caught before it becomes a quarter-end surprise. Pair every target with a scenario model that stress-tests a demand drop or a supplier term change, so the plan survives contact with reality instead of just looking good on a slide.
— Danny
How We Help You Benchmark With Confidence
We built our platform around the exact workflow finance professionals need: granular, NAICS-specific data instead of broad sector guesses. Our Industry Financial Performance report gives you median and quartile figures for your precise peer set, and our custom analysis reports let you export provenance details for a board, a lender or an audit.

- Pull a sample industry report to see your sector’s CCC, DSO, DIO and DPO quartiles.
- Request a custom report when you need a peer set tailored to a specific geography or revenue band.
- Add Tier prospect lists when your benchmarking work turns into client acquisition.
Visit our pricing page to see current report pricing and get your NAICS-specific numbers today.
FAQ
What are good cash flow ratios?
A good cash flow ratio depends on your industry and where you sit against peer quartiles rather than a fixed universal number. Deloitte recommends targeting the top quartile within your specific sector, since a strong CCC in software looks very different from a strong CCC in manufacturing.
What are five rules of cash flow?
While there is no single official list, consistent practitioner guidance points to monitoring receivables aging closely, managing inventory turns actively, negotiating payables terms without straining supplier relationships, forecasting cash on a rolling basis, and measuring actuals against projections regularly. The FDIC’s cash management guidance emphasizes this pairing of actual results with ongoing projections as a core discipline.
What are the three types of cash flow?
The three types are operating cash flow, investing cash flow and financing cash flow, each reported separately on the cash flow statement. Operating cash flow reflects core business activity, investing cash flow covers asset purchases and sales, and financing cash flow captures debt and equity transactions.
What are the top financial KPIs for businesses?
The core set includes the cash conversion cycle, DSO, DIO, DPO, free cash flow margin and operating cash flow as a percentage of revenue. Research on cash flow measures shows free cash margin varies materially by industry, which is why these KPIs are most useful when tracked against a relevant peer set rather than in isolation.
Sources
- The Hackett Group 2025 Working Capital Survey: Payables Rebound, but Receivables and Inventory Lag
- Working capital management report — Deloitte US
- Cash-days analysis and working capital tools — PMC article