CECL industry data means the combination of internal loan-level history, macroeconomic forecasts, and external benchmarks that a U.S. bank or credit union needs to produce a defensible allowance for credit losses under ASU 2016-13. The standard requires lifetime expected-loss estimates, not the old incurred-loss trigger, which forces institutions to pair their own historical charge-off data with reasonable and supportable forecasts, industry reserve-coverage benchmarks, and, for smaller entities, tools like the NCUA’s Simplified CECL Tool.
TL;DR:
- The reserve coverage ratio declined to 178.4% in the third quarter of 2025, signaling faster growth in noncurrent loans compared to reserves industry-wide.
- Benchmarking against peer data requires segmentation by asset size, geography, loan type, and charter to produce meaningful comparisons for model validation.
- Small institutions under $100 million in assets can use the NCUA’s WARM-based Simplified CECL Tool, but should recalibrate it regularly based on internal loss experience.
- Institutions must retain detailed loan-level data, including origination, charge-offs, collateral valuation, and vintage details, to support accurate lifetime loss estimates.
- Examiners focus on data traceability, segmentation rationale, forecast inputs, qualitative overlays, and validation evidence, regardless of model complexity.
Table of Contents
- What CECL Requires Under U.S. GAAP and Where Allowances Get Reported
- Industry Data and Benchmarks That Contextualize CECL Outputs
- Data Requirements and Retention for Lifetime Loss Estimates
- Estimation Methods: Which One Fits Your Portfolio
- The NCUA Simplified CECL Tool and WARM for Smaller Institutions
- Regulatory Guidance and What Examiners Actually Check
- A Practical Implementation Checklist for Data, Systems, and Governance
- How Granular Industry Data Strengthens CECL Model Defensibility
- Author Perspective: Pragmatic Trade-Offs in CECL Implementation
- How Bizminer Helps: Industry Benchmarks and Custom Reports for CECL Models
- Sources
- FAQ
What CECL Requires Under U.S. GAAP and Where Allowances Get Reported
CECL replaced the incurred-loss model with a forward-looking one. Under ASU 2016-13 / Topic 326, institutions must estimate expected credit losses over the full contractual life of a financial asset, not just losses already incurred. That single change reshaped model design, data pipelines, and audit trails across the entire industry.
The measurement objective sounds simple: combine historical loss experience, current conditions, and a reasonable and supportable forecast into one number. Executing it is not simple, because the standard demands documentation for every judgment call embedded in that number.
CECL’s scope covers more than traditional loans. It applies to:
- Loans and leases held for investment, carried at amortized cost
- Held-to-maturity debt securities
- Off-balance-sheet credit exposures, including unfunded loan commitments and standby letters of credit
- Purchased financial assets with credit deterioration (PCD assets), which get a different day-one accounting treatment
Allowances flow into specific regulatory filings, and examiners know exactly where to look. Banks report the allowance for credit losses on loans and leases primarily in Call Report Schedule RI and RC, with granular detail in schedules that map to line items like AS0048 for the allowance balance and related provision expense lines. Credit unions file comparable detail through NCUA Call Report schedules. The reporting cadence is quarterly, which means every quarter’s forecast revision has to be re-justified, not just recalculated.
One provision practitioners underuse: FASB allows reversion to historical loss information once you move beyond the period you can reasonably forecast. You don’t have to invent a ten-year macro forecast. You build a defensible near-term forecast, then revert to a historical average for the remaining life of the asset, and you document exactly where that reversion point sits and why.
Industry Data and Benchmarks That Contextualize CECL Outputs
The single most useful industry number for CECL validation is the reserve coverage ratio, calculated as the allowance for credit losses divided by noncurrent loans. It tells you, and your examiner, whether your reserve level is keeping pace with credit deterioration across the system, not just inside your own portfolio.
Statistic Callout: The industry’s reserve coverage ratio fell to 178.4% in the third quarter of 2025, according to the FDIC’s Quarterly Banking Profile.
That decline matters for two reasons. First, it signals that noncurrent loans are growing faster than reserves industry-wide, which is exactly the kind of directional shift an examiner will ask you to explain if your institution’s ratio is moving the other way. Second, it gives you a peer benchmark to test your own model outputs against before an examiner does it for you.
The FDIC’s Quarterly Banking Profile publishes this data every quarter alongside provision expense, net charge-off rates, and net interest margin, all segmented enough to build a rough peer comparison. Building a real peer cohort takes more than pulling one national number, though. Effective benchmarking groups institutions by:
- Asset size tier (community bank versus regional versus large complex institution)
- Geographic footprint, since regional credit cycles diverge meaningfully
- Loan portfolio mix (commercial real estate heavy versus consumer heavy versus agricultural)
- Charter type, because credit union loss patterns don’t map cleanly onto bank call report categories
A straight national average will mislead you if your book skews toward a segment moving against the broader trend. NAICS-coded, cohort-level industry data narrows that noise considerably. Even then, treat any peer comparison as a directional check, not a precise calibration input. Small sample sizes within a niche asset class or geography can swing a ratio by double digits in a single quarter, and an examiner will notice if you lean on a benchmark that isn’t statistically stable.
Data Requirements and Retention for Lifetime Loss Estimates
Your model is only as good as the fields feeding it, and CECL demands more granularity than most legacy loss-reserve systems were built to capture. Regulators have been explicit that institutions may need to collect and retain data they never needed under the incurred-loss model.
The essential loan-level fields include:
- Origination date and contractual maturity date
- Original par amount and current outstanding balance
- Charge-off date, charge-off amount, recovery date, and recovery amount
- Collateral type and current valuation, where applicable
- NAICS code for commercial borrowers, to enable industry-level segmentation
- Vintage (origination year or quarter) and seasoning (time since origination)
- Contractual term structure, including amortization schedule and rate reset terms
- Prepayment behavior and historical prepayment speeds by segment
Retention policy deserves its own line item in your governance plan. Once a loan pays off or charges off, the temptation is to archive it and move on. Don’t. Paid-off and charged-off loan histories are exactly what feed vintage curves and lifetime loss-rate proxies, and Federal Reserve supervisory guidance points directly at retaining that data as reasonably available rather than purging it on a standard records-retention schedule.
Pro Tip: Coordinate with your core loan servicing provider before you finalize your data retention policy. Most core systems purge charged-off loan detail faster than CECL model needs require, and fixing that after the fact means rebuilding vintage curves from incomplete history.
Document every qualitative adjustment you layer onto quantitative outputs, and keep a traceable link between each external forecast input (unemployment projections, regional housing indices) and the model line it feeds. Examiners will ask you to walk that chain end to end.
Estimation Methods: Which One Fits Your Portfolio
CECL doesn’t mandate a single calculation method, and that flexibility is either a gift or a headache depending on how much data infrastructure you already have.
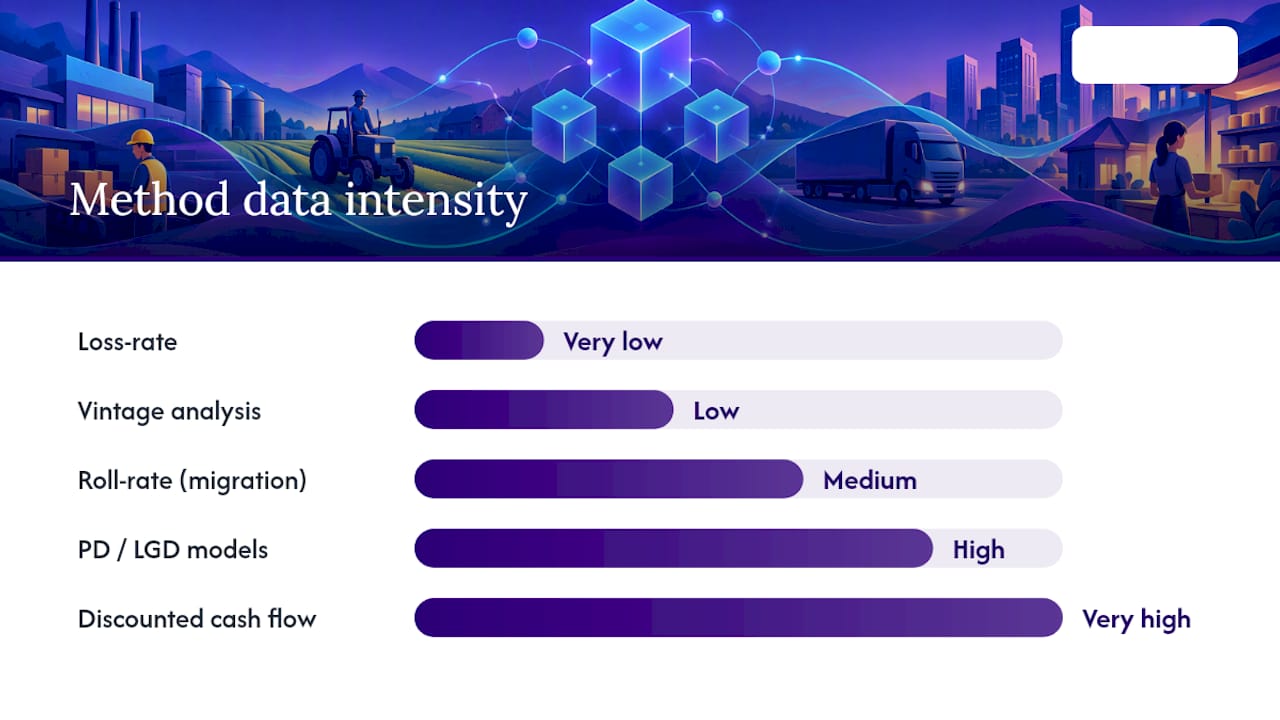
- Loss-rate method applies a historical average loss rate to a pool of similar-risk assets. It’s the lowest data lift and works well for smaller, homogeneous portfolios where loan-level granularity isn’t practical.
- Roll-rate (migration) method tracks how loans move between delinquency buckets over time, then applies transition probabilities to current balances. It needs longer delinquency history but captures credit deterioration earlier than a flat loss rate.
- Vintage analysis groups loans by origination period and tracks cumulative losses by age, which is particularly strong for term loans and installment products with predictable loss curves.
- Discounted cash flow (DCF) projects expected cash flows loan by loan, discounts them at the effective interest rate, and compares the present value to amortized cost. It’s the most data- and resource-intensive method, but it also gives the most precise result for complex or long-duration assets.
- PD/LGD (probability of default / loss given default) models separate the likelihood of default from the severity of loss, which suits large, diversified portfolios like credit card books where segment-level default behavior is statistically stable.
A small community bank with a few hundred million in assets and a plain-vanilla loan book usually gets adequate results from loss-rate or vintage methods. A large regional bank with commercial real estate concentration risk typically needs roll-rate or DCF to capture migration patterns examiners expect to see modeled explicitly. Credit card portfolios almost always run PD/LGD, because the transaction volume supports statistically meaningful segmentation.
Whichever method you choose, document the selection rationale and the calibration inputs together. An examiner reviewing your model package wants to see why this method fit your portfolio, not just what the output was.
The NCUA Simplified CECL Tool and WARM for Smaller Institutions
Credit unions under $100 million in assets, and other institutions with less complex portfolios, have a lower-cost path into CECL compliance through the NCUA’s Simplified CECL Tool, built on the Weighted Average Remaining Maturity (WARM) method.
WARM calculates expected losses using three main inputs: the current loan balance, a historical annualized net charge-off rate, and a remaining-life factor tied to the loan’s weighted average remaining maturity. The NCUA’s model documentation confirms the tool organizes loans into pooled and individually evaluated segments, applying WARM factors sourced from third-party historical loan datasets rather than the institution’s own book alone.
The advantages are real: the tool is Excel-based, transparent in its calculation logic, and dramatically lowers the modeling burden for institutions without a quantitative modeling team on staff.
- Requires only current balances, historical net charge-off rates, and remaining maturity data as core inputs
- Applies pre-built WARM factors rather than requiring the institution to build its own transition matrices
- Produces a documented, auditable output that examiners can trace step by step
- Still requires qualitative overlay adjustments for current conditions and forecast factors not captured in the historical rate.
The limitation is that WARM factors are proxies, built from external datasets, not necessarily your specific portfolio’s risk profile. NCUA guidance and industry practitioners agree that institutions should recalibrate those factors periodically to reflect their own charge-off experience once enough internal history accumulates.
Pro Tip: Run the Simplified CECL Tool output side by side with your actual net charge-off history for at least two quarters before your first CECL reporting period. If the gap between the WARM-based estimate and your internal loss rate exceeds what you can explain qualitatively, that’s your signal to adjust the factor, not just add a bigger overlay.
Examiners reviewing Simplified Tool usage will still expect evidence that management validated the WARM factors against the institution’s own portfolio characteristics, not just accepted the third-party default.
Regulatory Guidance and What Examiners Actually Check
The interagency FAQs make one point clearly: CECL does not require searching all possible information. Supervisory guidance from the OCC and its counterpart agencies scales expectations to an institution’s size and complexity, and “reasonably available” information is the operative standard, not exhaustive data collection.
That said, examiners come prepared with a consistent checklist regardless of institution size:
- Data lineage. Can you trace every model input back to its source system and show it reconciles to your general ledger?
- Segmentation rationale. Why did you group these loans together, and is the segmentation based on shared risk characteristics rather than administrative convenience?
- Forecast inputs. Where did the macroeconomic assumptions come from, and how did you decide when to revert to historical averages?
- Qualitative adjustments. Is every overlay documented with a specific rationale, or is it a plug number with no audit trail?
- Validation evidence. Has an independent party (internal audit, a model validation function, or a third party) tested the model’s assumptions and outputs?
Vendor-supplied models get extra scrutiny. If you license a third-party CECL platform, examiners expect you to document the vendor’s methodology, run independent challenge testing on its outputs, and show you understand the model well enough to defend it, not just the vendor’s marketing claims about it.
The red flags that trigger follow-up requests are predictable: assumptions that shift quarter to quarter without explanation, missing charge-off history that forces reliance on peer proxies without documented justification, and third-party inputs nobody at the institution has independently tested.
A Practical Implementation Checklist for Data, Systems, and Governance
Turning CECL requirements into an operating model comes down to sequencing. Here’s a realistic order of operations.
- First 30 days: Audit your existing loan-level data for gaps in origination dates, charge-off detail, and NAICS coding. Identify which fields your core system already captures versus which ones require a manual build.
- Days 30 to 60: Reconcile historical charge-off records against general ledger provision entries for at least the past five years, longer if your asset classes have longer average lives. This is where retained payoff and charge-off history pays off.
- Days 60 to 90: Finalize segmentation logic and select your estimation method per portfolio segment, documenting the rationale for each choice.
- Ongoing: Build a governance package that assigns clear ownership for model inputs, forecast selection, qualitative overlays, and validation testing.
Your governance documentation should include an owner matrix naming who’s accountable for each model component, a written validation plan with testing frequency, and a standing package ready to hand an examiner without a scramble. Reconciliation is the final link: every quarter, map your model’s segment-level outputs directly to the Call Report lines they feed, so provision expense and allowance balances tie out cleanly between your internal model and your regulatory filing.
Pro Tip: Build your reconciliation template before your first live CECL reporting quarter, not after. Retrofitting a reconciliation process onto three quarters of unreconciled model output is far more painful than building it into your initial rollout.
How Granular Industry Data Strengthens CECL Model Defensibility
Benchmarking against national or regional peer data does more than satisfy an examiner’s curiosity. It gives your loss-rate proxies, WARM calibration, and vintage cohort selections an external reference point that reduces the odds your model drifts from reality without anyone noticing.
Research from the Federal Reserve’s economic staff found that banks investing more in information systems and human capital under CECL produce more timely, forward-looking loan loss provisions. Granular data infrastructure isn’t a compliance afterthought. It’s a direct input into how good your forecast actually is.
Statistic Callout: Institutions that pair internal loss history with independently sourced industry benchmarks reduce the risk of an examiner finding your model’s peer comparison too thin to support its conclusions.
Bizminer supplies NAICS-coded industry financial benchmarks across more than 9,000 markets, segmented by geography and company size, along with customizable reports and API feeds built for exactly this kind of validation work. Bizminer data has been accepted in U.S. Tax Court and used by government agencies, which speaks to the kind of documentation trail examiners look for.
External benchmarks work best as a triangulation tool, not a substitute. Align your segmentation definitions with the benchmark’s categories before comparing, adjust for known portfolio differences, and document every adjustment the same way you’d document an internal model assumption.
Author Perspective: Pragmatic Trade-Offs in CECL Implementation
Institutions with thin data infrastructure are usually better served by a transparent loss-rate or WARM approach than a sophisticated model they can’t fully explain to an examiner. Build the data pipeline and governance first. Model complexity without a clean audit trail creates more exam friction than it solves, and the FEDS research on information production backs that sequencing.
— Danny
How Bizminer Helps: Industry Benchmarks and Custom Reports for CECL Models
Building peer cohorts from scratch, quarter after quarter, eats time your accounting team doesn’t have. Bizminer gives you NAICS-segmented industry financial benchmarks across geography and company size, so you’re not stitching together national averages that don’t match your actual portfolio mix.

Those benchmarks map directly onto CECL workflows: use them to sanity-check loss-rate proxies against peer institutions of similar size, calibrate WARM factors against your specific asset class rather than a generic third-party estimate, and pull custom reports or API feeds that plug straight into your existing validation package. Because Bizminer data has been accepted in U.S. Tax Court and used by government agencies, it carries the kind of documentation weight an examiner takes seriously.
If your team needs a peer comparison for an upcoming exam cycle, start with the industry financial benchmarks landing page to see coverage for your segment, or check pricing for report and subscription options that fit your reporting cadence.
Sources
- FDIC Quarterly Banking Profile — Third Quarter 2025
- Simplified CECL Tool model development documentation — NCUA
FAQ
What Is CECL Industry Data Used For?
CECL industry data provides the peer benchmarks, NAICS-level context, and macro reference points institutions layer on top of internal loss history to build and validate a defensible allowance for credit losses. It’s most useful for sanity-checking model outputs against the reserve coverage ratios that the FDIC publishes each quarter.
Does Every Institution Need the Same CECL Estimation Method?
No. Method choice depends on portfolio complexity and available data, with loss-rate and vintage methods fitting simpler community bank portfolios and DCF or PD/LGD models suiting larger, more diversified books like credit card portfolios.
What Institutions Qualify for the NCUA Simplified CECL Tool?
Credit unions under $100 million in assets are the primary intended users of the NCUA’s Simplified CECL Tool, which uses the WARM method to estimate expected losses with lower modeling overhead.
How Often Do Reserve Coverage Ratios Change?
Reserve coverage ratios move every quarter alongside provision expense and noncurrent loan balances, and the FDIC reports updated figures in each Quarterly Banking Profile.
What Does Bizminer Charge for Industry Benchmark Reports?
Bizminer’s Industry Financial Performance and Industry Market reports are priced at $249 per report, while Financial Report, Market Report, Valuation Report, and Company Report products run $349 per report, all listed on the pricing page. Subscription pricing is available on request through the same page.