
Local business patterns are NAICS- and geography-segmented financial and operational benchmarks (margins, SDE, revenue per employee) used to value, advise, and prospect for businesses in a specific county, ZIP, or metro. The immediate move: pull comps filtered by NAICS code, revenue or SDE band, and geography, not a raw national average, before you draw any conclusion for a client.
TL;DR:
- Local business benchmarks should be filtered by NAICS code, revenue band, and geography, not by national averages, to ensure accuracy.
- Prioritize key metrics such as revenue trends, gross margins, seller’s discretionary earnings, and labor costs, using three to five years of data for reliable analysis.
- Use transaction databases and proprietary local reports to obtain actionable valuation multiples, ensuring data sources are documented precisely.
- Narrow the comparable set with specific filters and only widen geographic or industry parameters when necessary to maintain comparability.
- Recognize the limitations of local data, including small sample sizes and outdated information, and adjust comparisons for seasonality and accounting methods.
Table of Contents
- Why Granularity Beats National Averages in Local Business Patterns
- Key Metrics to Pull From Local Business Financial Patterns
- Where to Find U.S. Local-Market Benchmark Data
- How to Filter for Comparable Peer Groups, Step by Step
- Putting Local Patterns to Work: Valuation, Benchmarking, and Prospecting
- Where Local Business Patterns Fall Short
- A Working Analyst’s Take on Getting Comps Right
- How Bizminer Fits Into Local-Market Benchmarking Work
- Sources
Why Granularity Beats National Averages in Local Business Patterns
A national average for full-service restaurants tells you almost nothing about a client’s diner in a rural county with a thin labor pool and cheap rent. Cost of living, wage floors, and local competition shift margins by several points in either direction, and a national figure smooths all of that away.
BLS industry data is a solid starting point for structural measures like employment trends and wage levels, but its geographic and industry breakdowns often stop short of the granularity a valuation or advisory engagement needs. That’s the gap transaction-backed and proprietary local data fills.
National averages tend to mislead when:
- The client’s market has unusually high or low labor costs relative to the region.
- The industry has wide sub-segment variation (a NAICS code that lumps quick-service and fine dining together).
- Real estate or lease costs in the specific county diverge sharply from the metro or state figure.
- The comparison set mixes owner-operator businesses with larger, professionally managed ones.
Once you filter for geography and size, the picture usually looks different, sometimes uncomfortably so for a client expecting a rosier number.
Key Metrics to Pull From Local Business Financial Patterns
Building a defensible local-market profile means grabbing the right numbers, not all of them. A practical benchmarking playbook narrows this to a short list that actually moves a valuation or advisory conclusion.
Pro Tip: Pull three years of history at minimum. Five years is the standard that lets valuators and buyers move faster and price with more confidence, according to CT Acquisitions’ step-by-step valuation guidance.
Prioritize these metrics in order:
- Revenue and revenue trend — the baseline; flag any single year that swings more than 15% without explanation.
- Gross margin — reveals pricing power and cost control relative to local peers.
- Seller’s discretionary earnings (SDE) or EBITDA — the figure buyers and lenders actually price against.
- Revenue per employee — a fast efficiency check against sector norms.
- Inventory turnover — critical for retail, auto, and distribution NAICS codes.
- Customer acquisition cost and average ticket — especially useful for service and retail prospecting work.
- Labor cost per full-time-equivalent employee — often the single biggest swing factor between markets.
Sector margins vary enough to make blended figures dangerous. BizBuySell’s benchmarking data puts median discretionary earnings around 22.6% for auto repair businesses, a number that would badly misstate a construction company or a specialty retailer.
Where to Find U.S. Local-Market Benchmark Data
No single source covers everything, so the practical approach mixes three types of data.
- Public sources (BLS, Census): free, broad, and useful for wage levels and employment structure, but limited once you need county-level financial detail for a specific NAICS code.
- Transaction databases (BizBuySell, BVR/DealStats): closed-sale data shows what buyers actually paid, which is the most actionable signal for valuation multiples, far more useful than a theoretical industry average.
- Proprietary local reports and subscription platforms: worth paying for when a client engagement demands NAICS-specific, revenue-band-specific, geography-specific data that public sources simply don’t break out.
Pro Tip: Document which source fed which number in your workfile. A client or a Tax Court examiner asking “where did this multiple come from” deserves a one-line citation, not a shrug.
Combine sources when the engagement has real weight behind it, such as a local market analysis supporting a litigation valuation or a loan file.
How to Filter for Comparable Peer Groups, Step by Step
Sample size matters less than most analysts assume. Five tight, well-matched comps beat fifty loose ones, and that principle should drive your filter sequence.
- Start with NAICS code specificity. A six-digit code beats a four-digit code every time; “used car dealers” and “new car dealers” behave nothing alike financially.
- Apply a revenue or SDE band. A $400,000 revenue landscaping company and a $4 million one carry different margin structures and buyer pools.
- Layer in geography. County works for retail and personal services with tight local competition; metro-level often fits professional services better; ZIP-level rarely has enough transaction volume to be reliable.
- Filter for recency. Weight data from the last 24 to 36 months more heavily than older comps, especially post-pandemic where margins shifted structurally in some sectors.
- When comps run thin, widen geography before you widen NAICS. A same-industry comp from the next county over is usually more defensible than an adjacent industry in the same block.
Document every adjustment. A small business benchmarks resource is a useful reference point when you need to explain the filter logic to a client or reviewer.
Putting Local Patterns to Work: Valuation, Benchmarking, and Prospecting
The payoff for all this filtering shows up in three workflows accountants and advisors run constantly.
Valuation quick-check: normalize SDE or EBITDA, then multiply by a local, size-specific multiple pulled from tight comps, not a broad industry figure. Adjust for owner compensation, one-time expenses, and non-operating assets before you finalize.
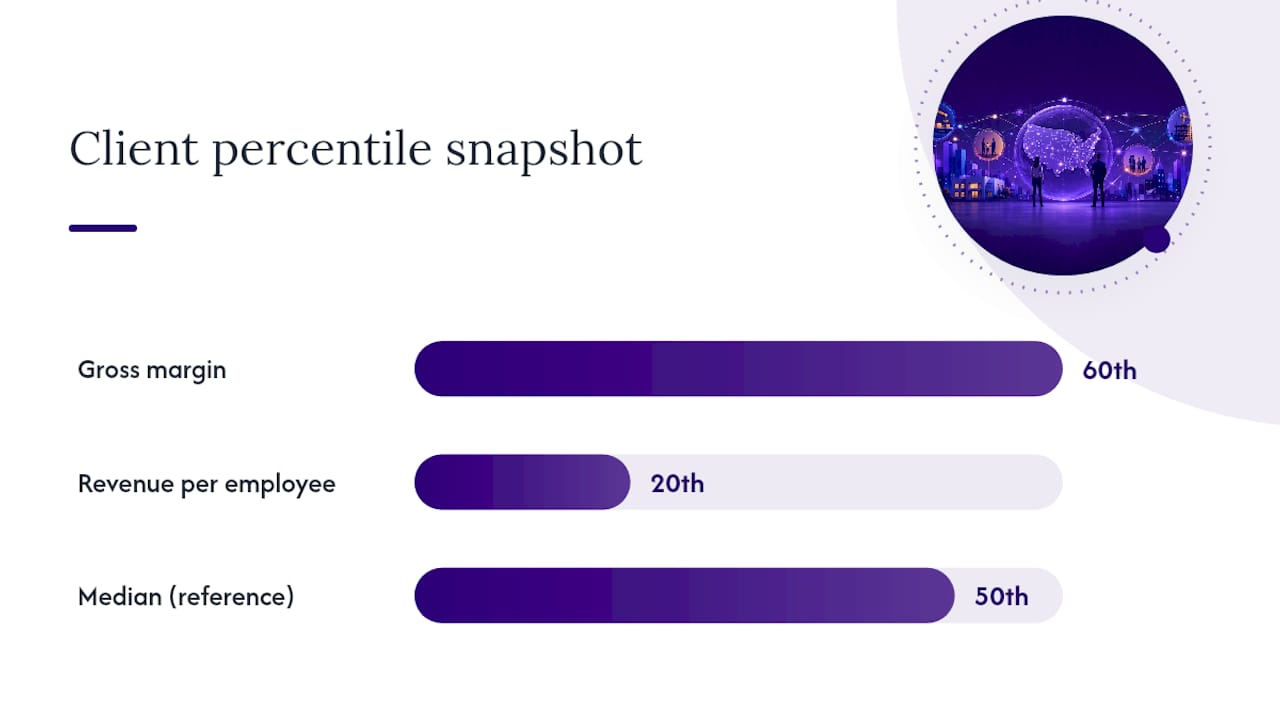
Client benchmarking reports: show the client’s position by percentile against local peers, not just a single average line. A business sitting at the 60th percentile for gross margin but the 20th for revenue per employee tells a much more useful story than one blended number.
Prospect lists: filter local patterns for above-median margins combined with visible growth trends and favorable demographic drivers (population growth, income levels, business density) to surface acquisition or advisory targets before competitors notice them.
- Normalize earnings first, always.
- Use percentile bands, not single averages, in client-facing reports.
- Cross-check any multiple against recent transaction data before presenting it as final.
Pro Tip: When a client pushes back on a valuation number, walking through the five comps you used, and why you excluded the sixth, resolves more disputes than any amount of theory.
Where Local Business Patterns Fall Short
Every local dataset has failure points worth flagging before a client relies on it. Sample sizes in thin markets can shrink to a handful of businesses, and stale data (anything older than three years) starts to drift from current conditions fast. Mis-specified NAICS codes are the quiet killer. A business self-reporting under the wrong six-digit code can throw off an entire comp set without anyone noticing.
Accounting-method differences and seasonality distort comparisons too. A cash-basis retailer and an accrual-basis competitor will show different margins for reasons that have nothing to do with performance, and a landscaping business’s Q2 numbers say little about its annual health on their own.
- Convert cash-basis figures to accrual where possible before comparing.
- Use rolling 12-month windows to smooth seasonal noise.
- Report medians and quartiles instead of simple averages; a CPA-focused benchmarking overview notes that averages let a handful of outliers distort the whole picture.
- Disclose data provenance and date ranges directly in the client deliverable.
A Working Analyst’s Take on Getting Comps Right
The instinct to grab the biggest available comp set is understandable and usually wrong. When I’ve walked through valuation files that leaned on twenty loose regional comps versus five tight ones matched on NAICS, revenue band, and county, the five-comp file held up better under scrutiny almost every time. Buyers, lenders, and courts don’t reward volume. They reward a defensible reason for every number on the page.
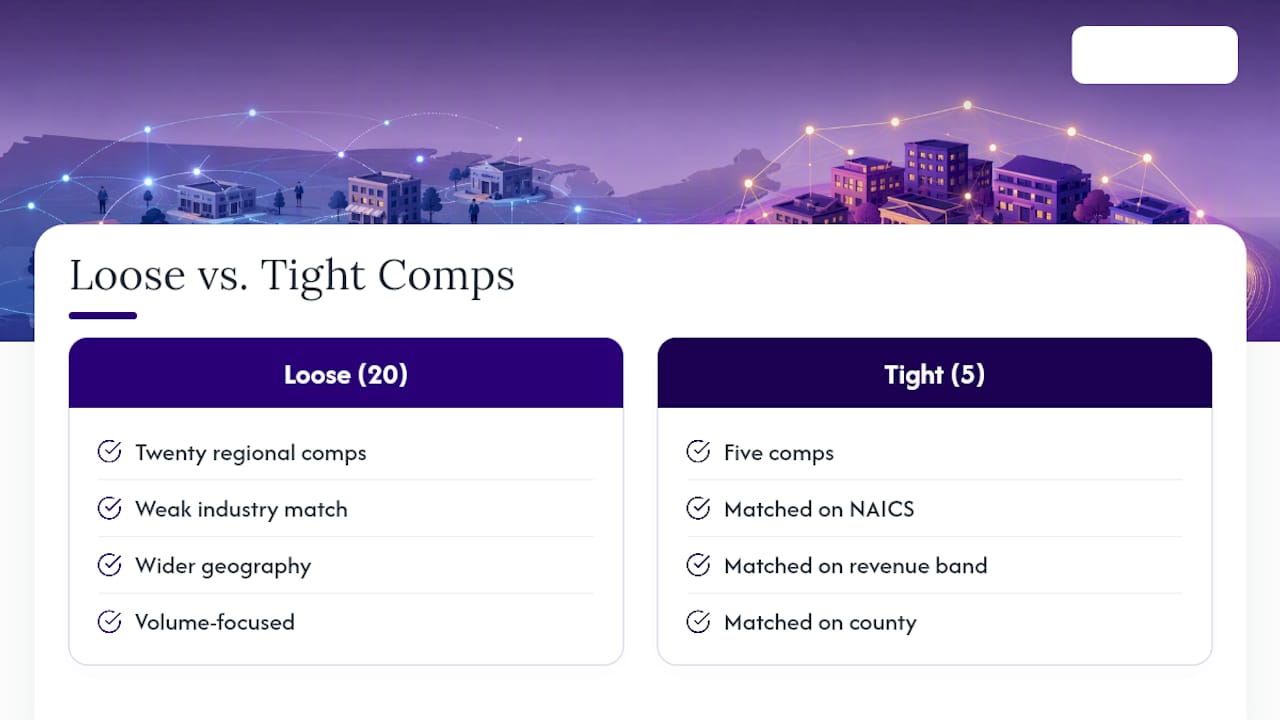
The habit worth building is narrow, then adjust. Pick the tightest NAICS and geography filter available, and only widen geography, never industry specificity, when the comp count runs too thin to trust. Write down every adjustment you make to owner compensation or one-time items, because that documentation is what survives a client’s second-guessing or a Tax Court examiner’s questions months later.
Talk to clients about why a number moved, not just what it is. A business owner who understands that their margin sits at the 35th percentile because of local labor costs, not poor management, trusts the report more than one who’s just handed a multiple and a total.
— Danny
How Bizminer Fits Into Local-Market Benchmarking Work
Bizminer is built for exactly the filtering problem this guide walks through: NAICS- and geography-specific reports across more than 9,000 markets, segmented by industry, revenue band, and location, instead of a blended national number that hides what’s actually happening in a client’s county.

For valuation work, benchmarking reports, or building a prospect list filtered by margin and growth signals, Bizminer’s customizable report tool pulls the same NAICS and revenue-band filters described above without you having to stitch together public and transaction data by hand. Bizminer data is used by government agencies, which matters when a client or reviewer asks where a multiple came from. If you’re building comps for a specific county or metro right now, request a sample report and see the granularity applied to your client’s actual NAICS code and market.
Sources
For structural industry measures like wages and employment, BLS Industry at a Glance is a free, reliable baseline. For transaction-backed valuation multiples, BizBuySell’s benchmarking guidance and BVR/DealStats reflect what buyers actually paid in closed deals, not theoretical figures. For step-by-step valuation methodology, CT Acquisitions’ owner’s guide lays out the comp-selection logic referenced throughout this piece. Always check any multiple against the most recent transaction data available before presenting it to a client.
- How to Benchmark Your Small Business | BizBuySell
- Industry at a Glance | Bureau of Labor Statistics
- How to Determine the Value of a Business: 2026 Owner’s Step-by-Step Guide – CT Acquisitions